CrudeOil Elliottwave View: Buy the dipStrategy: Buy the dip
------------------------------
CrudeOil is in correction phase and looking for W-X-Y correction on weekly chart where target for Y is above 55. On Short term, we are waiting for good opportunity to go long. After breakout of bullish inner channel, we are on sideline and looking to see support on outer bullish channel.
Dollar_index

1.24 is being tested as resistance 1.24 is the nearest resistance zone for GBPUSD and it is being tested as May announced triggering of Article 50.
1.24 stands in the way of GBPUSD and prevents it from continue towards 1.26 - The major weekly resistance zone I mentioned in this week's newsletter (check my website)
GBPUSD is still inside a trading range and can be traded on both sides from the current levels:
1) Bullish - A close above 1.245
2) Bearish - As long as it stays below 1.24 (or in case it'll reach 1.255-1.26)

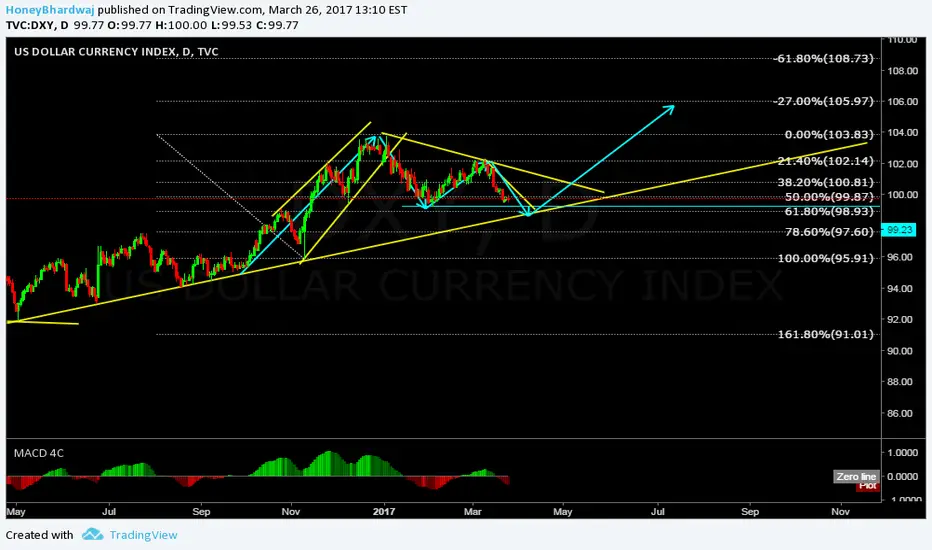
Dollar Index rally coming after completion of abc correction.Hello folks, Looking at dollar index I'm expecting rally to upside though that will not be as big by looking at divergence in monthly chart, but up move is coming so i'm looking for current move to break previous low confirming an abc pattern then we will see. happy trading:)

EURUSD inverted weeklyEURUSD inverted looks a lot like DXY dollar index
Fibonacci ratios
Could complete correction at USD/EUR=0.5
for a ratio 8/2

DXY DailyBullish above 101 with targets at 101.5 and 102
Bearish below 100 with target at 99
I would like to see the price go to 100.8 - 101, reverse from there and break 100.4, 100 levels all the way to 99 level.

DXY SHORTDollar Index falling down, last FED decision pushing it the same way. USA need money, Dollar became weaker, this will support Export in long term and bring more money to US economy.
Dollar index make corrections moves around 2,5%-3,5%. And long trends around 4,5% - 5,5%.
I expecting to go down 4,5% or even maybe to next support level around 96.72

Dollar Index | Daily viewIt will want one more up I think.
This is not a investment advice.
Take care.

Weekly support zone being tested1.2-1.21 - That's the price zone you should focus on if you are looking for bullish trades on GBPUSD.
The Cable is testing a weekly structure zone, psychological level and the PRZ of a daily bullish Bat pattern.

DXY weeklyDXY weekly
Try finding fibo ratios
Maybe wave d already finished at 8/3
Longterm chart
www.zerohedge.com

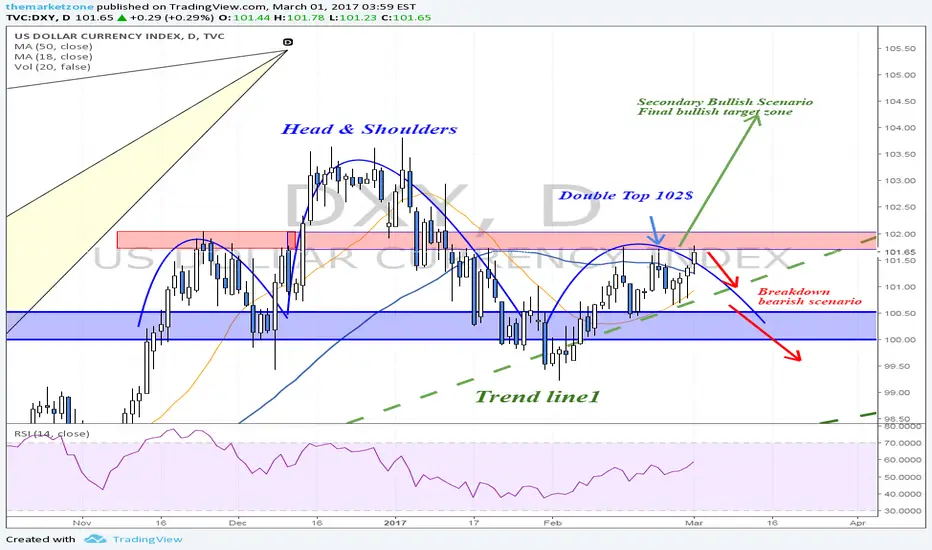
Double TopDXY is testing the neck line of Double top pattern beside 50% Fibonacci and Moving Average 50. expecting that prices will go to 101.00 and 100.75 respectively

Another attempt to break 102$DXY is up this morning following Trump's speech.
The Dollar is making another attempt to break above 102$ and continue towards 105$ to complete the bearish Crab pattern.
102$ is still a level that you can try and short DXY (or go long Majors) but notice that the Dollar bounced from the trend line and the Fast MA line - This is a sign of strength... not weakness.
Next high impact event for USD will be Yellen's speech on Friday.
(EURUSD & DXY) HOW INSTITUTIONAL TRADERS COMPARE THE MARKETS!MARKET ANALYSIS: As you can see from the charts both Eurusd and dollar index or showing opposite trade setups. So in Eurusd once the market breaks the flag pattern and closes above the zone we can go for a long. At the same time once dollar index closes below the rising wedge we can short the market below the zone for the given target.
Now this is how a institutional traders compares a trade setup with dollar index, Hope this helps. Cheers!

DXY H4 longAfter pull back to 61.8 % Fib I am looking at the price to break above 101.95 to go long 102.8
Alternatively bearish below 101.3

violently been pull back out of the 1220 ish battle zone Trump speach before congress had a nice effect on the usd and gold react accordingly , went strait back into the 1220 battle zone the got vilently faught back out of it . I mean this kind of candle just mean reaction and the next support to the up side would be the 1240 1245 zone for completion of an nice head and shoulder pattern . If those price manage to contend price action then we can start talking about a reversal in the dollar . but it to soon for that on the other side a breach on the other side of the 1250 mark would mean a continuation of the up trend on the gold , so new target on the up side and down target on usd
as usual dont hesitateto come and talk to us on our group : www.facebook.com

DXY Short (March 1, 2017)Today we ran a clean level of stops around 101.70 with a nice reaction and 4H pinbar. There has been some divergence in the recent up move though we could see more bullishness to 102-102.50 levels before turning. There is a liquidity void where orders were not filled around 99.00 which I believe we will need to fill before further upside.
