USD Index Technical Outlook – Key Buy & Sell LevelsThe U.S. Dollar Index (DXY) is currently trading inside a clear downward channel, showing a bearish market structure. Price is hovering near 98.23, just below the key resistance zone between 98.5 – 99.2, where Fibonacci retracement levels (0.382, 0.5, and 0.618) also align, making it a strong supply area. As long as price remains below this zone, the bias stays bearish, with potential downside targets at 97.5 and then 96.5, in line with the channel support and Fibonacci extensions. However, if buyers manage to push above 99.2, it would signal a possible trend reversal and shift the outlook towards bullish continuation. Overall, the structure suggests that the U.S. Dollar Index is more likely to face rejection near resistance and continue lower in the short term.
🔴 Sell Zone (Short Setup)
- 98.50 – 99.20 is a strong resistance area where price aligns with the Fibonacci retracement (0.382 – 0.618) and the upper channel trendline.
- Sell Trigger: If price shows rejection (bearish candles, wicks, or reversal patterns) within this zone.
🟢 Buy Zone (Long Setup)
- 97.50 – 96.50 area is the channel support and also near Fibonacci extension levels.
- Buy Trigger: Look for bullish confirmation (bounce, bullish engulfing, or rejection wicks).
Note
Please risk management in trading is a Key so use your money accordingly. If you like the idea then please like and boost. Thank you and Good Luck!
Dollarindex

EURUSD: Exhausting Uptrend Around 1.1930-1.2400The EUR/USD pair shows signs of losing momentum on the chart, which is expected as it is currently in the final (5th) wave of a larger wave C or 3.
The RSI indicates a second consecutive bearish divergence, but the uptrend could continue for a while. The price is likely to reach at least 1.1930, which is the level where wave C equals wave A, for symmetry.
The blue box highlights the target area based on the Fibonacci sequence. It starts at 1.1930 and peaks around 1.2400, where wave 5 of wave C is projected to cover 61.8% of the distance from wave 1 to wave 3.
We’re not predicting the reversal point yet; we’ll let the market reveal it in due time.
Wishing us all lucky trades!

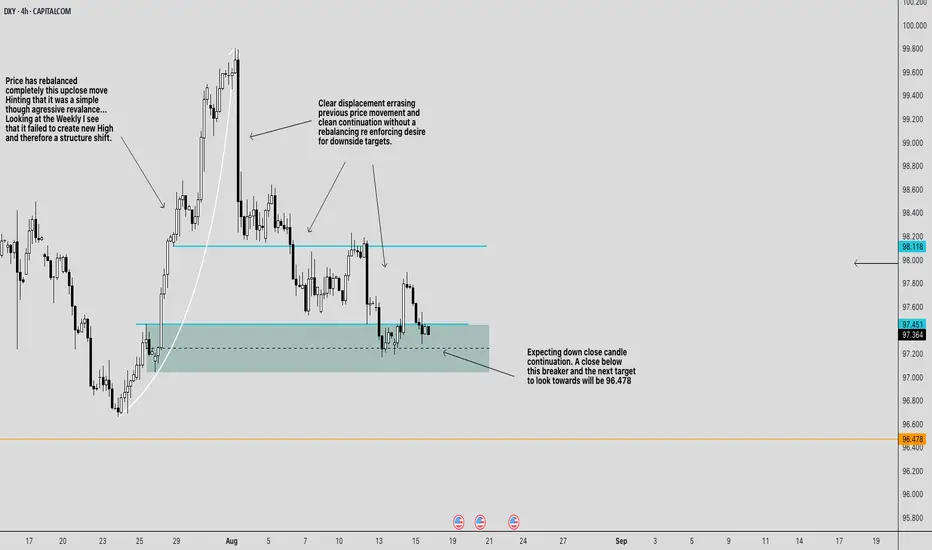
BEARISH CONTINUATION FOR DXYBearish Bias for CAPITALCOM:DXY
Weekly context:
The last up-move failed to print a new weekly high. Failing to create a shift in structure , so rallies are suspect.
4H structure:
We had a hard bearish displacement (large down candles) that erased prior price action and kept going without delivering a “full” rebalance. That usually means the price target remains lower .
The key zones on chart
Breaker / sell zone: \~ 97.45–97.75 (teal box). This is the prior bullish OB that failed (now acting as resistance).
Line in the sand: \~ 97.35–97.40 (dashed line through the teal). A decisive 4H close below here signals continuation.
Upside cap / invalidation area: 98.12 (cyan line) up to \~ 98.20 . Above this, the bearish sentiment weakens.
Primary downside draw: 96.478 (orange line). That’s the next obvious liquidity/inefficiency magnet on your chart.
Trade plan
Idea A — Rejection short from the breaker (preferred):
Entry: look for a rejection setup inside 97.45–97.75 (e.g., 15m/1h bearish shift after a sweep).
Stop: above the breaker and the cyan line ⇒ 98.12 (conservative) or 98.20 (safer).
Targets:
T1: 96.84 (take partials; pay yourself)
T2: 96.47.00
Idea B — Continuation after the break (confirmation play):
Trigger: a 4H close below \~97.35 .
Entry: sell the first clean pullback into 97.35–97.45 .
Stop: above 97.85–98.00 (back inside the breaker); conservative stop 98.12 .
Target: 96.478
Management & invalidation
If price rebalances deeper and closes 4H above 98.12–98.20 , the breaker is failing. Flatten shorts; reassess (potential squeeze toward 98.60–99.00 is then on deck).
If price hesitates at 97.00 , trail above the last 1H swing high to protect realized PnL while aiming for 96.478 .
News risk: Your chart flags upcoming US data (icons). Expect wicks; use hard stops and consider sizing down around releases.
Why this makes sense
* The strong displacement leg sets the draw lower.
* The teal box is a bearish breaker created by a failed bullish structure—ideal for “sell on rally.”
* The market rebalanced the prior up-close leg already; the lack of a symmetrical rebalance on the down-leg favors continuation to the next target ( 96.478 ).
One-liner: Bearish while 4H stays under 98.12 ; sell rallies into 97.45–97.75 or sell a 4H close-and-pullback below 97.35 ; scale out 97.20 → 97.00 → 96.80 → 96.478 ; hard stop above 98.12–98.20 .
*Not financial advice. Size appropriately and stick to your stop.*
PLEASE PUA!
Dollar Index (DXY) – Watching Both Sides LiquidityOn the daily timeframe, we can clearly identify liquidity resting on both sides of the chart:
Relative equal lows acting as sell-side liquidity.
Low-resistance highs representing buy-side liquidity.
From my perspective, the main draw on liquidity remains the sell-side lows. However, before targeting that area, price may first reach higher to grab the buy-side liquidity. Once this liquidity is collected, I expect a potential shift in momentum and a move to the downside.
💌It is my honor to share your comments with me💌
🔎 DYOR
💡Wait for the update!

XAUUSD 1hr | Gold - Bears are Coming !!Bearish Overview
Gold is entering a period of consolidation (sideways price action) and is currently positioned in the lower area of this consolidation zone. Watch how gold reacts on Sunday and Monday as we approach strong support. Gold looks to find more liquidity towards the lower lows. Gold is technically breaking down from a small 1 hr wedge (Labeled), which could drop the price closer to support and bearish territory.
Prices to look at:
3615
3600, If gold breaks below, look to sell to 3570-3580
Remember:
Gold is bullish! GOLD hit the DAILY breakout target in 2 weeks. Look to go long around support. Any bullish sign in this zone could lead to a bounce back up to the ATH

Head and Shoulders Pattern on U.S. Dollar Index (DXY) – Bearish Overview of the Idea (as shown in the chart)
The chart illustrates a Head and Shoulders (H&S) reversal pattern forming on the U.S. Dollar Index (DXY). This classical technical pattern signals a potential trend reversal from bullish to bearish.
Left Shoulder: The first peak followed by a pullback.
Head: A higher peak, forming the top of the pattern.
Right Shoulder: A lower peak compared to the head, roughly equal to the left shoulder.
Neckline: A support line connecting the lows between the shoulders. Once broken, it indicates potential bearish continuation.
The chart highlights:
A breakout below the neckline.
A retest of the neckline (common in H&S setups, where old support becomes resistance).
A projected downside target aligned with the height of the head-to-neckline move.
Detailed Analysis
1. Pattern Identification
The H&S is clear: higher high (Head) flanked by two lower highs (Shoulders).
The neckline is slightly ascending, but once broken, it signals sellers stepping in.
2. Breakout Confirmation
Price broke below the neckline, confirming the bearish pattern.
The retest at ~97.62 shows rejection, strengthening the bearish outlook.
3. Bearish Projection
Technical rule: the expected downside target is approximately equal to the distance from the head to the neckline, projected downwards from the breakout point.
The chart projects a move toward 97.25, which aligns with the marked support zone.
Timing
The projection points to Monday, 15/09/25, suggesting this bearish move may unfold in the upcoming trading sessions.
Walkthrough Thought Process
Think of the market like a battle between buyers and sellers:
The buyers pushed price higher (Head), but then failed to sustain strength at the right shoulder.
When price breaks the neckline, it shows sellers are gaining control.
The retest confirms that what was once support (neckline) has now become resistance.
This setup gives traders confidence to enter a short (sell) trade, targeting the projected downside.
Trade Idea
Entry : After retest rejection around 97.62.
Target (TP) : 97.25 (support zone based on H&S projection).
Stop Loss (SL) : Above the right shoulder at 97.80 (to protect if pattern fails).

DXY at Major Support – Dollar Ready to Rebound?Today, I want to analyze the DXY index ( TVC:DXY ) for you. First, I must say that this week, US indexes can have an impact on the DXY index trend .
US indexes to be released this week:
Core PPI m/m: Tomorrow
PPI m/m: Tomorrow
Core CPI m/m: Thursday
CPI m/m: Thursday
CPI y/y: Thursday
Unemployment Claims: Thursday
Prelim UoM Consumer Sentiment: Friday
Prelim UoM Inflation Expectations: Friday
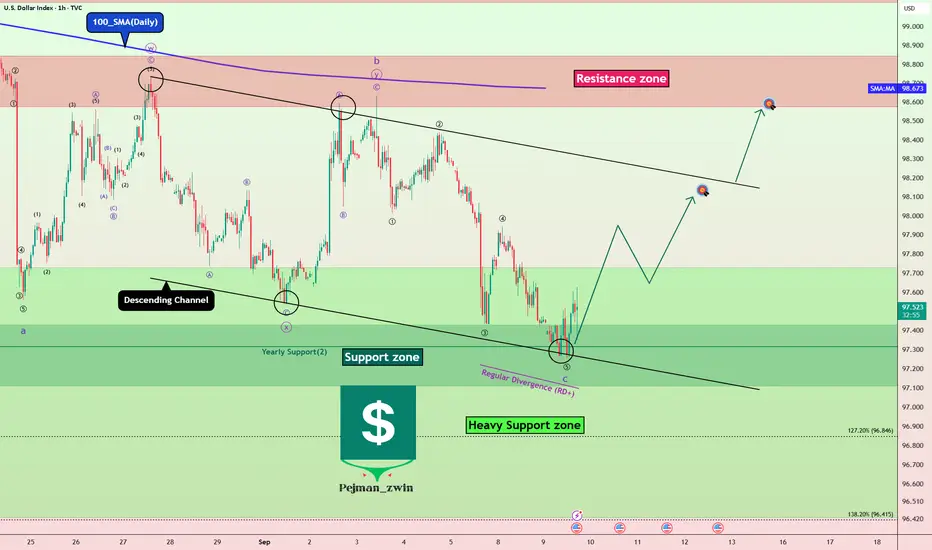
The DXY Index is currently moving near the Support zone($97.989-$97.834) , Yearly Support(2) , and the lower line of the descending channel .
In terms of Elliott Wave theory , it seems that the DXY index has managed to complete microwave 5 of the main wave C . The corrective structure is of the Zigzag Correction(ABC/5-3-5) type.
Also, we can see the Regular Divergence (RD+) between consecutive valleys .
I expect the DXY index to rise to at least $98.07(First Target) before the US indexes are announced.
Second Target: $98.56
Stop Loss(SL): $96.997
Note: With the DXY index rising, we can expect a correction in Gold( OANDA:XAUUSD ), Bitcoin( BINANCE:BTCUSDT ), and major Forex pairs (dollar strength).
Please respect each other's ideas and express them politely if you agree or disagree.
U.S. Dollar Index Analyze (DXYUSD), 1-hour time frame.
Be sure to follow the updated ideas.
Do not forget to put a Stop loss for your positions (For every position you want to open).
Please follow your strategy and updates; this is just my Idea, and I will gladly see your ideas in this post.
Please do not forget the ✅' like '✅ button 🙏😊 & Share it with your friends; thanks, and Trade safe.
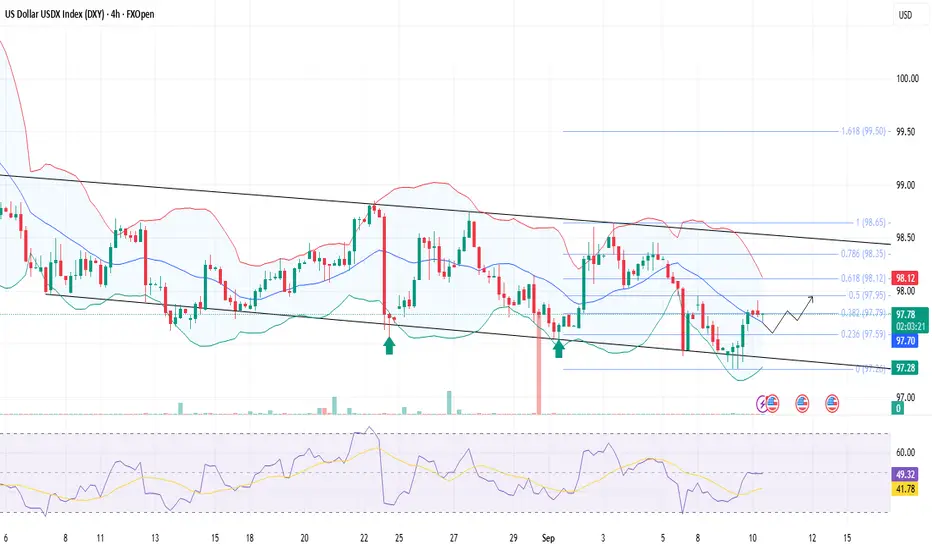
Brief Analysis of US DXYDXY is trading around 97.70, while trending within a descending channel formation, and holding above 97.60 (Fib support 0.236), with resistance seen near 97.80–98.00 zone.
The RSI is rising and holding near 46, showing mild recovery momentum but not yet strong enough for a breakout.
However, prices have taken a support at the middle Bollinger band, which might lift the dollar a little higher.
Price action suggests consolidation inside the descending channel; intraday bias stays neutral-to-bullish above 97.60.
PPI data stronger than expected could lift DXY toward 98.35–98.50, while weaker data may pressure it back toward 97.30.
The 10Y auction outcome will also guide direction — higher yields can support the dollar, while softer demand may weigh on it.
U.S. Dollar Index (DXY) Outlook | Gold (XAU/USD) Correlation📈 U.S. Dollar Index (DXY) at Key Support | 🪙 Gold at Record Highs
🔎 Quick Summary:
• DXY holding 97.70 support inside a descending channel.
• A rebound could push it back toward 98.25 – 98.50.
• Meanwhile, Gold is sitting near $3,600/oz, at all-time highs, fueled by safe-haven demand and central bank buying.
• The DXY’s next move will help decide if Gold keeps climbing or pauses.
⸻
💵 U.S. Dollar Index (DXY) Outlook
On the 4H chart, the Dollar Index remains inside a descending channel. It has been forming lower highs and lower lows, yet the 97.70 level has repeatedly held as strong support.
• 🔹 Buyers are defending this zone, showing demand.
• 🔹 A rebound could take price back to the 98.25 – 98.50 supply zone.
• 🔹 A breakout above 98.50 would be significant, opening room toward 99.00+.
This makes the 97.70 region a critical turning point for DXY.
⸻
🪙 Gold (XAU/USD) Context
Gold is trading at record highs around $3,600/oz 🚀 — a level never seen before.
• 🌍 Central banks continue to accumulate gold aggressively.
• 🏦 Expectations of Fed rate cuts reduce the opportunity cost of holding gold.
• ⚖️ Persistent economic and geopolitical uncertainty is fueling safe-haven demand.
Correlation with DXY:
• 📉 If the Dollar rebounds, Gold could slow down or consolidate after its massive rally.
• 📈 If the Dollar breaks below support, Gold could see further upside, possibly testing higher targets near $3,700/oz and beyond.
⸻
📊 Conclusion
The Dollar Index is sitting at make-or-break support. A bounce would show Dollar strength and may cool off Gold’s rally. But if DXY weakens further, Gold could extend its surge into new record territory.
At this point, Gold remains the undisputed leader in the market, with DXY’s next move likely deciding how fast momentum continues.
⸻
⚡ Summary in one line:
💵 DXY at critical support — 🪙 Gold shining at record highs, waiting for the Dollar’s next move.

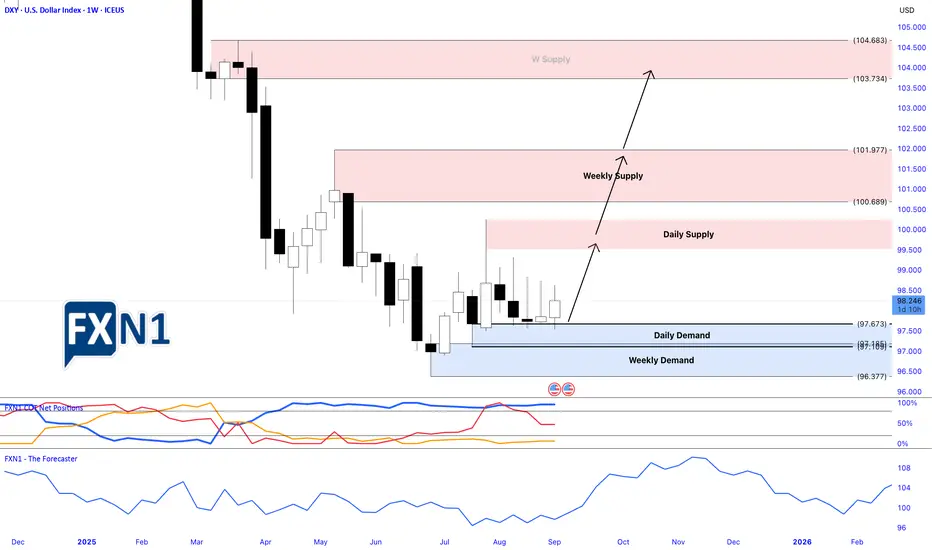
Is the DXY Poised for a Breakout?Analyzing the Bullish PotentialThe DXY (US Dollar Index) appears to be on the verge of a significant upward rally. Last week, I shared my analysis highlighting a potential trigger point for a long entry, which the price subsequently surpassed, confirming the setup. According to the latest COT reports, commercial traders have reached their highest net positions of 2023. Historically, whenever commercials hit new highs, it often signals the beginning of a bullish trend in the DXY.
Additionally, we observe that many currencies measured against the dollar have weakened recently, supporting my thesis of a continued upward move for the DXY. Seasonal patterns also point toward a potential bullish phase.
Is this the moment for the DXY to initiate a strong bullish trend? Only time will tell, but the technical and fundamental signals are aligning in favor of a possible rally.
✅ Please share your thoughts about Dollar index in the comments section below and HIT LIKE if you appreciate my analysis. Don't forget to FOLLOW ME; you will help us a lot with this small contribution.
DXY Dollar Index NFP monday journal Forecast Crystal Clear to me Dollar will keep getting stronger till NFP on friday, reversal level should be around 99/ 99.25 then big drop towards 92.50
Thats a Big drop don't miss it
GG

Dollar Index Surges:Bullish Momentum Sparks New OpportunitiesThe DXY Dollar Index Futures kicked off the new week with a strong bullish candle, signaling renewed upward momentum. According to the latest Commitment of Traders (COT) data, non-commercial traders are reducing their bearish bets, indicating a shift in market sentiment. Meanwhile, commercial traders are holding positions at levels not seen since 2021, suggesting confidence in the dollar’s strength. Retail traders, on the other hand, continue to push against the trend, maintaining bearish pressure. Recently, the price retested a key demand zone at the end of last week, which could present a strategic buy opportunity at a discounted level. What are your thoughts on this setup?
✅ Please share your thoughts about DXY in the comments section below and HIT LIKE if you appreciate my analysis. Don't forget to FOLLOW ME; you will help us a lot with this small contribution.

DX1! (US Dollar Index) — Fundamental Outlook: Bearish BiasThe U.S. dollar remains under sustained pressure as markets move into September. The Federal Reserve has signaled readiness to deliver its first rate cut in September, following confirmation that July PCE inflation remained steady at 2.6% y/y, while consumer spending continued to soften. This combination supports the case for monetary easing to protect the labor market and broader economic momentum.
Positioning data show that the market is already heavily short USD, creating short-term risk of squeezes on stronger-than-expected U.S. data — particularly the September 5 NFP release, which could delay the Fed’s easing trajectory if labor proves resilient. However, the medium-term consensus across major investment banks (JPMorgan, Citi, Goldman Sachs) is that the dollar will weaken further as the Fed embarks on a cutting cycle while the ECB, BoE, and SNB remain relatively more cautious.
➡️ Bias: Sell rallies in DX1! with tactical awareness of NFP risk. Medium-term bearish trend intact, Fed easing the dominant driver.

DXY Dollar Index: Technical Analysis & Trading Strategy Forecast# DXY Dollar Index: Comprehensive Technical Analysis & Trading Strategy Forecast
Asset Class: US Dollar Index (DXY)
Current Price: 97.855 (as of August 30, 2025, 12:59 AM UTC+4)
Analysis Date: August 31, 2025
Market Context: Post-correction consolidation phase with emerging bullish momentum
Executive Summary
The Dollar Index (DXY) is currently trading at 97.855, showing signs of stabilization after a significant decline from yearly highs. Our multi-dimensional technical analysis reveals a critical juncture where multiple timeframes converge, presenting both intraday scalping opportunities and swing trading setups. The analysis incorporates advanced pattern recognition, wave theory, and momentum indicators to provide actionable trading insights.
Current Market Landscape
The DXY exchange rate rose to 97.8549 on August 29, 2025, up 0.04% from the previous session, indicating short-term stabilization. However, over the past month, the United States Dollar has weakened 1.96%, and is down by 3.81% over the last 12 months. This presents a complex technical picture where short-term bullish momentum may be developing within a broader corrective phase.
The DXY Dollar Index Futures kicked off the new week with a strong bullish candle, signaling renewed upward momentum, supported by non-commercial traders reducing their bearish bets according to recent COT data.
Multi-Timeframe Technical Analysis
Elliott Wave Theory Analysis
Based on recent Elliott Wave patterns, the descent from the May 29, 2025 high is currently unfolding as a five-wave impulse Elliott Wave pattern. From this high, wave ((i)) concluded at 98.35, followed by a corrective rally in wave ((ii)). The rally formed as an expanded flat, peaking at 99.43.
Wave Count Structure:
Primary Wave: Currently in corrective Wave 4 of larger degree cycle
Intermediate Count: Completing 5-wave decline from 2025 highs
Near-term: Potential Wave 5 completion around 96.50-97.00 zone
Elliott Wave Targets:
Immediate Support: 96.80-97.00 (Wave equality zone)
Key Resistance: 99.40-99.80 (Previous Wave ((ii)) high)
Major Resistance: 101.50-102.00 (Fibonacci confluence)
Harmonic Pattern Analysis
Active Patterns:
1. Potential Bullish Bat Pattern forming on 4H-Daily timeframe
- X to A leg: 103.50 to 96.20
- A to B retracement: 38.2% at 98.98
- B to C projection: 88.6% of AB at 97.15
- Completion zone: 96.50-96.80 (88.6% XA retracement)
2. Bearish Gartley Pattern (Completed)
- Generated sell signals at 99.20-99.50 range
- Currently in profit-taking phase
Fibonacci Confluence Zones:
Strong Support: 96.50-96.80 (Multiple harmonic convergence)
Resistance Cluster: 98.80-99.20 (38.2% and 50% retracements)
Major Resistance: 101.20-101.80 (61.8% golden ratio)
Wyckoff Theory Assessment
Current Phase: Potential Accumulation Phase (Spring Test)
Distribution Phase: Completed at 2025 highs (103.50+ region)
Markdown Phase: May-August 2025 decline
Current Position: Testing Spring levels around 96.50-97.50
Wyckoff Signals:
- Volume divergence suggests smart money accumulation
- Price action showing reduced selling pressure
- Potential for markup phase if 98.50 resistance breaks
W.D. Gann Analysis
Gann Square of 9:
- Natural resistance at 98 (perfect square)
- Strong support at 96 (key Gann level)
- Next major target: 100 (psychological and Gann confluence)
Gann Time Theory:
- Current time cycle suggests reversal window: September 3-10, 2025
- Major time square due: October 2025 (90-degree angle)
- Price-Time balance suggests equilibrium around 97.50
Gann Angles:
- 1x1 angle from August lows: 97.20 (active support)
- 2x1 resistance line: 98.60
- 1x2 support angle: 96.40
Ichimoku Kinko Hyo Analysis
Current Cloud Status:
- Price below Tenkan-sen (97.95) - Short-term bearish
- Kijun-sen at 98.40 acting as dynamic resistance
- Cloud (Kumo) resistance: 99.20-99.80
- Future Cloud: Thinning, suggesting volatility ahead
Ichimoku Signals:
- TK Cross: Pending bullish crossover if price holds above 97.50
- Cloud breakout target: 99.80+
- Support levels: Kijun-sen (98.40), Tenkan-sen (97.95)
Technical Indicators Analysis
Relative Strength Index (RSI)
Daily RSI: 42.5 (Oversold but not extreme)
4H RSI: 38.2 (Approaching oversold territory)
1H RSI: 45.8 (Neutral zone)
Divergence Alert: Bullish divergence forming on 4H timeframe
Bollinger Bands (BB)
Current Position: Lower third of bands
Band Width: Contracting (low volatility environment)
Squeeze Setup: Potential breakout within 3-5 trading days
Direction Bias: Slight bullish based on band position
Volume Weighted Average Price (VWAP)
Daily VWAP: 98.12 (resistance)
Weekly VWAP: 98.85 (major resistance)
Monthly VWAP: 99.45 (significant overhead supply)
Moving Averages Confluence
SMA 20: 98.15 (immediate resistance)
EMA 50: 98.75 (intermediate resistance)
SMA 200: 100.20 (major trend line)
Current Status: Below all major MAs (bearish bias)
Candlestick Pattern Recognition
Recent Formations:
1. Doji Star (August 29) - Indecision at support
2. Hammer Pattern (August 30) - Potential reversal signal
3. Bullish Engulfing setup developing
Pattern Implications:
- Short-term reversal signals strengthening
- Volume confirmation needed for validation
- Risk-reward favors long positions with tight stops
Market Structure & Support/Resistance
Key Support Levels:
1. 97.20-97.40 - Immediate support (Gann 1x1 angle)
2. 96.80-97.00 - Major support (Harmonic completion)
3. 96.20-96.50 - Critical support (Previous reaction low)
4. 95.50-95.80 - Ultimate support (2024 major low)
Key Resistance Levels:
1. 98.15-98.40 - Immediate resistance (SMA 20 + Kijun-sen)
2. 98.80-99.20 - Intermediate resistance (Fibonacci + VWAP)
3. 99.40-99.80 - Major resistance (Elliott Wave + Cloud)
4. 101.20-101.80 - Long-term resistance (Multiple confluences)
Trading Strategy & Time Frame Analysis
Intraday Trading Strategy (5M - 4H Charts)
Bullish Scenario (Probability: 60%)
Entry Zone: 97.40-97.60 (on pullback)
Stop Loss: 97.15 (below harmonic completion)
Target 1: 98.15 (Daily SMA 20)
Target 2: 98.60 (Gann 2x1 angle)
Target 3: 99.20 (Fibonacci resistance)
Risk-Reward: 1:2.5
Bearish Scenario (Probability: 40%)
Entry Zone: 98.40-98.60 (on failed breakout)
Stop Loss: 99.00 (above key resistance)
Target 1: 97.60 (immediate support)
Target 2: 96.80 (Harmonic target)
Target 3: 96.20 (Major support)
Risk-Reward: 1:2.8
Swing Trading Strategy (4H - Monthly Charts)
Primary Long Setup:
Accumulation Zone: 96.50-97.50
Confirmation: Break above 98.80 with volume
Swing Target 1: 100.20 (SMA 200)
Swing Target 2: 102.50 (61.8% retracement)
Ultimate Target: 105.00 (2025 high retest)
Stop Loss: Below 96.20
Position Sizing: 2% risk per trade
Time Horizon: 4-8 weeks
Alternative Short Setup:
Entry Condition: Failure at 99.50 resistance
Confirmation: Break below 97.00 support
Target 1: 95.50 (2024 low)
Target 2: 93.80 (Extended projection)
Stop Loss: Above 100.00
Time Horizon: 6-10 weeks
Weekly Trading Plan (September 2-6, 2025)
Monday-Tuesday: Consolidation Expected
Range: 97.20-98.40
Strategy: Range trading, fade extremes
Key Events: Watch for volume expansion
Wednesday-Thursday: Potential Breakout
Catalyst: Economic data releases
Scenarios: Break above 98.60 (bullish) or below 97.00 (bearish)
Strategy: Breakout trading with confirmation
Friday: Trend Continuation
Focus: Weekly close positioning
Strategy: Hold winners, cut losers
Risk Management: Reduce position sizes before weekend
Risk Management Framework
Position Sizing Rules:
Intraday: Maximum 1% risk per trade
Swing: Maximum 2% risk per trade
Portfolio: Total DXY exposure not exceeding 5%
Stop Loss Guidelines:
Intraday: 25-30 pips maximum
Swing: 80-120 pips based on volatility
Time-based: Exit if no progress in 5 trading days
Profit Taking Strategy:
Scale out: 50% at first target, 30% at second, 20% runner
Trailing stops: Implement after 1:1 risk-reward achieved
Weekend rule: Close 70% of intraday positions before Friday close
Market Psychology & Sentiment
Current Sentiment Indicators:
COT Data: Non-commercial traders reducing bearish bets
Options Flow: Put-call ratio normalizing from extreme levels
Technical Sentiment: Oversold conditions with emerging reversal signals
Psychological Levels:
98.00: Round number resistance (psychological barrier)
100.00: Major psychological milestone
95.00: Critical psychological support
External Factors & Market Context
Geopolitical Considerations:
- Federal Reserve policy stance monitoring required
- Global economic data impacts (ECB, BOJ decisions)
- Geopolitical tensions affecting safe-haven demand
Economic Calendar Watch:
- NFP data (First Friday of month)
- Fed speakers and policy minutes
- Inflation data releases
- Global PMI readings
Advanced Pattern Alerts
Bull Trap Warning:
Setup: False break above 99.00 followed by immediate reversal
Confirmation: Heavy volume on break, light volume on decline
Response: Wait for 4H close below 98.20 before shorting
Bear Trap Alert:
Setup: False break below 96.80 with quick recovery
Confirmation: Immediate buying pressure and volume surge
Response: Long entry on return above 97.20 with tight stops
Technology Integration
Automated Alerts Setup:
1. Price Alerts: 96.80, 97.50, 98.60, 99.20
2. RSI Alerts: <30 (oversold), >70 (overbought)
3. Volume Alerts: 150% above 20-day average
4. Pattern Alerts: Harmonic completion, Elliott Wave targets
Trading Platform Integration:
TradingView: Custom indicator stack with all mentioned tools
MT4/MT5: Expert Advisor for automated entries
Risk Management: Position sizing calculators
Conclusion & Forecast Summary
The DXY Dollar Index stands at a critical technical juncture with multiple analytical frameworks suggesting a potential reversal from current levels. The convergence of Elliott Wave completion zones, harmonic pattern targets, and Wyckoff accumulation signals creates a compelling risk-reward setup for both intraday and swing traders.
Primary Scenario (65% probability): Consolidation between 96.80-98.60 followed by breakout to 100.20+ levels over the next 4-6 weeks.
Alternative Scenario (35% probability): Failed recovery leading to extended decline toward 95.50-94.00 zone.
Trading Bias: Cautiously bullish with defensive positioning until confirmation above 98.80 resistance cluster.
Key Success Factors:
- Strict adherence to risk management protocols
- Multiple timeframe confirmation before major position increases
- Continuous monitoring of Federal Reserve policy developments
- Adaptation to changing market structure and volatility conditions
---
*This analysis incorporates advanced technical methodologies including Elliott Wave Theory, Harmonic Patterns, Wyckoff Analysis, Gann Theory, and Ichimoku Kinko Hyo, combined with traditional indicators and market structure analysis. All price targets and support/resistance levels are derived from mathematical relationships and historical price behavior patterns.*
Risk Disclaimer: Past performance is not indicative of future results. All trading involves substantial risk of loss. This analysis is for educational purposes and should not be considered as financial advice. Traders should conduct their own analysis and consider their risk tolerance before making trading decisions.

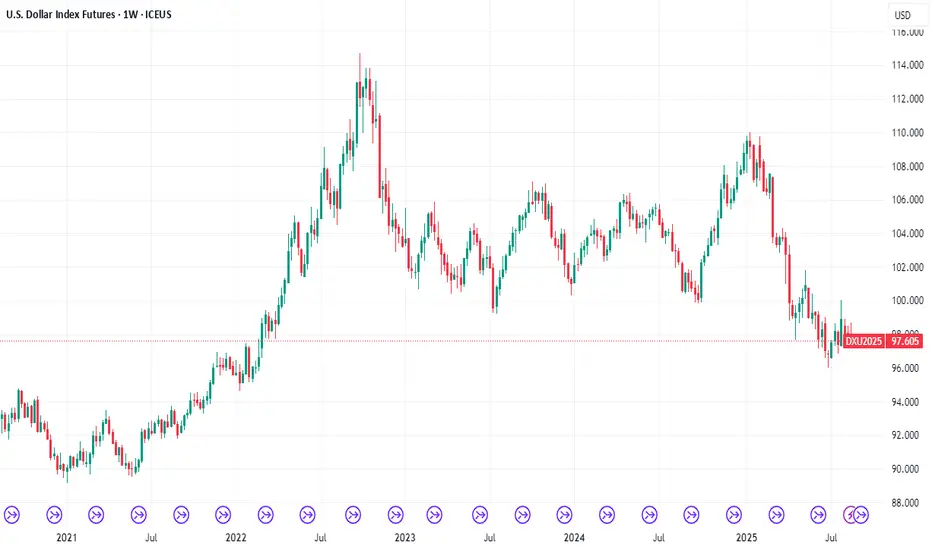
DXY Possible sell on pullback!Back to back 3 weekly pin bar on DXY with series of lower high's putting pressure on the weekly support level. From the Monthly, it is a long term bear market, after the previous monthly pullback, price started to continue to drop which signals potential new impulse on the monthly. As the monthly close, the price is on the intraday support with potential for initial bounce. As weekly market is creating series of higher low, there is a possibility of 50% pullback and liquidity grab to potentially break the weekly support.

Dollar Index: Déjà Vu at the BottomTVC:DXY is testing the bottom of its channel once again. Historically, every touch at these levels has been followed by a rally in the dollar.
If the pattern holds, a rebound here could have meaningful implications for equities, commodities, and crypto.

DXY WILL GO UP|LONG|
✅DXY fell again to retest
The support of 97.600
But it is a strong key level
So I think that there is a high chance
That we will see a bullish
Rebound and a move up
LONG🚀
✅Like and subscribe to never miss a new idea!✅

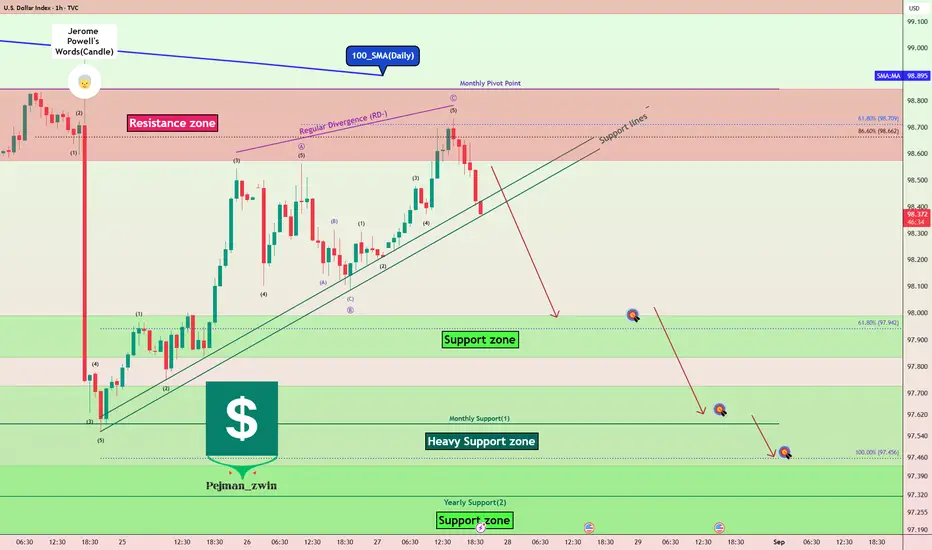
DXY Analysis: Resistances Holding Strong, Is the Downtrend Back?Today, I want to analyze one of the important indices of the financial markets , the U.S. Dollar Index ( TVC:DXY ), for you, which can be a guide for taking short-long positions in the Forex , Futures , and even Crypto markets.
The DXY index fell by about -1.2% after Jerome Powell began talking about the possibility of a rate cut in September , but as the new week began, the DXY index started to rise again.
If we look at the DXY Index chart on the 1-hour time frame , we can see that the DXY Index reacted well to the Resistances and started to decline.
The Resistances for the DXY Index include:
Resistance zone($98.843-$98.575)
Monthly Pivot Point
100_SMA(Daily)
In terms of Elliott Wave theory , it seems that this increase in the DXY Index over the last two days has been in the form of corrective waves . The structure of the corrective waves is Zigzag Correction(ABC/5-3-5). By breaking the Support lines , we can confirm the end of the corrective waves .
Also, we can see the Regular Divergence(RD-) between Consecutive Peaks .
I expect the DXY Index to decline to at least the Support zone($97.989-$97.834) AFTER breaking the Support lines .
Second Target: $97.650
Third Target: $97.450
Stop Loss(SL): $99.000
Note: With the DXY Index declining, we can expect more hope for a weakening of the U.S Dollar's strength in the major Forex pairs .
Please respect each other's ideas and express them politely if you agree or disagree.
U.S. Dollar Index Analyze (DXYUSD), 1-hour time frame.
Be sure to follow the updated ideas.
Do not forget to put a Stop loss for your positions (For every position you want to open).
Please follow your strategy and updates; this is just my Idea, and I will gladly see your ideas in this post.
Please do not forget the ✅' like '✅ button 🙏😊 & Share it with your friends; thanks, and Trade safe.
$DXY: Dollar Strength or Dollar Dip?(1/9)
Good afternoon, everyone! 🌞 DXY: Dollar Strength or Dollar Dip?
With the DXY at 103.732, is the dollar flexing its muscles or ready to stumble? Let’s break it down! 🔍
(2/9) – PRICE PERFORMANCE 📊
• Current Price: 103.732 as of Mar 14, 2025 💰
• Recent Move: Near recent levels, down from 110.18 peak (web data) 📏
• Sector Trend: Forex markets volatile, with trade and policy shifts 🌟
It’s a wild ride—dollar’s dancing on the edge! ⚙️
(3/9) – MARKET POSITION 📈
• Role: Measures USD vs. euro, yen, pound, and more 🏆
• Influence: Drives forex and commodity prices globally ⏰
• Trend: Balancing U.S. policy and global demand, per data 🎯
King of currencies, but not without challengers! 🚀
(4/9) – KEY DEVELOPMENTS 🔑
• Trade Tensions: U.S.-China tariff talks ongoing, per data 🌍
• Rate Cut Bets: Markets eyeing Fed moves, per posts on X 📋
• Market Reaction: Holding steady at 103.732 amid mixed signals 💡
Navigating a storm of global pressures! 🛳️
(5/9) – RISKS IN FOCUS ⚡
• Rate Cuts: Could weaken dollar if Fed acts, per X sentiment 🔍
• Trade Wars: Tariffs disrupting supply chains, per data 📉
• Global Growth: Slowdowns hitting demand for USD ❄️
It’s a tightrope—risks aplenty! 🛑
(6/9) – SWOT: STRENGTHS 💪
• Reserve Status: USD’s global dominance holds firm 🥇
• U.S. Economy: Still a powerhouse, supporting dollar value 📊
• Safe Haven: Attracts flows in uncertain times, per trends 🔧
Got muscle to flex when it counts! 🏦
(7/9) – SWOT: WEAKNESSES & OPPORTUNITIES ⚖️
• Weaknesses: Vulnerable to rate cuts, trade spats 📉
• Opportunities: Strong U.S. data could lift it higher, per outlook 📈
Can it hold the line or break out? 🤔
(8/9) – POLL TIME! 📢
DXY at 103.732—your take? 🗳️
• Bullish: 105+ soon, dollar rallies 🐂
• Neutral: Steady, risks balance out ⚖️
• Bearish: 100 looms, dollar dips 🐻
Chime in below! 👇
(9/9) – FINAL TAKEAWAY 🎯
The DXY’s 103.732 shows it’s steady but tested 📈. Trade wars and Fed moves could swing it either way—dips are our DCA gold 💰. Buy low, ride high—time’s the key! Gem or bust?

The Dollar's Descent: Understanding Historic WeaknessThe U.S. dollar, long considered the world's premier reserve currency and a symbol of American economic might, finds itself in unprecedented territory as it continues to hover near all-time lows against a basket of major currencies. This sustained weakness represents more than just a numerical decline on foreign exchange charts; it signals a fundamental shift in global economic dynamics, monetary policy effectiveness, and international confidence in American fiscal management. The implications of this historic depreciation extend far beyond currency traders and central banks, touching everything from household purchasing power to geopolitical relationships and the future architecture of the global financial system.
The current situation represents a culmination of multiple converging factors that have been building over several years. The dollar's decline hasn't occurred in isolation but rather as part of a complex interplay between domestic fiscal policies, international trade dynamics, shifting reserve currency preferences, and evolving global economic power structures. Understanding this phenomenon requires examining not just the immediate catalysts but also the deeper structural changes that have eroded the dollar's traditional sources of strength.
The Anatomy of the Dollar's Decline
The measurement of the dollar's value against other currencies typically relies on the U.S. Dollar Index (DXY), which tracks the greenback against a weighted basket of six major currencies: the euro, Japanese yen, British pound, Canadian dollar, Swedish krona, and Swiss franc. When analysts refer to the dollar approaching all-time lows, they're observing a sustained depreciation that has pushed this index to levels not seen in decades, with some bilateral exchange rates reaching historic extremes.
The technical aspects of this decline reveal a currency under persistent selling pressure. Foreign exchange markets, which trade over six trillion dollars daily, have witnessed consistent dollar weakness across multiple timeframes and against virtually all major and emerging market currencies. This broad-based depreciation suggests that the issue isn't merely tactical positioning by traders but reflects fundamental concerns about the dollar's intrinsic value and future trajectory.
Several immediate factors have contributed to this weakness. The Federal Reserve's monetary policy stance, particularly its approach to interest rates and quantitative easing, has played a crucial role. While other central banks have moved more aggressively to combat inflation or support their currencies, the Fed's policies have often prioritized domestic economic stability over currency strength. This divergence in monetary policy has created interest rate differentials that make holding dollars less attractive relative to other currencies offering higher yields.
The massive fiscal stimulus measures implemented in recent years have also weighed heavily on the dollar. The expansion of the federal deficit and the dramatic increase in the national debt have raised questions about the long-term sustainability of American fiscal policy. International investors, who must consider currency risk when purchasing U.S. assets, have grown increasingly concerned about the potential for future dollar depreciation as a means of reducing the real burden of this debt.
Trade dynamics have further complicated the dollar's position. The persistent U.S. trade deficit means that more dollars flow out of the country to purchase foreign goods than flow in from exports. This structural imbalance creates constant selling pressure on the dollar as these funds are converted into other currencies. Additionally, the weaponization of the dollar through sanctions and financial restrictions has prompted some nations to seek alternatives for international trade settlement, reducing demand for dollars in global commerce.
Historical Context and Precedents
To fully appreciate the significance of the dollar's current weakness, it's essential to examine historical precedents and the evolution of the dollar's role in the global economy. The Bretton Woods system, established in 1944, positioned the dollar as the world's primary reserve currency, backed by gold and serving as the anchor for international monetary stability. When this system collapsed in 1971, the dollar transitioned to a fiat currency, deriving its value from the strength of the U.S. economy and the confidence of global markets rather than gold reserves.
Throughout its modern history, the dollar has experienced several significant periods of weakness. The stagflation of the 1970s saw the dollar lose considerable value as inflation soared and economic growth stagnated. The Plaza Accord of 1985 deliberately weakened the dollar to address trade imbalances, demonstrating that currency depreciation could be a policy tool rather than merely a market outcome. The financial crisis of 2008 triggered another period of dollar weakness as the Federal Reserve implemented unprecedented monetary easing.
However, the current situation differs from these historical episodes in several important ways. Previous periods of dollar weakness often occurred within a framework where the dollar's fundamental role as the global reserve currency remained unchallenged. Today, that supremacy faces genuine competition from alternative currencies and payment systems. The rise of the euro, the internationalization of the Chinese yuan, and the emergence of digital currencies all represent potential challenges to dollar hegemony that didn't exist during previous cycles of weakness.
The geopolitical context has also shifted dramatically. During past periods of dollar weakness, the United States maintained relatively stable relationships with its major trading partners and allies. Current tensions, trade disputes, and the fragmentation of the global economy into competing blocs have created an environment where dollar alternatives are not just economically viable but politically desirable for some nations. This represents a structural change that could make the current period of weakness more persistent and potentially irreversible in some respects.
Global Economic Implications
The ramifications of the dollar's sustained weakness extend throughout the global economy, creating both opportunities and challenges for different stakeholders. For American consumers, a weaker dollar translates directly into reduced purchasing power for imported goods. Everything from electronics to clothing to automobiles becomes more expensive as the dollar's depreciation increases the cost of foreign-produced items. This imported inflation adds to domestic price pressures, potentially eroding living standards and complicating monetary policy decisions.
American businesses face a mixed picture. Exporters benefit from a competitive advantage as their goods become relatively cheaper in foreign markets, potentially boosting sales and market share. Multinational corporations with significant overseas earnings see those profits translate into more dollars when repatriated, improving their financial results. However, companies reliant on imported inputs face higher costs, and those with international supply chains must navigate increased complexity and currency risk.
The impact on financial markets has been profound and multifaceted. Equity markets have shown remarkable resilience, with some sectors benefiting from the currency tailwind to earnings. However, bond markets face challenges as foreign investors demand higher yields to compensate for currency risk, potentially increasing borrowing costs for the U.S. government and corporate issuers. Commodity markets, traditionally priced in dollars, have seen significant price increases as the weakening currency makes raw materials more expensive in dollar terms.
For emerging markets, the dollar's weakness presents both opportunities and risks. Countries with dollar-denominated debt benefit from the reduced real burden of their obligations, providing fiscal relief and potentially enabling increased domestic investment. However, those nations that have traditionally relied on dollar stability for their own monetary frameworks face uncertainty and potential instability. The shift away from dollar dependence requires careful management and potentially painful adjustments to monetary and fiscal policies.
Developed economies have responded to the dollar's weakness in various ways. The European Union has seen the euro strengthen significantly, creating challenges for European exporters but providing relief from imported inflation. Japan faces particular difficulties as yen strength threatens its export-dependent economy, prompting potential intervention in currency markets. These dynamics have strained international cooperation and raised the specter of competitive devaluations reminiscent of the 1930s.
The Reserve Currency Question
Perhaps the most significant long-term implication of the dollar's sustained weakness concerns its status as the world's primary reserve currency. This privileged position has provided the United States with what former French Finance Minister Valéry Giscard d'Estaing called an "exorbitant privilege" – the ability to borrow in its own currency, maintain persistent trade deficits, and exercise significant influence over global financial conditions.
The erosion of confidence in the dollar threatens this special status. Central banks worldwide have been gradually diversifying their reserves away from dollars, increasing holdings of gold, euros, yuan, and other assets. While the dollar still accounts for the majority of global reserves, its share has been declining steadily. This trend, if it continues, could fundamentally alter the global financial architecture and reduce American influence over international economic affairs.
The search for alternatives has accelerated in recent years. The Chinese yuan's inclusion in the International Monetary Fund's Special Drawing Rights basket marked a significant milestone in its internationalization. Digital currencies, both central bank digital currencies and cryptocurrencies, offer potential alternatives for international trade settlement and value storage. Regional payment systems and bilateral currency swap agreements have proliferated, creating pathways for trade that bypass the dollar entirely.
However, the transition away from dollar dominance faces significant obstacles. The depth and liquidity of U.S. financial markets remain unmatched, providing essential infrastructure for global finance. The rule of law, property rights protection, and regulatory framework in the United States continue to attract international investment despite currency concerns. No single alternative currency currently possesses all the attributes necessary to fully replace the dollar's multifaceted role in the global economy.
Policy Responses and Future Scenarios
Policymakers face difficult choices in responding to the dollar's weakness. Traditional approaches to currency support, such as raising interest rates or intervening in foreign exchange markets, carry significant economic costs and may prove ineffective against structural pressures. The Federal Reserve must balance its domestic mandate for price stability and full employment with the international implications of its policies, a task made more complex by the dollar's global role.
Fiscal policy presents another set of challenges and opportunities. Addressing the structural factors undermining dollar confidence would require difficult decisions about spending, taxation, and debt management. Political polarization and competing economic priorities make comprehensive fiscal reform challenging, yet the consequences of inaction could be severe. The possibility of a dollar crisis, while still remote, has moved from the realm of theoretical speculation to a risk requiring serious contingency planning.
International cooperation could play a crucial role in managing the transition to a new monetary order. Multilateral agreements on exchange rate management, similar to but more flexible than the Bretton Woods system, might provide stability during a period of adjustment. However, the current geopolitical climate makes such cooperation difficult to achieve. The fragmentation of the global economy into competing blocs may accelerate the development of alternative currency systems, further undermining the dollar's position.
Looking ahead, several scenarios could unfold. A gradual, managed decline in the dollar's dominance might allow for smooth adjustment to a multipolar currency system, with several major currencies sharing reserve status. This outcome would require careful coordination and policy discipline from major economies. Alternatively, a more chaotic transition could occur if confidence in the dollar erodes rapidly, potentially triggering financial instability and economic disruption.
The technological revolution in finance adds another dimension of uncertainty. Central bank digital currencies could reshape international monetary relations in ways that are difficult to predict. The adoption of blockchain technology and smart contracts might enable new forms of international trade settlement that don't require traditional reserve currencies. These innovations could either accelerate the dollar's decline or, if led by the United States, potentially reinforce its position through digital dominance.
Conclusion: Navigating Uncharted Waters
The dollar's hover near all-time lows represents more than a cyclical fluctuation in currency markets; it signals a potential inflection point in the global economic order. The convergence of fiscal pressures, monetary policy challenges, geopolitical tensions, and technological disruption has created conditions unlike any previously experienced in the modern era of fiat currencies. The implications extend beyond exchange rates to encompass fundamental questions about economic governance, international cooperation, and the distribution of global economic power.
For investors, businesses, and policymakers, navigating this environment requires careful consideration of both immediate risks and long-term structural changes. Hedging strategies, diversification approaches, and policy frameworks developed during periods of dollar strength may prove inadequate in a world where the greenback's supremacy can no longer be assumed. The ability to adapt to multiple possible futures, rather than betting on a single outcome, becomes essential for managing risk and capturing opportunities.
The social and political implications of the dollar's decline deserve equal attention to the economic aspects. Currency strength has long been intertwined with national prestige and political power. A sustained period of dollar weakness could reshape domestic politics, alter international alliances, and influence the trajectory of globalization itself. The psychological impact of losing reserve currency status, should it occur, would reverberate through American society in ways that extend far beyond financial markets.
As the world watches the dollar's trajectory with a mixture of concern and opportunism, the need for thoughtful analysis and measured response becomes paramount. The current situation demands neither panic nor complacency but rather a clear-eyed assessment of changing realities and proactive adaptation to new circumstances. The dollar's decline may mark the end of one era and the beginning of another, but the nature of that new era remains to be written by the collective actions of governments, markets, and societies worldwide.
The path forward will likely be characterized by increased volatility, structural adjustments, and the gradual emergence of new monetary arrangements. Whether this transition enhances global economic stability or triggers periodic crises will depend largely on the wisdom and cooperation of global leaders. The dollar's current weakness serves as both a warning and an opportunity – a signal that the old order is passing and a chance to build something better in its place. The challenge lies in managing this transition while maintaining the stability and prosperity that the dollar-based system, despite its flaws, has helped facilitate for decades.
In this context, the dollar's hover near all-time lows should be understood not as an isolated phenomenon but as part of a broader transformation of the global economy. The outcomes of this transformation remain uncertain, but its importance cannot be overstated. The decisions made in response to the dollar's weakness will shape international economic relations for generations to come, making this one of the most consequential periods in modern monetary history.
Gold Futures | Watching Pullback into New H4 FVG for ContinuatioPrice pushed bullish after filling ~50% of the prior H4 Fair Value Gap and has now created a new H4 FVG just below. We also closed the day above yesterday’s high (3,394.1), showing strength.
📌 My Bias:
I’m looking for a pullback into the new H4 FVG (around 3,377–3,382) for potential continuation higher. This zone also lines up with the edge of value on the volume profile.
📌 Key Levels:
Daily High (D-H): 3,394.1
Weekly Low (W-L): 3,375.9
Daily Low (D-L): 3,353.3
📌 What I’m Watching:
✅ Acceptance above D-H = bullish continuation.
⚠️ Rejection back below D-H could signal a trap and return into prior value.
Will look for lower timeframe confirmation at the H4 FVG edge before considering longs.
Question for the community:
Do you see continuation higher from here, or are we at risk of a failed breakout?

Gold Futures | H4 FVG Test as Asian Session OpensGold Futures completely filled the Daily FVG, so I’ve removed it and adjusted the chart to focus on the H4 FVG zone.
Price is now pressing deeper inside this imbalance, with 3350 as the key level to watch:
Hold above → potential accumulation and rotation higher.
Break below → sweep into 3348 liquidity and possibly lower.
Asian session may provide the first reaction, but I’ll be watching closely for London to confirm whether we hold or break this zone.

Gold Futures | Accumulation in Play – Watching for Manipulation Gold Futures are currently sitting in the Accumulation phase of an AMD sequence. Price is ranging just above the Daily/H4 FVG demand zone (3350–3360) after rejecting supply at 3387–3394.
Here’s what I’m watching:
Accumulation: Current consolidation between 3368–3387.
Manipulation: A clean sweep of yesterday’s low (3368) would complete this phase.
Distribution: If manipulation plays out, I’ll look for price to rotate higher, targeting 3387 → 3404 and potentially higher levels.
⚖️ Bias: Waiting for liquidity run before positioning long.
No need to rush — the sweep is the confirmation. Until then, patient observation.
