DXY Daily Outlook: Bearish Pressure BuildsLooking at the DXY (US Dollar Index) chart as of September 30, 2025, the long-term structure is clearly in a descending wedge pattern, showing sustained weakness since the sharp rejection from the 100.23 level earlier this year. Price action has been consistently making lower highs and lower lows, respecting the upper and lower trendline resistance and support. Currently, DXY is trading around 97.80, slightly above the mid-support zone, but momentum suggests that bears remain in control.
The chart also highlights multiple Change of Character (ChoCH) and Break of Structure (BOS) points, showing failed attempts by bulls to reverse the trend. Each rally has been capped below descending resistance, most recently around the 98–99 zone, which is now acting as a supply area. The ongoing compression in price suggests a possible breakout direction soon.
From a Fibonacci perspective, the major retracement levels drawn from the swing high (100.23) to the swing low (96.18) give clear downside targets. If the wedge breaks bearish, first support lies near 96.18, followed by Fib -0.382 (94.63), then deeper at -0.618 (93.67). A strong bearish continuation could extend toward the -1.618 projection (89.62), which aligns with long-term demand.
On the other side, if bulls manage to reclaim 98.50–99.00 with strong volume, it could trigger a corrective leg toward 100.23 (previous high and wedge resistance). However, given repeated rejections, this remains the less likely scenario unless macro fundamentals (such as Fed policy or global risk sentiment) strongly shift in favor of the dollar.
The RSI/Momentum structure would likely be neutral-to-bearish given the flat but declining structure. The price remains below the major moving averages (200-day SMA/EMA), adding weight to the bearish bias.
Momentum / indicators
Momentum on the daily appears neutral-to-bearish (rallies are weaker and get rejected).
RSI on daily (if checked) is likely flat-to-slightly below neutral, not showing strong bullish divergence — therefore rallies are corrective.
Price is trading under the major moving averages on the daily (200MA acts as dynamic resistance), reinforcing the bearish bias unless reclaimed decisively.
Key daily levels
Immediate resistance / supply: 98.00 – 99.00 (daily rejection zone).
Invalidation for bearish view (daily close basis): daily close above 100.23 / decisive break and hold above 100.5–101 would flip bias.
Near-term support: 96.18 (first target / pivot).
Secondary targets if 96.18 breaks: 94.63, 93.67 then 89.62 as extended target on a strong bearish continuation.
Price-action scenarios
Bearish continuation (favored): Price respects the upper descending trendline, forms a daily rejection or bearish engulfing at ~98.0–99.0 → short with first target at 96.18, partial take at 94.63 if momentum continues.
Neutral / consolidation: Price oscillates 97–98.5, chopping in wedge — wait for a daily close below 96.60 or above 99.50 before taking directional trade.
Bullish breakout (less likely): Daily close above 100.23 with follow-through and volume would signal trend change toward 102+ — invalidate shorts and look for long setups only after retest.
In Summary
Trend: Bearish within a descending wedge.
Resistance: 98.50 → 99.00 → 100.23.
Support: 96.18 → 94.63 → 93.67 → 89.62.
Long-term bias: As long as 99–100 zone is not broken decisively, DXY is likely to head lower toward 94–90 levels in coming months.
Risk factor: Only a macro-driven breakout above 100.23 would invalidate the bearish outlook and shift momentum toward 102+.
One-line Conclusion
Daily bias = bearish while price stays under the 98–100 supply zone; preferred approach is to short on daily rejections or after a break+retest of 96.18, with extended targets at 94.6 → 93.7 → 89.6, and clear invalidation only on a daily close above ~100.23.
Note
Please risk management in trading is a Key so use your money accordingly. If you like the idea then please like and boost. Thank you and Good Luck!
Dollarshort

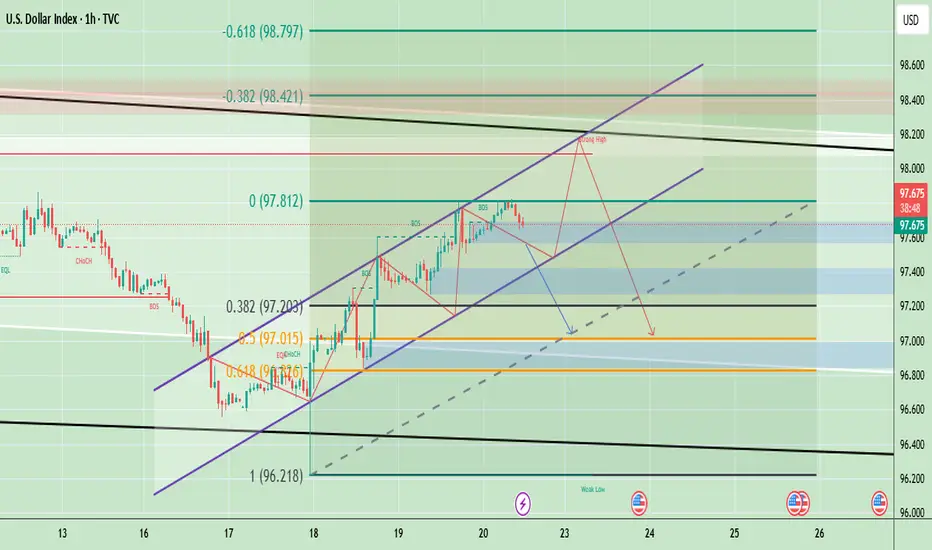
Dollar Index Resistance & Support AnalysisDXY (U.S. Dollar Index) is trading around 97.71, holding within an upward channel after bouncing from the 97.00–97.10 support zone. The structure shows a series of higher highs and higher lows, indicating short-term bullish momentum. However, the chart also highlights a potential “strong high” area near 98.20–98.40, where resistance from both Fibonacci retracement levels and channel tops converge. If DXY fails to break above this resistance, a retracement toward 97.20–97.00 is likely, with further downside risk toward 96.80 if that support breaks.
Based on the current setup, short-term upside toward 98.20–98.40 is possible, but overall bias suggests a likely pullback (downside) after testing resistance, especially if momentum weakens near the channel top.
🔴 Sell Zone (Short Setup)
- Sell Zone (Resistance area): 98.20 – 98.40
- Sell Trigger: If price tests and rejects this zone with bearish candles (reversal signals).
🟢 Buy Zone (Long Setup)
- Buy Zone (Support area): 97.20 – 97.30
- Buy Trigger: If price holds above this zone and shows bullish reversal candles (hammer, engulfing, etc.).
Note
Please risk management in trading is a Key so use your money accordingly. If you like the idea then please like and boost. Thank you and Good Luck!
USD Index Technical Outlook – Key Buy & Sell LevelsThe U.S. Dollar Index (DXY) is currently trading inside a clear downward channel, showing a bearish market structure. Price is hovering near 98.23, just below the key resistance zone between 98.5 – 99.2, where Fibonacci retracement levels (0.382, 0.5, and 0.618) also align, making it a strong supply area. As long as price remains below this zone, the bias stays bearish, with potential downside targets at 97.5 and then 96.5, in line with the channel support and Fibonacci extensions. However, if buyers manage to push above 99.2, it would signal a possible trend reversal and shift the outlook towards bullish continuation. Overall, the structure suggests that the U.S. Dollar Index is more likely to face rejection near resistance and continue lower in the short term.
🔴 Sell Zone (Short Setup)
- 98.50 – 99.20 is a strong resistance area where price aligns with the Fibonacci retracement (0.382 – 0.618) and the upper channel trendline.
- Sell Trigger: If price shows rejection (bearish candles, wicks, or reversal patterns) within this zone.
🟢 Buy Zone (Long Setup)
- 97.50 – 96.50 area is the channel support and also near Fibonacci extension levels.
- Buy Trigger: Look for bullish confirmation (bounce, bullish engulfing, or rejection wicks).
Note
Please risk management in trading is a Key so use your money accordingly. If you like the idea then please like and boost. Thank you and Good Luck!

EURUSD CRACK!I first turned bullish on the EUR back in November 2024 after the disastrous election results.
I have always felt the 105 area was a good area to go long, fundamentally going back all the way to 2017. Here is an example.
After 17 years of data, we can all agree that the 105 area was a great value to get long the EUR. Now we see a major CRACK! in the chart with the fundamentals to back it up.
Again, I remind you I am a MACRO Trader. So my trades hold for a long, long time unless the facts change. I don't do 3 pips and i am out crap!
Let this be a WARNING! To the dollar bulls!
Click Boost, follow, subscribe! Let's get to 5,000 followers so I can help them navigate these crazy markets, too. ))

DXY weekly outlookWeekly analysis for DXY: the broader bias remains bullish. I expect price to respect the stacked 3‑hour demand zones, with the lower zone likely providing the stronger reaction.
After that bounce, a short‑term bearish pullback could unfold from the 4‑hour supply zone. Although I don’t trade the dollar directly, I track DXY for its correlations with other pairs to add confluence and strengthen my setups.

Weakness Followed By Certainty.Dollar may dip below $100 soon, $92 to be exact, where price could bottom off its 200MA, then price will rally above the 2022 Highs, retesting the 2001/CP at $121 by 2026/Q3.
Must never doubt the mighty dollar, even during its pullbacks.

USDJPY SHORT: ISM SERVICES PMI ON TAPUS January ISM services 52.8 vs 54.3 expected. This indicates a slowdown in the service sector in the USA. Due to this news, we expected the Dollar to become weaker against the Yen.

Time for the Dollar to be realisticWith the news of Donald Trump being the united states new president we have seen nothing but euphoric bullish price action of the dollar. However, I believe that it is finally time for that to come to an end and for the dollar to continue in it's gradual and slow demise.
I believe the dollar push to the upside was nothing but a retracement on the HTF and with the bitcoin becoming more of a powerhouse we will continue to see the dollar lose its value.
This is supported through my analysis as we can see the dollar reacting from the weekly imbalance and creating LL and LH and Breaking structure to the downside. I believe that this will continue this week and be looking to sell after price takes the ASH and forms Wyckoff in my 3H supply.
My only hesitation is that my other pairs that go against the dollar I am also predicting to sell, Although we haven't seen the usual correlation between the pairs they normally have i am still cautious but my analysis remains ever true. If the dollar decides to push further up it will simply be filling the remainder of the Imbalance in order to have a proper reaction from the weekly supply.

DXY Shorts from the daily supply at 104.200 back down.The dollar has broken significant structure to the downside, leaving a clean, unmitigated daily supply zone with an imbalance that adds validity to this point of interest. Once price reaches this level, I'll likely refine the zone and wait for a CHOCH on the lower timeframe.
If price moves down first, I’ll watch for it to enter the newly created 3-hour demand zone, which swept previous higher-timeframe structure. This could propel the dollar up to the supply zone.
Confluences for DXY Shorts:
Strong bearish momentum on the higher timeframe, breaking previous structure.
Significant liquidity to the downside.
A solid daily supply zone caused this move, with an imbalance below.
This pro-trend trade aligns with my other pairs.
P.S. I expect Monday to start slow, with consolidation before either zone is mitigated. We'll make our move from there.

DXY (Dollar Index) Shorts from 103.400 back down!As the dollar has been consolidating in the past week, opportunities near the current price are limited. However, my nearest Point of Interest (POI) is a supply zone on the 14-hour chart. I am looking to capitalize on this by selling to continue the bearish trend observed in the dollar index. I'll be patiently waiting for a breakout from this range, aiming to fill the imbalances above and eventually reach our identified supply zone.
On the flip side, if price breaks below the consolidation, it could tap into a demand zone, sweeping liquidity beneath the range. In this scenario, I anticipate a bullish reaction, possibly a temporary move to the upside before eventually targeting our supply zone.
Confluences for Dollar sells are as follows:
- Overall temporary trend for this pair is bearish so this idea aligns with that bias.
- Bullish pressure is now getting exhausted as you can see from the ranging price action
- Price has left imbalances just below the supply that needs to get filled, validating our POI.
- There is lots of liquidity to the downside that needs to be taken.
- Price is due for a pullback to enter a level of supply if price wants to keep dropping lower.
P.S. If price unfolds in a manner similar to how EURUSD is behaving, I will patiently await a breakout from this area. Subsequently, I will assess its behaviour and adapt my approach based on the information the market presents.
Have a great week ahead traders!

DXY (Dollar) Shorts from 103.300 down to 102.200This Weeks DXY bias is to expect another major move to the downside to continue its bearish trend that it has now set. To capitalise on this movement we will wait for a minor pull back up to a near unmitigated supply, (which will be the 9hr) to look for entries to get into this selling trend.
From this we will look for our usual wyckoff distribution to play out on the lower time frame and a CHOCH inside our POI to the enter our sell positions. I would love to see the asian high get swept as well because it will increase our confluence for a stronger sell bias. Overall I am temporarily bearish for the dollar and I expect price to keep dropping for the rest of this year.
Confluences for DXY (dollar) sells are as follows:
- Price is temprorarily bearish due to the perpetual BOS to the downside.
- There's still trend liquidity left to the downside that hasn't been taken.
- For price to react off next there is a demand zone below on the 4hr region.
- There is a clean supply 9hr that caused an impulsive to the downside.
- By the candle stick anatomy bearish candles are very strong holding lots of momentum.
P.S. I would ideally wait for this structure to break first before seeing the correction back up to the 9hr however, if price goes that low I see it continuing going down to reach our next demand. Which we will then anticipate a potential short term buy back up.
ALSO WE HAVE REACHED 100 FOLLOWERS, SO MANY THANKS! BE SURE TO SHARE THE PAGE TO YOUR FELLOW TRADERS AND HAVE AN AMAZING TRADING WEEK AHEAD!!!

DXY$ Shorts from 105.800 down towards 105.200As expected our last week scenario (A) played out perfectly like we anticipated which was seeing a bullish reaction from the 4hr demand. For this week's bias we are still temporarily bearish with the dollar as it's approaching a clean 14hr supply zone. As soon as it gets tapped in I will be waiting for my lower time frame confirmation i.e. a Wyckoff distribution schematic and a clean CHOCH to the downside.
I would preferably wait for the asian high to get swept inside the zone before looking for a drop in the dollar index. I am bullish long term but, as price has broken structure a few times to the downside I would like to catch sells down towards the next demand at least.
My confluences for DXY$ Shorts are as follows:
- Price approaching a 14hr supply zone that has broken structure the downside.
- Imbalances have fully been filled and momentum has slowed down (good sign for a reversal)
- Huge trend line left way below that price would want to grab and theres also lots of liquidity below to target as take profit levels.
- In order for price to keep pushing up it will need to enter a level of demand, so as of now we will be trying to catch sells down towards a demand.
P.S. Only if my extreme 7hr supply zone gets violated, we will then know if price wants to continue in its bullish trend or not. But as of now I see price dropping more due to the perpetual BOS's. Also, as the dollar is a direct negative correlation to most of my pairs, the bias will suggest a bullish move to take place for EU, GU and gold If DXY$ decides to continue bearish.

EURUSD Long after Fed rates We saw Tuesday taking Monday's low and then Wednesday after Fed rates we saw Tuesday high taken. I am thinking since Sellside Liquidity has been taken we should expect a follow-up into opposite side Buyside liquidity above Monday's high.

Dollar Correction Required!DXY(Dollar Index) created a hidden bearish divergence in the day timeframe! So, I think the dollar will correct to the 102.7 range!

USDCAD on a fall USDCAD since early this morning is on a consistent fall on the 15 minute chart.
AMEX:USD Dollar strength issues have continued with the latest hike in prime interest rates
trying to cool down inflation. Canadian dollar is buoyed by the rising spot price of
gold and oil which are more prominent parts of the Canadian economy than they
are in the USA> The chart shows a ride down the lower Bollinger Bands with no
signs of reversal as of yet. As a leveraged forex trade heading into the market close
I will open a good sized position scalping into 5-10 minutes before the close for the
week,

Still looking to short DollarThe dollar is experiencing fundamental weakness due to its data, with yuan transactions surpassing it for the first time. The GDP was worse than anticipated, causing concerns of an impending recession. Today's core PCE data, a crucial inflation indicator, could potentially alter the trajectory of the dollar, therefore, be cautious.
From a technical standpoint, I am searching for a trend rejection.

DXY short idea- in order to create 4h range we must break this 4h low
- lines up with EU nicely
- daily high is still the target

US Inflation Slows for Ninth Month: What's the Plan, Jay Powell?The US annual inflation rate has slowed down for the ninth month in a row, hitting 5% in March of 2023. While this is the lowest it's been since May of 2021, it's still well above the Fed's target of 2%. Investors are trying to figure out when the central bank will put the brakes on its hiking campaign to slow inflation.
The March FOMC minutes (released this morning) revealed that some Federal Reserve policymakers discussed hitting the pause button on interest rate increases, following the collapse of two regional banks. However, ultimately, all policymakers decided that tackling high inflation was still the top priority. In the end, they went ahead with a rate hike, despite the potential risks
Complicating matters, core CPI (which excludes food and energy components) has gone up to 5.6%, after rising by 5.5% in February. This has led some people to believe that more tightening is in the cards.
Initially, money markets thought that the Fed might not raise interest rates in May, but expectations have since risen to 70.5%. The Dollar index remains at its lowest since February 2nd, steady near 101.5.
As for Canada, things are looking up - the Bank of Canada has left its key overnight interest rate on hold at 4.50% as expected, while curbing language warning of a potential recession. The Canadian dollar has responded positively, inching up to around 1.34 per USD.
Meanwhile, the British pound has risen towards $1.25, nearing a ten-month high of $1.2525 that was touched on April 4. Bank of England Governor Andrew Bailey has stated that he doesn't see any signs of a repeat of the 2007/8 global financial crisis, which is reassuring news for investors. They're betting that the Bank of England will continue to raise interest rates to combat inflation, adding some fuel to the GBP.

DOLLAR OUTLOOK FOR THE NEXT 3 MONTHS I have noticed a bearish rally is approaching on DOLLAR and economic news seem to be the driven force.. i will continue to hold long term.

Dollar Index Chart Analysis....
In this situation DXY Short time chart create Bearish BAT Pattern. So, market
short term Buy UP to 104:930; and 105:100 resistance level. Then market need long
sell correction to nearest Support 103.700 and 103.400 level.
AronnoFX will not accept any liability for loss or damage as a result of
reliance on the information contained within this channel including
data, quotes, charts and buy/sell signals.
If you like this idea, do not forget to support with a like and follow.
Traders, if you like this idea or have your own opinion about it,
write in the comments. I will be glad.

USDJPY - bearish impulseHello everybody! We are currently in a downtrend on USDJPY on a daily and weekly timeframe, and we could expect another aggressive impulse, creating a lower low. The price has just retested the daily support that became resistance, and also the EMA. MACD lines are below 0 and the moving averages are also showing confluence to this bearish scenario. Moreover, the CS Indicator is indicating USD getting weaker, while JPY strengthening. OANDA:USDJPY FX:USDJPY

Off to 133 for a decisive Check of S/RUSDJPY gave us a bit of trouble over 147 and then it became a beautiful trade/opportunity once below that level.
I have explained before how the US has become toxic for it's allies. You can read about it here:
As well as here:
and here:
Unlike non traditional assets, this kind of charts offer us amazing opportunity. Similar to going short on EURUSD right at the very top:
What happens at 133?
Price under that level ends up free falling to 107.7. Then again that same 133 could be a massive rebound...to be seen.
One Love,
The FXPROFESSOR

Double bottom pattern in formation?Is the S&P500 about to double-bottom? We should find out soon! Like today!
