DOT/Polkadot DropDOT is facing a supply zone (the green area), and the neckline (green) on the RSI has been broken. When the blue line breaks and the RSI pulls back to its broken neckline, that's one of the optimal entry points. This is because stop hunting is highly likely in supply and demand zones, I've drawn the probable path of movement. BINANCE:DOTUSDT
Dotshort

#DOT/USDT#DOT
The price is moving within a descending channel on the 1-hour frame, adhering well to it, and is heading for a strong breakout and retest.
We are seeing a bounce from the lower boundary of the descending channel, which is support at 4.40.
We have a downtrend on the RSI indicator that is about to be broken and retested, supporting the upward trend.
We are looking for stability above the 100 Moving Average.
Entry price: 4.43
First target: 4.50
Second target: 4.57
Third target: 4.64

DOTUSD Plunge Alert Precision Short Targeting 10%+ Gains !The asset, DOTUSD, is showing a sharp bearish momentum with a decline indicating strong selling pressure.
The current price is 6.905, while the short entry position aligns with a retracement after a peak profit zone
1. Trend Direction
The price has broken below green channel, signaling a trend reversal from bullish to bearish.
Red zones around the moving averages confirm the presence of downward momentum.
2.Entry Confirmation
The short position appears to be placed after the market failed to hold its highs (Peak Profit 10.14%) and created lower highs, validating the short trade setup.
Entry aligns with the rejection of resistance levels, suggesting a good risk-to-reward setup.
3. Risk Management
Stop-loss is placed slightly above the sell zone, covering the recent swing high. This limits risk in case of price retracement.
The profit target extends well below the entry, suggesting confidence in further downside potential.
4. Aetos Indicators
A potential momentum-based or moving average indicator is being used to highlight peak profit areas, confirming optimal trade execution.
The bearish engulfing candles in the sell region validate the short bias.
Projection
Target Zone: The profit target aligns with the 6.230 support level, indicating expectations of a 10% drop from the entry point.
Downside Risk: If bearish momentum continues, there could be a breakdown below 6.230, extending losses toward 6.000 or lower.
Analysis
DOTUSD is experiencing a sharp bearish reversal after failing to hold its highs. The short entry capitalizes on lower highs and rejection near the resistance. Stop-loss is strategically placed above recent highs, while the target aligns with key support levels. This trade setup is supported by
Bearish momentum.
Clear breakdown below the moving average channel.
High risk-to-reward ratio for short-term traders.
Strategy
Stay short below 6.905, targeting 6.230. If price retraces above 7.00, consider exiting the position. Always book profits partially and move SL to BE

#DOT/USDT#DOT
The price is moving in a descending channel on the 1-hour frame and sticking to it well
We have a bounce from the lower limit of the descending channel and we are now touching this support at 0.400
We have a downtrend on the RSI indicator that is about to be broken, which supports the rise
We have a trend to stabilize above the moving average 100
Entry price 1.10
First target 4.26
Second target 4.40
Third target 4.62

DOT - Opportunity to catch a 20% correctionGreetings everyone!
I would like to share with you the analysis of DOT (Polkadot).
We have successfully exited the descending structure, which indicates a transition to the ascending structure. However, this does not prevent us from looking for short-term corrective trades with good reasons.
We are currently seeing the filling of the monthly imbalance in the 11.14 - 14.18 range. Within this range, there is a weekly imbalance zone extending from 11.81 to 13.03. With a favorable risk-reward ratio, we may consider setups coming out of this zone.
Our goal may be to eliminate inefficient pricing on the two-hour timeframe (FVG).

#DOT Can Reach 14.7 if..;DOT almost broke the weekly resistance area when it got pumped last time but couldn't manage it sadly.
If DOT can close above 10,7 in daily time frame, I'll take a long entry with 5X Cross (%5 of my general margin) and set the target point to 14,7.
According to Elliot Waves theory, wave 3 should get me 14,78.
Also;
Daily Volume seems fine and broke the last high.
Rsi still seems like fine.
All targets and areas on the chart.
Good luck to us all.

bearish trend (DOT)📊Analysis by AhmadArz:
🔍Entry: 6.59
🛑Stop Loss: 6.68
🎯Take Profit: 6.45
🔗"Uncover new opportunities in the world of cryptocurrencies with AhmadArz.
💡Join us on TradingView and expand your investment knowledge with our five years of experience in financial markets."
🚀Please boost and💬 comment to share your thoughts with us!

DOT Up Or Down after the Range?After some bounce up, towards to 4.8$ level, where the coin rejected after touching 3 Week FVG or 50 ema on D TF
The coin has very strong "buy zone" between 3.8 - 4.1$ price levels. I also highlighted that zone with blue circle. Where you can see that the coin was consolidating pretty long between those levels.
Currently as most Alt coins, DOT looks pretty bearish.
There are 2 ways of possible price action.
1. The coin comes to the "BUY" zone that I mentioned above, consolidates and bounces back to 4.3$ that will be 1st resistance to break after the drop towards to "Buy Zone"
Only after breaking above 4.3$ we can expect continuation of the price towards to 4.8$ (another resistance zone)
2. The coin comes to "Buy zone" and doesnt manage to bounce back to break above 4.3$
Continues consolidation with downtrend, at the end we see that coin breaks below 3.8$ in this case we can see the coin around 3.2$ or even lower. (green lines that you can see)


DotClose 50% of position in r\r2 and 50% in r\r7.You can close 50% of this with dow. When last pivot breaks.

DOT SHORT 15M Hello everyone, let's take a look at the 15M DOT to USDT chart as you can see the price is moving below the local downtrend line.
Let's start by setting goals for the near future that we can consider:
T1 - $ 8.64
T2 = $ 8.67
T3 = $ 8.70
T4 = $ 8.73
and
T5 = $ 8.76
Now let's move on to the stop loss in case of further market declines:
SL1 = $ 8.57
and
SL2 = $ 8.51
Looking at the CHOP indicator, we can see that there is a lot of energy in the 15M range, while the MACD indicator shows a local downward trend.

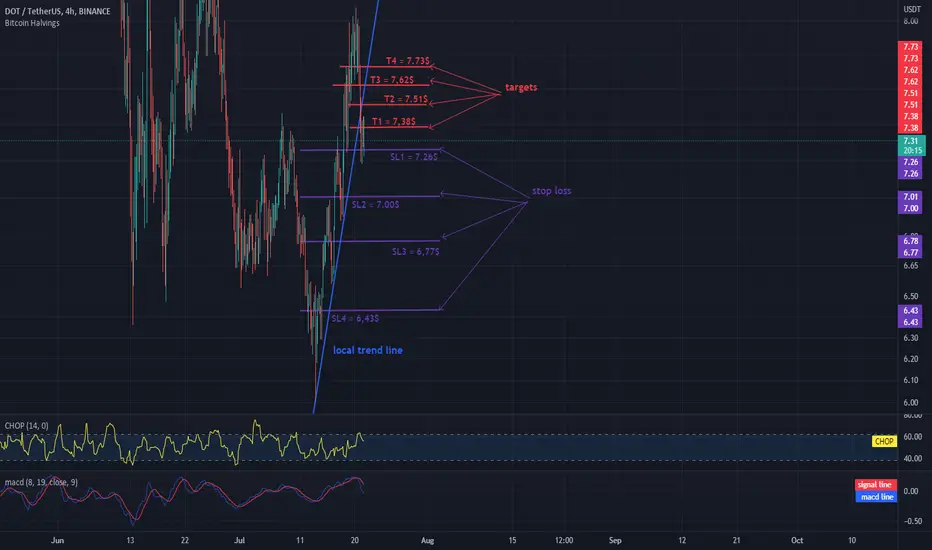
DOT SHORT 4H INTERVALHello everyone, let's take a look at the 4H DOT vs. USDT chart. As you can see, the price has dropped below the local uptrend line.
Let's start by setting goals for the near future that we can consider:
T1 = $ 7.38
T2 = $ 7.51
T3 = $ 7.62
and
T4 = $ 7.73
Now let's move on to the stop loss in case of further market declines:
SL1 = $ 7.26
SL2 = $ 7.00
SL3 = $ 6.77
and
SL4 = $ 6.43
Looking at the CHOP indicator, we can see that in the 4H range we still have a lot of energy, while the MACD indicator shows a local downward trend.
DOT / USDT 4H CHART - fight the resistance!Hello everyone, let's take a look at the 4H DOT to USDT chart as you can see the price broke above the local downtrend channel and started a local uptrend.
Let's start by setting goals for the near future that we can consider:
T1 = $ 7.96
T2 = $ 8.49
T3 = $ 9.10
and
T4 = $ 9.94
Now let's move on to the stop loss in case of further market declines:
SL1 = $ 7.55
SL2 = $ 7.26
SL3 = $ 7.00
SL4 = $ 6.77
and
SL5 = $ 6.43
Looking at the CHOP indicator, we can see that in the 4H range we still have energy to continue the movement and the MACD indicator confirms the local upward trend.

DOT - PolkadotDOT looking prime for a drop to sub $4 short term, when this correction is over! After a little dead cat bounce and continuation to the down side. None of my 4 indicators showing any bullish confirmation on the Weekly Time Frame. Next Bull Run top $1.2K -$2K.
- Weekly MACD (Bearish)
- Weekly Pekipek's Divergence BETA (Bearish)
- Weekly RSI (Bearish)
- Weekly Stochastic RSI (Bearish)

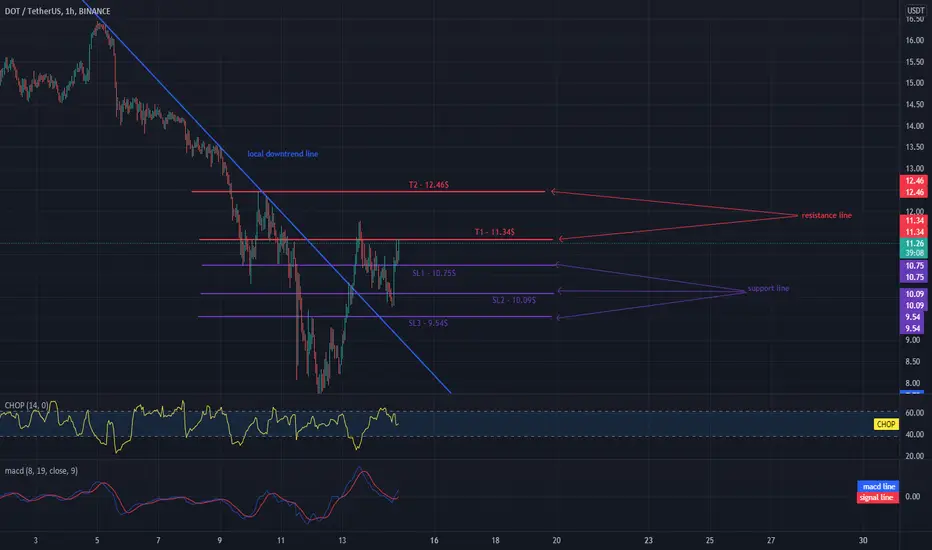
Will DOT handle the first target?Hello everyone, let's take a look at the DOT to USDT chart over the 1 hour timeframe. As you can see, the price broke above the local downtrend line.
It is worth starting with determining the stop loss that we should take into account in the coming hours. As you can see, we chose 3 stop loss: SL1 - $ 10.75, SL2 - $ 10.09, SL3 - $ 9.54.
Now let's move on to determining the targets that the price has in front of it and as you can see, the first one is at T1 - $ 11.34 with which the price is currently fighting, the next one is at T2 - $ 12.46.
Looking at the CHOP indicator we can see that in the 1 hour interval some energy has been used up, but we have a little bit to continue the movement. On the other hand, the MACD indicator shows an upward trend.
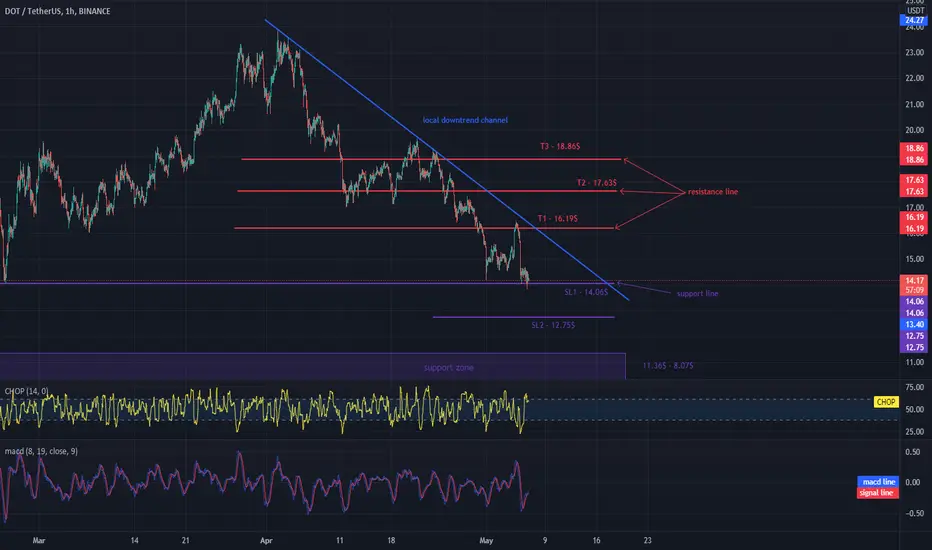
DOT on support, three price targets possibleHello everyone, let's take a look at the 1H DOT to USDT chart. As you can see, the price is moving below the local downtrend line.
Let's start with marking the support line and as you can see the first support in the near future is $ 14.06, here it is worth setting the first stop loss, if the support breaks, the next support is at $ 12.75, here it is worth setting the second stop loss. Next we have a support zone from $ 11.36 to $ 8.07
Now let's move from the resistance line as you can see the first resistance is $ 16.19, if you can break it the next resistance will be $ 17.63 and $ 18.86.
Looking at the CHOP indicator, we can see that in the 1H interval we have a lot of energy for new movement in the coming hours.
The DOT relied on support at $ 20.09Hello everyone, let's take a look at the DOT to USDT chart on the 1D Interval. As you can see, unfortunately the price has dropped a bit below the local uptrend.
Let's start with the designation of the support line and as you can see the first support in the near future is $ 20.09 on which the price is currently based, if the support breaks, the next one is $ 18.95 and $ 17.80.
Now let's move from the resistance line as you can see the first resistance is $ 21.13, if you can break it the next resistance will be $ 23.30 and $ 25.55.
Looking at the CHOP indicator, we can see that in the 1D interval we have a lot of energy to make the next move.

DOT : Short setupShorting some #Polkadot if price loses the Black trendline in the daily timeframe.
Watch out for confirmation in the H4 Chart before shorting

We might see huge down trend soonDOT is making beautiful up channel, that means we might see down trend soon. If DOT cant break above 20 we starting too see short. Closing below 18 is confirmation of short.

Dot moving down to new low levelDot moving down to new low level, chance to bounce is not much with less momentum, if breaks the near support we might see it heading down towards 15$

Dot Game in Simple ChartI'm Seeing Dot Falling Below Yellow Line I don't recommend you to take any long position if you want to take short DYOR

DOT Short position 22 December 2021I'm going to short DOT in this setup. We saw some explosive growth this day and we hit our previous resistance zone. The RSI indicator is indicating a top So I think this is a safe bet with low risk
I will place a SL at 28.3 and TP at around 25.72 and also move my SL lower if the trade goes in profit

DOT USDT SetupThis is my DOT USDT setup, DOT can go to demand area sooner or later, there are bearish divergence on weekly and daily timeframes, and the trendline has been broken, the target price is based on supply & demand and fibonacci, you don't have to open short position, if you want to buy DOT, you should wait until the price arrives to the demand area.
