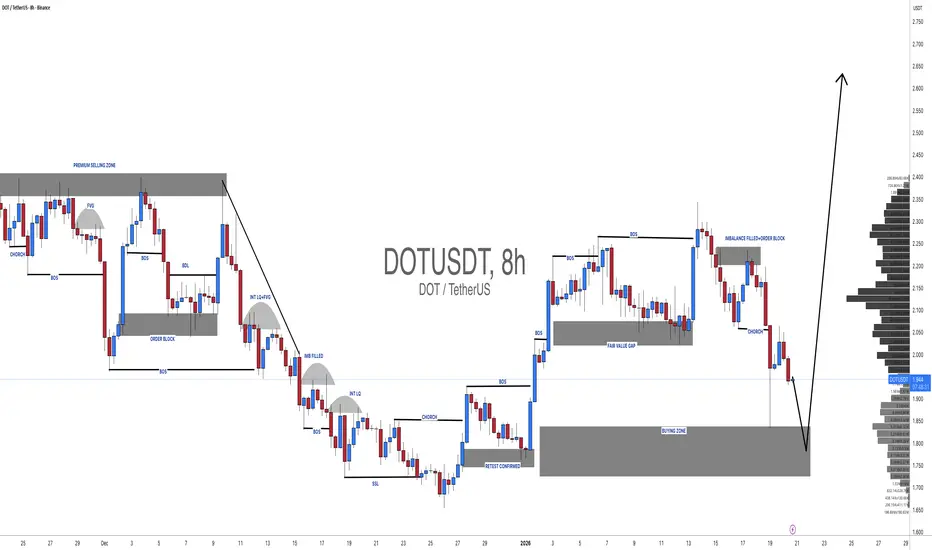
DOTUSDT: One Last Drop And Then Strong Bullish Move To Start?Dear Traders,
DOTUSDT is poised for a strong bullish reversal, potentially reaching all-time highs. Both fundamental and technical analysis support our bullish bias, but we need strong bullish volume to confirm this view. If you enjoy our work, please like and comment for more.
Team Setupsfx_
Dotusdtbinance
#DOTUSDT: Three Targets Swing Buy With Final Target At $12DOTUSDT WEEKLY ANALYSIS BASED ON SMART MONEY CONCEPT🏆📊
🔺Over the last couple of weeks, we’ve noticed a change in how prices are moving and how strong the trend is, which might mean we’re seeing a possible turn for the better from the 2.139 level. Before, when DOTUSDT dropped from its highest point of 11.94, it seemed like the bearish trend was sticking around. But now, we’re hoping to break through that trendline, which could lead to prices going up towards our three set targets.
🔺A good time to jump in would be when the bearish trendline is definitely broken. Since cryptocurrency markets can be so unpredictable, it’s important to be patient. We really recommend using strong risk management techniques, as this kind of asset can be more volatile than regular investments. Also, we’ve found three different price points where you could think about taking profits, and it’s a good idea to match these with what you think and how much risk you’re comfortable with.
🔺We’d love to hear what you think about this analysis and if you have any questions. If you want to learn more, please keep an eye on our updates.
Team SetupsFX_👨💻💥

Can DOT/USDT Sustain Its Bullish Momentum This Week?🎯 DOT/USDT: The Kijun Breakout Heist 💎 | Swing/Day Trade Setup
📊 Market Overview: POLKADOT vs TETHER
The DOT/USDT pair is flashing some serious bullish signals, and this setup is looking too good to ignore! We've got a Kijun moving average breakout brewing alongside a CCI momentum oscillator golden cross — the kind of technical alignment that makes traders smile. 😏
🎯 The "Thief Strategy" Game Plan
Trading Style: Swing/Day Trade Hybrid
Bias: BULLISH 🚀
Confirmation: Kijun MA breakout + CCI golden cross momentum surge
💰 Entry Strategy: The Layered Limit Order Approach
Here's where it gets interesting. Instead of market buying like a rookie, we're using multiple limit orders (the "layering strategy") to scale into this position like professionals:
Suggested Entry Layers:
🎯 Layer 1: $4.150
🎯 Layer 2: $4.200
🎯 Layer 3: $4.250
You can add more layers based on your position size and risk appetite. The beauty of layering? You average into the move instead of gambling on one entry!
🛡️ Risk Management Zone
Stop Loss: $4.050 🚨
⚠️ IMPORTANT DISCLAIMER:
Dear Ladies & Gentlemen (Thief OG's) — this is MY stop loss level based on MY analysis. You are NOT obligated to use this level. Trading is YOUR responsibility, YOUR risk, YOUR reward. Set YOUR own stop loss based on YOUR risk tolerance. Manage your money, take your profits, and protect your capital at your own discretion.
🎯 Profit Target: Know When to Exit the Heist
Target Zone: $4.600 💰
This target aligns with:
Strong historical resistance
Overbought RSI/CCI conditions (potential trap zone)
Natural profit-taking area
🚨 Exit Strategy Reminder:
Dear Ladies & Gentlemen (Thief OG's) — this is MY target based on MY technical analysis. You are NOT required to follow this target. Take profits when YOU feel comfortable. Lock in gains, scale out, or let it ride — it's YOUR choice and YOUR capital. Make money, then take money at your own risk.
🔍 Key Technical Indicators Breakdown
✅ Kijun Moving Average: Bullish breakout confirmed
✅ CCI Momentum Oscillator: Golden cross formation (bullish momentum shift)
✅ Price Action: Higher lows forming, trend structure improving
✅ Volume Profile: Increasing buying pressure on breakout levels
💎 Related Pairs to Watch (Correlation Play)
Keep an eye on these correlated assets for confluence:
CRYPTOCAP:DOT Dominance — Overall Polkadot ecosystem strength
$KSM/USDT (Kusama) — Polkadot's canary network, often moves in tandem
$ATOM/USDT (Cosmos) — Similar interoperability narrative
$AVAX/USDT (Avalanche) — Competes in similar L1 smart contract space
$BTC/USDT — King Crypto correlation; DOT typically follows BTC trend direction
$ETH/USDT — Ethereum's strength often lifts altcoins including DOT
Why watch these? If CRYPTOCAP:DOT rallies while CRYPTOCAP:BTC and CRYPTOCAP:ETH consolidate, that's relative strength — a bullish divergence. If ASX:KSM pumps, CRYPTOCAP:DOT often follows. Smart traders watch the whole ecosystem, not just one chart! 👀
🧠 Final Thoughts: Trade Smart, Not Hard
This setup combines:
📈 Momentum confirmation (CCI golden cross)
📊 Trend confirmation (Kijun breakout)
💰 Smart entry execution (layered limits)
🛡️ Defined risk (clear stop loss)
🎯 Clear target (resistance + overbought zone)
The "Thief Strategy" isn't about greed — it's about stealing profits from the market with precision and discipline. Layer in, manage risk, and take profits when the market gives them to you. 💼
📌 Disclaimer
⚠️ This is the "Thief Style" trading strategy — for educational and entertainment purposes only. This analysis is NOT financial advice. Trading crypto carries substantial risk of loss. The "Thief" approach is a fun, stylish way to describe disciplined layered entries, but YOU are responsible for your own trading decisions, risk management, and capital. Trade what you can afford to lose. Do your own research (DYOR).
Not a registered financial advisor. Just a chart enthusiast sharing ideas. 🎨📊
✨ If you find value in my analysis, a 👍 and 🚀 boost is much appreciated — it helps me share more setups with the community!
#DOTUSDT #DOT #Polkadot #CryptoTrading #SwingTrading #DayTrading #TechnicalAnalysis #CCIOscillator #KijunBreakout #CryptoSignals #AltcoinSetup #LayeredEntry #RiskManagement #ThiefStrategy #BullishSetup #MomentumTrading

DOT/USDT Profit Heist | Don’t Let Bears Catch You🚨Polkadot Crypto Vault Break-In Plan | DOT/USDT Robbery Blueprint🚨
🌍 Hola Heist Crew! 💰📡
Ready for another vault-cracking strategy? Here's your DOT/USDT Crypto Heist Plan based on pure Thief Trading Style™—a fusion of smart-money tactics, technical traps, and stealth execution. 🎯💸
🔓 🎯 Entry Zone – Lockpick Ready
"The vault’s wide open! Swipe the bullish loot anywhere, anytime—but smart thieves plan pullback entries."
📌 Recommended: Use 15–30 min timeframe for sniper buys near swing highs/lows.
💡 Pro Move: DCA with layered buy limits like a seasoned thief stacking getaway routes. 🧠💵
🚔 Stop Loss – Evade the Patrol
📍 Secure SL just below the nearest 4H candle wick low (e.g., 4.000 zone)
🔐 Customize SL to match your risk profile & lot size—escape routes vary by thief rank.
💣 Target – Break the Vault & Vanish
🎯 TP: 5.200
🕶️ Optional: Dip out early if market heat rises near resistance traps. Escape clean.
⚠️ High Alert – Police Checkpoint Ahead
👮 Red MA Zone = Barricade.
It’s a hotspot for bearish cops + consolidation traps.
Only strong thieves survive here—book profits before you get cornered.
💼 For Scalpers & Swing Agents
🔍 Scalpers: Only ride long—quick bags, quick exit.
💰 Swingers: Follow the full robbery plan. Patience pays.
🎯 Trailing SL is your body armor—keep it tight.
📊 Fundamental Force Behind the Break-In
🔥 DOT/USDT is flashing bullish momentum supported by:
Sentiment shift
Intermarket alignment
COT positioning
On-chain data
📡 Stay updated via macro reports & sentiment dashboards—intel is profit.
📰 News Alert – Chaos Creates Opportunity
🧨 Avoid fresh entries during high-volatility news drops.
🎯 Trailing SL can save you during headline crossfire.
❗️Disclaimer:
This blueprint is for educational purposes only. Always conduct your own recon and apply strict risk management. Thieves who don’t scout first... get caught.
🚀 Boost the Heist – Support the Crew
💥 Smash that “Boost” if this plan adds value 💥
Your boost fuels more chart crimes, more profit hits, and a growing rob-the-market brotherhood! 💪💼📈
🧨 See you in the next job... Stay hidden, stay funded!
– Thief Trading Style™ HQ 🕶️🐱👤💰🚁

DOTUSDT: On The Way To $12 By End Of Year ? BINANCE:DOTUSDT The price of BINANCE:DOTUSDT has taken a turn, and it looks like it’s gonna follow the same pattern. Right now, the market is bullish, and we can see the price heading towards our target in the coming weeks.
Good luck with your trades
Thanks for your support! 😊
If you want to help us out, here are a few things you can do:
- Like our ideas
- Comment on our ideas
- Share our ideas
Team Setupsfx_
❤️

DOT/USDTTRADE ALERT!DOT
Ticker: DOT/USDT
Entry: 7.35-7.70
Take Profit:8.50-9.50-11
Stop Loss: 6.8
Risk to reward: 1:2
Technical Thesis: We have 4hr 50 EMA support at 7.60$
Price is also a strong area which has given multiple bounce in past.

DOT/USDT BREAKOUT READY TO PUMP 100%!!Hi guys, This is CryptoMojo, One of the most active trading view authors and fastest-growing communities.
Do consider following me for the latest updates and Long /Short calls on almost every exchange.
I post short mid and long-term trade setups too.
Let’s get to the chart!
I have tried my best to bring the best possible outcome in this chart, Do not consider it as financial advice.
BUY DOT/USDT ON THE SPOT
DOT is making this falling wedge pattern
Entry range:-$6.86 to $7.10
Target:- 100%
SL:- $6.30
This chart is likely to help you in making better trade decisions if it did consider upvoting this chart.
Would also love to know your charts and views in the comment section.
Thank you


DOT/USDT HAS POTENTIAL TO PUMP 300%!Hi guys, This is CryptoMojo, One of the most active trading view authors and fastest-growing communities.
Do consider following me for the latest updates and Long /Short calls on almost every exchange.
I post short mid and long-term trade setups too.
Let’s get to the chart!
I have tried my best to bring the best possible outcome in this chart, Do not consider it as financial advice.
Welcome to this DOT/USDT update. DOT looks very promising here and looks like hovering near the bottom.
DOT is trading inside a symmetrical triangle in the 2-day time frame. Currently, it is moving near the lower trendline of the triangle. So buying here will be very low risk. Buy some now and add more in the dip.
Entry range:- $17.5-$18.5
Target1:- $22
Target2:- $26
Target3:- $32
Target4:- $38
SL:- If any 2-day candle closes below the triangle or closes below $17 then I'll exit.
This chart is likely to help you in making better trade decisions if it did consider upvoting this chart.
Would also love to know your charts and views in the comment section.
Thank you

DOT/USDT HAS POTENTIAL TO PUMP 150%!Hi guys, This is CryptoMojo, One of the most active trading view authors and fastest-growing communities.
Do consider following me for the latest updates and Long /Short calls on almost every exchange.
I post short mid and long-term trade setups too.
Let’s get to the chart!
I have tried my best to bring the best possible outcome in this chart, Do not consider it as an
#DOT/USDT is about to break out of this falling wedge pattern and lying on very strong support.
ENTRY- $17 - $17.60
TARGET- 150%
SL- If it breaks and closes below the 15.60
This chart is likely to help you in making better trade decisions if it did consider upvoting this chart.
Would also love to know your charts and views in the comment section.
Thank you

DOT/USDT 3D UPDATEHi guys, This is CryptoMojo, One of the most active trading view authors and fastest-growing communities.
Do consider following me for the latest updates and Long /Short calls on almost every exchange.
I post short mid and long-term trade setups too.
Let’s get to the chart!
I have tried my best to bring the best possible outcome in this chart, Do not consider it as an
#DOT/USDT about to break out this falling wedge pattern and lying on very strong support.
ENTRY- $17.40 - $17.60
TARGET- 200
SL- If it breaks and closes below the 15.60
This chart is likely to help you in making better trade decisions, if it did do consider upvoting this chart.
Would also love to know your charts and views in the comment section.
Thank you

DOT/USDTWelcome to this quick Update, everyone.
If you are reading my updates for the first time do follow me to get more complex charts in a very simplified way.
I also post altcoin setups on Spot, Margin, and Futures.
I have tried my best to bring the best possible outcome in this chart.
DOT/USDT is making the bullish falling wedge pattern.
It is lying above the strong demand zone. MACD crossover is showing bullish momentum. RSI is in the oversold region. We can expect an upward move from here if BTC remains stable.
What's your thought on this?
Do hit the like button if you like this update and share your views in the comment section.
Thank you
#PEACE

DOTUSDT Ascending & Descending Channel.#DOTUSDT Looking for Sell trade setup as I mentioned in the Chart.!
Keep Supporting LIKE, COMMENT And FOLLOW.!
ThankYou.!

DOTUSDTWith the completion of 5 waves and the closing of the weekly candle, I predict that the range of 12 tetra in the first wave will decrease.

DOT/USDTDOT on 12h view broke inverse H&S pattern/bullish with potencial 83% way up..target is approximately 66.8 for this pattern..cheers

DOTUSDT Daily TimeframeSNIPER STRATEGY (new version)
It works ALMOST ON ANY CHART.
It produces Weak, Medium and Strong signals based on consisting elements.
NOT ALL TARGETS CAN BE ACHIEVED, let's make that clear.
TARGETS OR ENTRY PRICES ARE STRONG SUPPORT AND RESISTANCE LEVELS SO THEY CAN ACT LIKE PIVOT POINTS AND REVERSE THE WAVE (or act like a mirror that can reflects light) BASED ON STRENGTH OF THAT LEVEL.
ENTRY PRICE BLACK COLOR
MOST PROBABLE SCENARIOS TARGETS GREEN COLOR
LEAST PROBABLE SCENARIOS TARGETS RED COLOR
DO NOT USE THIS STROTEGY FOR LEVERAGED TRADING.
It will not give you the whole wave like any other strategy out there but it will give you a huge part of the wave.
The BEST TIMEFRAMES for this strategy are Daily, Weekly and Monthly however it can work on any timeframe.
Consider those points and you will have a huge advantage in the market.
There is a lot more about this strategy.
It can predict possible target and also give you almost exact buy or sell time on the spot.
I am developing it even more so stay tuned and start to follow me for more signals and forecasts.
START BELIEVING AND GOOD LUCK
HADIMOZAYAN

DOTUSDT RISING CHANNELAll info have been provided on chart. Observe well before taking position.
Your likes and opinions would be much appreciated, you can follow up for more helpful contents and do follow my comment sections too for quick updates.