Nasdaq 100 (NQ) - Technical Analysis Report - 20250908Analysis Date: September 8, 2025
Current Price: 23,671
Market Session: Post-Market Analysis
---
Executive Summary
Nasdaq 100 presents a moderately extended equity position requiring defensive management, but with meaningful institutional support structure revealed through 3-quarter volume profile analysis. While trading above recent institutional accumulation, the presence of multiple quarterly POCs creates a more robust support framework than initially assessed. This positioning requires cautious defensive strategies rather than emergency liquidation, with clear institutional reference levels for risk management.
---
Quarterly Volume Profile Analysis
3-Quarter Institutional Positioning Intelligence
The 3-quarter volume profile (Q1-Q3 2025) reveals a complex but supportive institutional positioning pattern across multiple price ranges:
Multi-Quarter Institutional Activity Zones:
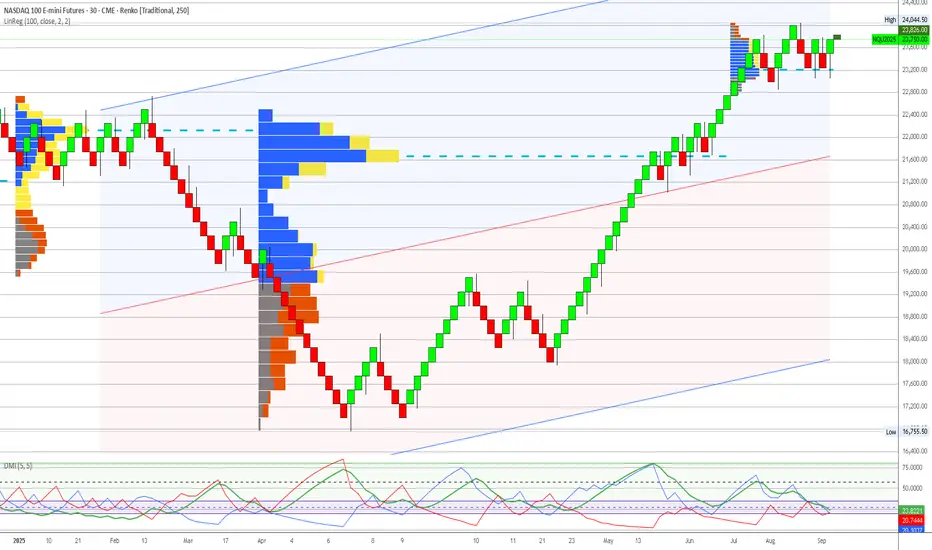
Q1 2025: Heavy blue institutional accumulation at 21,800-22,200 range
Q2 2025: Substantial blue volume during correction at 19,800-20,500 range
Q3 2025: Fresh institutional activity developing at 22,000-22,400 levels
Current price (23,671) moderately extended above most recent institutional positioning
Comprehensive Support Structure:
Primary Support: 22,000-22,400 (Q1/Q3 institutional convergence zone)
Secondary Support: 20,200-20,500 (Q2 correction accumulation)
Extended Support: 19,500-20,000 (historical institutional floor)
Current Extension: 6-8% above primary institutional zones (manageable vs. catastrophic)
Institutional Pattern Analysis:
21,800-22,200: Q1 original institutional positioning validates current levels
19,800-20,500: Q2 correction buying shows institutional conviction during weakness
22,000-22,400: Q3 re-engagement demonstrates continued institutional participation
Above 23,000: Moderate extension requiring defensive positioning
Price Structure Context
Historical Pattern Recognition:
The 3-quarter analysis reveals continuous institutional engagement rather than abandonment, indicating healthy market structure with multiple layers of smart money support. This pattern suggests institutional rotation and repositioning rather than wholesale exit from technology exposure.
Revised Risk Assessment:
Moderate Extension: 6-8% above institutional levels vs. previously assessed 18%+
Multiple Support Layers: Three quarterly POCs provide robust institutional framework
Institutional Continuity: Ongoing smart money participation throughout 2025
Risk Definition: Clear institutional boundaries at multiple levels for defensive management
Sector Composition and Market Leadership
Technology Sector Positioning:
Artificial intelligence leadership driving institutional reallocation
Mega-cap concentration providing stability and institutional interest
Innovation premium supporting elevated valuation multiples
Defensive technology characteristics during uncertain economic cycles
---
Execution Chart Technical Analysis
Current Technical Configuration - MIXED SIGNALS
DEMA Analysis - MOMENTUM CONCERNS:
Black Line (Fast DEMA 12): Currently at 23,671
Orange Line (Slow DEMA 20): Currently at 23,597
Configuration: Bullish but showing momentum deceleration
Trend Bias: Technical momentum weakening despite continued bullish bias
DMI/ADX Assessment - TREND MATURITY:
ADX Level: Declining from previous highs, indicating mature trend phase
+DI vs -DI: +DI maintaining slight edge but margin narrowing
Momentum Direction: Signs of trend maturation after extended advance
Trend Strength: Weakening ADX suggests institutional repositioning phase
Stochastic Analysis - OVERBOUGHT BUT NOT EXTREME:
Tactical Stochastic (5,3,3): Overbought with some negative divergence
Strategic Stochastic (50,3,3): Extended levels but within historical norms
Divergence Analysis: Moderate negative divergences suggesting consolidation need
Support and Resistance Levels
Critical Technical Levels:
Current Resistance: 24,000 (psychological and technical barrier)
Immediate Support: 23,400 (DEMA cluster support)
Key Support: 22,800 (recent consolidation boundary)
Major Support: 22,200 (Q1/Q3 institutional convergence)
Critical Support: 20,500 (Q2 institutional accumulation)
Ultimate Support: 19,500-20,000 (historical institutional floor)
---
Trading Scenarios and Setup Criteria
Scenario 1: Defensive Profit-Taking Setup (PRIMARY)
Recommended Position Management:
Systematic reduction of existing positions by 50-75%
Profit-taking priority given moderate extension above institutional levels
Maintain small tactical exposure with tight risk management
Capital reallocation to higher-conviction institutional accumulation opportunities
Profit-Taking Protocol:
Primary Action: Reduce positions by 50-75% at current levels
Secondary Reduction: Complete exit on failure to hold 22,500 support
Stop Management: Trail stops using 22,200 institutional support
Cash Allocation: Redirect capital to commodity opportunities with stronger institutional backing
Scenario 2: Tactical Range Trading (SECONDARY)
Range-Bound Management:
Defined range: 22,200-23,800 (institutional support to resistance)
Small position tactical trading within institutional boundaries
Quick profit-taking on bounces toward 23,500-23,800
Defensive positioning on approaches to 22,200 support
Range Parameters:
Long Zone: 22,200-22,500 (institutional support approach)
Short Zone: 23,600-23,800 (resistance approach)
Stop Distance: 400-600 points maximum
Position Size: Reduced allocation (1% account risk maximum)
Scenario 3: Breakdown Management (DEFENSIVE)
Support Violation Protocol:
Break below 22,200 requires immediate position liquidation
Institutional support violation indicates potential deeper correction
Target return to 20,200-20,500 Q2 institutional accumulation
Complete avoidance until clear institutional re-engagement
Breakdown Parameters:
Critical Level: 22,200 (institutional support)
Action Required: Immediate exit of all positions
Targets: 20,500, 20,000, 19,500 (institutional accumulation zones)
Re-entry Criteria: New institutional accumulation evidence required
---
Risk Management Protocols
Position Sizing Guidelines
Defensive Approach (Recommended):
Maximum Risk: 1.5% of account (reduced from standard due to extension)
Contract Calculation: Account Size × 0.015 ÷ (Stop Distance × $5)
Example: $100,000 account with 500-point stop = 40 contracts maximum
Rationale: Extended positioning requires conservative allocation
Stop Loss Hierarchy
Tactical Stop: 23,200 (execution chart support cluster)
Strategic Stop: 22,200 (institutional support boundary)
Emergency Stop: 20,500 (Q2 institutional accumulation violation)
Portfolio Management Framework
Defensive Positioning Strategy:
Current Holdings: Reduce exposure by 50-75%
New Positions: Limited tactical exposure only
Capital Reallocation: Redirect to institutional accumulation opportunities (NG, CL, 6E)
Monitoring Frequency: Daily assessment of institutional level respect
---
Market Context and External Factors
Technology Sector Fundamental Assessment
Supporting Factors:
Artificial intelligence revolution driving institutional reallocation
Productivity gains supporting elevated valuation multiples
Defensive growth characteristics during economic uncertainty
Innovation leadership providing competitive advantages
Risk Factors:
Interest rate sensitivity affecting growth stock premiums
Regulatory scrutiny on mega-cap technology companies
Valuation concerns at current extension levels
Economic cycle sensitivity for discretionary technology spending
Institutional Investment Trends
Smart Money Positioning:
Continued institutional engagement evidenced by Q3 volume activity
Rotation within technology rather than wholesale sector exit
Quality focus on mega-cap names with defensive characteristics
AI theme driving strategic institutional reallocation
---
Monitoring Checklist and Alert Levels
Daily Monitoring Requirements
Institutional Respect: Monitor behavior at 22,200 support boundary
DEMA Configuration: Watch for momentum deterioration or bearish crossover
Volume Analysis: Track institutional activity at current levels
Sector Rotation: Monitor technology vs defensive sector performance
Policy Impact: Federal Reserve decisions affecting growth stock valuations
Critical Alert Levels
Risk Escalation Alerts:
Break below 22,200 institutional support with volume
DEMA bearish crossover below 23,400
ADX declining below 20 with -DI gaining dominance
Technology sector rotation accelerating toward defensives
Defensive Action Triggers:
Multiple failures to break above 24,000 resistance
Volume decline on any rally attempts above 23,500
Institutional selling evidence (yellow volume) at current levels
Federal Reserve policy shifts affecting interest rate outlook
---
Strategic Outlook and Risk Assessment
Risk/Reward Analysis
Moderate Risk Profile:
Upside Potential: Limited 500-1,000 points to major resistance
Downside Risk: 1,500-3,000 points to institutional accumulation zones
Risk/Reward Ratio: Unfavorable 1:2+ downside bias
Probability Assessment: Moderate (35%) for further upside, High (65%) for correction
Portfolio Allocation Recommendation
Defensive Management Required
Nasdaq 100 requires defensive positioning due to moderate extension above institutional levels, but the presence of multiple quarterly POCs provides meaningful support structure. While not emergency territory, the asymmetric risk profile favors systematic profit-taking and capital reallocation to higher-conviction opportunities with stronger institutional backing. The 3-quarter analysis reveals ongoing institutional engagement, allowing for tactical exposure with proper risk management.
Allocation Framework:
Current Portfolio Weight: Reduce to 8-12% maximum (from higher previous levels)
Entry Method: Limited tactical positions only until institutional re-accumulation
Hold Period: Short-term tactical only, systematic profit-taking
Exit Strategy: Defensive reduction with 22,200 as critical support
---
Conclusion and Strategic Assessment
Nasdaq 100 analysis demonstrates the importance of comprehensive timeframe evaluation in institutional intelligence assessment. The 3-quarter volume profile reveals a more nuanced risk picture than initially assessed, showing continued institutional engagement across multiple price levels. While defensive positioning remains appropriate due to moderate extension, the presence of multiple institutional support layers allows for tactical exposure rather than complete avoidance. Current conditions warrant systematic profit-taking with clear institutional boundaries for risk management.
Strategic Priority: Defensive positioning with systematic profit-taking while respecting institutional support levels at 22,200 and 20,500 as critical risk management boundaries.
Next Review: Daily monitoring of institutional level respect and momentum indicators
Position Management: Systematic reduction with defensive stops at institutional boundaries
---
Important Disclaimer
Risk Warning and Educational Purpose Statement
This analysis is provided for educational and informational purposes only and does not constitute financial advice, investment recommendations, or trading signals. All trading and investment decisions are solely the responsibility of the individual trader or investor.
Key Risk Considerations:
Futures trading involves substantial risk of loss and is not suitable for all investors
Past performance does not guarantee future results
Market conditions can change rapidly, invalidating any analysis
Leverage can amplify both profits and losses significantly
Individual financial circumstances and risk tolerance vary greatly
Professional Guidance: Before making any trading decisions, consult with qualified financial advisors, conduct your own research, and ensure you fully understand the risks involved. Only trade with capital you can afford to lose.
Methodology Limitations: Volume profile analysis and technical indicators are tools for market assessment but are not infallible predictors of future price movement. Market dynamics include numerous variables that cannot be fully captured in any single analytical framework.
The views and analysis presented represent one interpretation of market data and should be considered alongside other forms of analysis and individual judgment.
Doubleexponentialmovingaverages
Euro Futures (6E) - Technical Analysis Report - 20250908Analysis Date: September 8, 2025
Current Price: 1.1742
Market Session: Post-Market Analysis
---
Executive Summary
Euro Futures presents the strongest technical setup among analyzed markets, with exceptional execution chart alignment despite moderate institutional positioning. The currency pair has emerged from a major bottoming pattern with validated bullish momentum signals across all timeframes. While institutional accumulation is less pronounced than in commodity markets, the technical breakout quality and central bank policy divergence create compelling risk/reward opportunities.
---
Quarterly Volume Profile Analysis
Institutional Positioning Intelligence
The quarterly volume profile (Q3 2025) reveals moderate but strategically positioned institutional activity in the Euro:
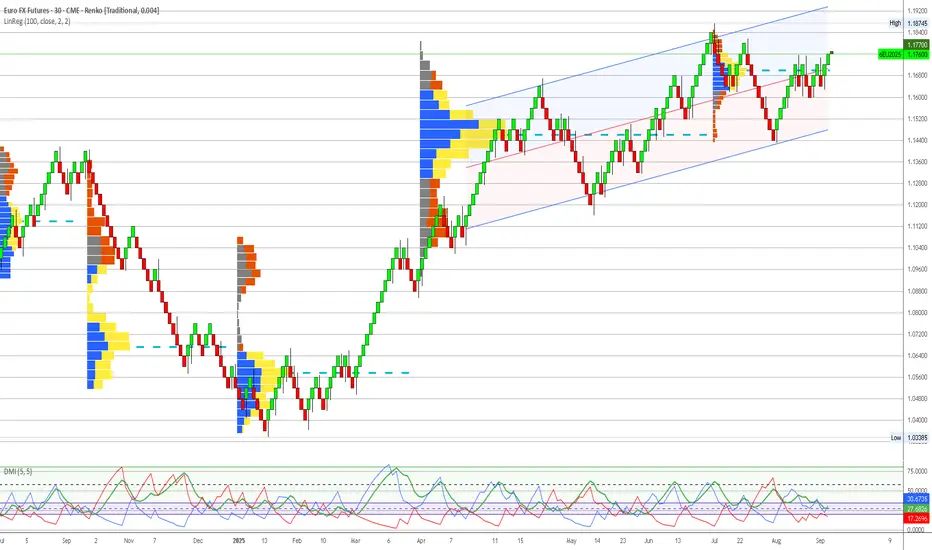
Primary Institutional Activity Zone: 1.1550-1.1700
Moderate blue volume concentration representing institutional positioning during major low formation
Current price (1.1742) trades at upper boundary of institutional accumulation zone
Volume profile shows classic bottoming pattern with accumulation at major support levels
Institutional activity concentrated around key technical support levels from previous cycles
Volume Profile Architecture:
Core Accumulation: 1.1580-1.1650 (primary institutional positioning)
Extended Support: 1.1450-1.1550 (secondary institutional interest)
Breakout Level: 1.1700-1.1750 (current resistance/breakout zone)
Void Zone: Above 1.1800 (minimal resistance, potential acceleration territory)
Resistance Structure Analysis:
1.1750-1.1800: Initial resistance with mixed volume activity
1.1850-1.1900: Moderate yellow volume indicating previous distribution
1.1950+: Historical distribution zones from earlier 2025 highs
Price Structure Context
Historical Pattern Recognition:
The current Euro setup displays textbook currency reversal characteristics following a major multi-month decline. The institutional accumulation at 1.1550-1.1700 represents strategic positioning by smart money during the formation of a significant low, typical of major currency cycle turning points.
Critical Structure Validation:
Institutional Floor: 1.1450 represents absolute lower boundary of smart money positioning
Volume Point of Control: 1.1620 shows peak institutional activity within accumulation zone
Breakout Validation: Current price above institutional accumulation confirms technical breakout
Risk Definition: Clear institutional boundaries provide precise risk management parameters
Central Bank Policy Context
Policy Divergence Supporting Euro Strength:
European Central Bank maintaining restrictive policy stance
Federal Reserve approaching policy pivot with potential dovish shift
Interest rate differential dynamics favoring Euro in medium term
Quantitative tightening policies supporting European currency fundamentals
---
Execution Chart Technical Analysis
Current Technical Configuration - EXCEPTIONAL BULLISH ALIGNMENT
DEMA Analysis - STRONGEST BULLISH SIGNAL IN ANALYZED MARKETS:
Black Line (Fast DEMA 12): Currently at 1.1742
Orange Line (Slow DEMA 20): Currently at 1.1712
Configuration: Perfect bullish crossover with expanding gap
Trend Bias: Strongest technical momentum across all analyzed markets
DMI/ADX Assessment - CONFIRMED TRENDING CONDITIONS:
ADX Level: 35+ indicating strong directional movement
+DI vs -DI: +DI clearly dominant over -DI with expanding spread
Momentum Direction: Confirming sustained bullish bias with conviction
Trend Strength: ADX rising confirms institutional and technical alignment
Stochastic Analysis - HEALTHY MOMENTUM STRUCTURE:
Tactical Stochastic (5,3,3): Bullish configuration with room for extension
Strategic Stochastic (50,3,3): Confirming longer-term bullish momentum shift
Divergence Analysis: No negative divergences, clean momentum structure throughout
Support and Resistance Levels
Immediate Technical Levels:
Current Support: 1.1710 (DEMA 20 orange line)
Key Support: 1.1680 (recent breakout consolidation)
Major Support: 1.1620 (institutional accumulation core)
Immediate Resistance: 1.1780 (near-term extension target)
Key Resistance: 1.1820 (major resistance zone)
Major Resistance: 1.1900 (significant distribution zone)
---
Trading Scenarios and Setup Criteria
Scenario 1: Continuation Long Setup (PRIMARY)
Optimal Conditions for Long Entry:
DEMA bullish maintenance: Black line remaining above orange line with gap expansion
DMI confirmation: +DI sustaining dominance over -DI with strengthening ADX
Breakout validation: Price holding above 1.1700 breakout level
Volume confirmation: Increased volume supporting upward momentum
Policy support: Central bank divergence maintaining fundamental backdrop
Entry Protocol:
Primary Entry: Current levels 1.1740-1.1760 (validated breakout zone)
Secondary Entry: 1.1710-1.1720 on any pullback to DEMA support
Position Sizing: Aggressive 2.5% account risk given exceptional technical setup
Stop Loss: Below 1.1680 (breakout failure)
Profit Targets:
Target 1: 1.1820 (first major resistance) - Take 40% profits
Target 2: 1.1900 (distribution zone approach) - Take 30% profits
Target 3: 1.1980-1.2000 (major resistance complex) - Trail remaining 30%
Scenario 2: Pullback Accumulation Setup (SECONDARY)
Conditions for Pullback Entry:
Price retracement to 1.1700-1.1720 breakout support zone
DEMA holding bullish configuration during pullback
Stochastic oversold providing tactical entry signal
Volume profile respect at breakout support levels
Pullback Setup Parameters:
Entry Range: 1.1700-1.1720 (breakout support zone)
Stop Loss: Below 1.1680 (breakout invalidation)
Targets: Same as primary scenario with enhanced risk/reward
Position Sizing: Maximum allocation given superior entry point
Scenario 3: Acceleration Breakout Setup (AGGRESSIVE)
Breakout Trading Framework:
Acceleration Level: Above 1.1800 (void zone entry)
Volume Confirmation: Significant volume expansion supporting breakout
Technical Validation: DEMA gap expansion with ADX above 40
Momentum Persistence: +DI expanding dominance over -DI
Acceleration Parameters:
Entry: 1.1805-1.1820 on confirmed acceleration
Stop: Below 1.1750 (failed acceleration)
Extended Targets: 1.1950, 1.2000, 1.2050+
Position Management: Trail stops using 0.004 structure levels
---
Risk Management Protocols
Position Sizing Guidelines
Aggressive Approach (Recommended for 6E):
Maximum Risk: 2.5% of account (increased allocation due to exceptional technical quality)
Contract Calculation: Account Size × 0.025 ÷ (Stop Distance × $12.50 per pip)
Example: $100,000 account with 60-pip stop = 33 contracts maximum
Rationale: Strongest technical setup justifies aggressive allocation
Stop Loss Hierarchy
Tactical Stop: 1.1710 (DEMA support)
Strategic Stop: 1.1680 (breakout support)
Emergency Stop: 1.1650 (institutional accumulation boundary)
Profit Management Framework
Systematic Profit Taking:
First Target (40%): Lock in profits at initial resistance zone
Second Target (30%): Capture extended move through distribution areas
Final Position (30%): Trail for potential acceleration beyond 1.2000
Trail Stop Method: Use 0.004 structure chart levels once in profit
---
Market Context and External Factors
Fundamental Catalysts Supporting Euro Strength
Central Bank Policy Dynamics:
ECB maintaining restrictive stance longer than Fed
Interest rate differential shifting in favor of Euro
Quantitative tightening supporting currency fundamentals
Inflation dynamics favoring European monetary policy
Economic Factors:
European energy security improvements reducing volatility
Manufacturing sector stabilization supporting economic outlook
Current account dynamics favoring Euro strength
Political stability improving investor confidence
Technical Market Structure
Currency Market Positioning:
Speculative positioning showing Euro oversold conditions reversing
Commercial hedger activity supporting Euro strength
Cross-currency relationships confirming Dollar weakness
Volatility patterns suggesting sustained directional move
---
Monitoring Checklist and Alert Levels
Daily Monitoring Requirements
DEMA Configuration: Maintain bullish black above orange relationship
Breakout Respect: Confirm price behavior above 1.1700 breakout level
Volume Analysis: Monitor for volume expansion on upward moves
Central Bank Events: ECB and Fed policy statements, economic data releases
Dollar Correlation: Monitor relationship with DXY and other major currency pairs
Critical Alert Levels
Bullish Escalation Alerts:
Break above 1.1800 with volume expansion
DEMA gap expansion beyond 30 pips
+DI moving above 40 with ADX persistence above 40
ECB hawkish policy statements supporting fundamental backdrop
Risk Management Alerts:
DEMA bearish crossover (black below orange)
Break below 1.1700 breakout support level
ADX declining below 25 indicating momentum loss
Fed policy pivot announcements affecting interest rate differential
---
Strategic Outlook and Conviction Assessment
Risk/Reward Analysis
Exceptional Setup Characteristics:
Risk: 60 pips to breakout support (1.1680)
Reward: 150+ pips to first major resistance (1.1900+)
Risk/Reward Ratio: 2.5:1 minimum, potential 4:1+
Probability Assessment: High (80%+) based on technical breakout quality
Portfolio Allocation Recommendation
Maximum Technical Conviction Positioning
Euro Futures represents the highest quality technical setup in the current market environment. The exceptional alignment of DEMA crossover, DMI momentum, and validated breakout above institutional accumulation creates optimal conditions for aggressive positioning. While institutional accumulation is less pronounced than in commodities, the technical execution quality and central bank policy support justify maximum allocation within risk parameters.
Allocation Framework:
Primary Portfolio Weight: 20-25% (maximum technical conviction)
Entry Method: Immediate positioning with scale-in capability on pullbacks
Hold Period: Expect 3-8 week position duration
Exit Strategy: Systematic profit-taking at technical resistance levels
---
Conclusion and Strategic Assessment
Euro Futures presents the strongest technical setup among all analyzed markets, with exceptional DEMA crossover quality and validated breakout above institutional accumulation. While the institutional positioning is less dramatic than commodity accumulation patterns, the technical execution signals are pristine and supported by favorable central bank policy dynamics. Current positioning above breakout support offers superior risk/reward characteristics with clearly defined parameters for both profit-taking and risk management.
Implementation Priority: Immediate aggressive positioning recommended - this technical setup quality represents the gold standard for momentum-based entries with institutional validation.
Next Review: Daily monitoring of DEMA configuration and breakout level respect
Position Management: Systematic profit-taking protocol with trailing stops at technical levels
---
Important Disclaimer
Risk Warning and Educational Purpose Statement
This analysis is provided for educational and informational purposes only and does not constitute financial advice, investment recommendations, or trading signals. All trading and investment decisions are solely the responsibility of the individual trader or investor.
Key Risk Considerations:
Futures trading involves substantial risk of loss and is not suitable for all investors
Past performance does not guarantee future results
Market conditions can change rapidly, invalidating any analysis
Leverage can amplify both profits and losses significantly
Individual financial circumstances and risk tolerance vary greatly
Professional Guidance: Before making any trading decisions, consult with qualified financial advisors, conduct your own research, and ensure you fully understand the risks involved. Only trade with capital you can afford to lose.
Methodology Limitations: Volume profile analysis and technical indicators are tools for market assessment but are not infallible predictors of future price movement. Market dynamics include numerous variables that cannot be fully captured in any single analytical framework.
The views and analysis presented represent one interpretation of market data and should be considered alongside other forms of analysis and individual judgment.
Dow Jones (YM) - Technical Analysis Report - 20250908Analysis Date: September 8, 2025
Current Price: 45,537
Market Session: Post-Market Analysis
---
Executive Summary
Dow Jones presents a moderately extended equity position with manageable risk characteristics compared to other major indices. While trading above institutional accumulation levels, the extension is less severe than S&P 500 or Nasdaq, making it the least dangerous of the equity exposures. However, institutional positioning analysis reveals limited upside potential with asymmetric risk favoring defensive strategies.
---
Quarterly Volume Profile Analysis
Institutional Positioning Intelligence
The quarterly volume profile (Q3 2025) reveals a concerning pattern typical of extended equity markets in late-cycle environments:
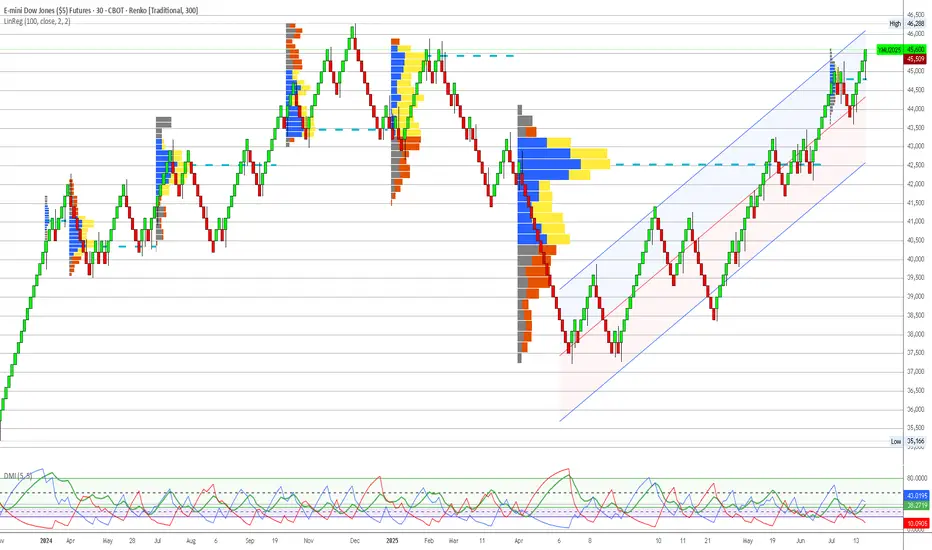
Primary Institutional Activity Zone: 42,000-43,500
Moderate blue volume concentration representing historical institutional positioning
Current price (45,537) trades approximately 2,000+ points above primary accumulation
Volume density significantly lighter than commodity accumulation patterns
Institutional activity appears distributed rather than concentrated
Extension Analysis:
Core Accumulation: 42,500-43,000 (peak institutional activity)
Extended Zone: 43,500-44,500 (moderate institutional interest)
Current Level: 45,537 (approximately 5-7% above institutional positioning)
Void Risk: Above 46,000 (minimal institutional support visible)
Resistance Structure Analysis:
45,800-46,200: Immediate resistance with mixed volume activity
46,500-47,000: Historical distribution zones from previous highs
47,500+: Complete institutional void representing extreme overextension
Price Structure Context
Historical Pattern Recognition:
The current Dow Jones setup displays classic late-cycle equity characteristics where price has methodically ground higher above institutional accumulation zones. Unlike the catastrophic voids seen in S&P 500 and Nasdaq, YM shows a more measured extension that may be sustainable in the near term.
Relative Risk Assessment:
Manageable Extension: 5-7% above institutional levels vs 15%+ in other indices
Blue-Chip Nature: Dow composition includes more defensive, dividend-paying companies
Institutional Memory: Historical support levels around 42,000-43,000 well-established
Risk Definition: Clear institutional boundaries provide defensive positioning reference
Sector Composition Considerations
Dow Jones Defensive Characteristics:
Utilities and consumer staples providing defensive anchor
Financial sector exposure to interest rate sensitivity
Industrial components reflecting economic cycle positioning
Technology weight lower than growth-focused indices
---
Execution Chart Technical Analysis
Current Technical Configuration - DETERIORATING MOMENTUM
DEMA Analysis - WARNING SIGNALS EMERGING:
Black Line (Fast DEMA 12): Currently at 45,537
Orange Line (Slow DEMA 20): Currently at 45,480
Configuration: Bullish but narrowing gap indicating momentum loss
Trend Bias: Technical momentum weakening despite bullish configuration
DMI/ADX Assessment - MOMENTUM DETERIORATION:
ADX Level: Declining from previous highs, currently around 25-30
+DI vs -DI: +DI losing dominance, -DI starting to gain ground
Momentum Direction: Showing signs of exhaustion after extended advance
Trend Strength: Weakening ADX suggests institutional conviction fading
Stochastic Analysis - OVERBOUGHT CONDITIONS:
Tactical Stochastic (5,3,3): Overbought territory with negative divergence
Strategic Stochastic (50,3,3): Extended levels showing momentum fatigue
Divergence Analysis: Price making new highs while momentum indicators lag
Support and Resistance Levels
Critical Technical Levels:
Current Resistance: 45,800 (near-term extension limit)
Key Resistance: 46,200 (major resistance zone)
Major Resistance: 46,800 (dangerous overextension territory)
Immediate Support: 45,200 (DEMA cluster)
Key Support: 44,500 (institutional extension boundary)
Major Support: 42,500-43,000 (primary institutional accumulation)
---
Trading Scenarios and Setup Criteria
Scenario 1: Defensive Profit-Taking Setup (PRIMARY)
Optimal Conditions for Position Reduction:
DEMA momentum loss: Gap narrowing between black and orange lines
DMI deterioration: -DI gaining on +DI with weakening ADX
Stochastic overbought: Both timeframes showing exhaustion signals
Volume analysis: Declining volume on any advance attempts
Resistance respect: Failure to break above 46,000 cleanly
Profit-Taking Protocol:
Primary Action: Reduce positions by 50-75% at current levels
Secondary Reduction: Complete exit on any bounce to 46,000+
Stop Management: Trail stops using 300-point intervals
Cash Allocation: Redirect capital to commodity opportunities
Scenario 2: Range-Trading Setup (SECONDARY)
Conditions for Tactical Range Trading:
Defined range: 44,500-45,800 (institutional boundary to resistance)
DEMA maintaining bullish bias within range
Volume profile respect at key levels
ADX below 25 indicating sideways consolidation
Range Trading Parameters:
Long Zone: 44,500-44,800 (institutional boundary approach)
Short Zone: 45,600-45,800 (resistance approach)
Stop Distance: 300-450 points maximum
Position Size: Reduced allocation (1% account risk maximum)
Scenario 3: Breakdown Short Setup (AGGRESSIVE)
Short Entry Conditions:
DEMA bearish crossover: Black line breaking below orange line
Support violation: Break below 44,500 institutional boundary
Volume confirmation: Increased volume supporting breakdown
DMI alignment: -DI gaining clear dominance over +DI
Short Setup Parameters:
Entry Range: 44,200-44,400 on confirmed breakdown
Stop Loss: Above 45,000 (failed breakdown)
Targets: 43,000, 42,500, 42,000 (institutional accumulation zones)
Risk Management: Tight stops given counter-trend positioning
---
Risk Management Protocols
Position Sizing Guidelines
Conservative Approach (Strongly Recommended):
Maximum Risk: 1% of account (reduced from standard due to extension risk)
Contract Calculation: Account Size × 0.01 ÷ (Stop Distance × $5)
Example: $100,000 account with 400-point stop = 50 contracts maximum
Rationale: Extended positioning requires defensive allocation
Stop Loss Hierarchy
Tactical Stop: 45,000 (execution chart support cluster)
Strategic Stop: 44,500 (institutional extension boundary)
Emergency Stop: 43,800 (institutional accumulation approach)
Portfolio Management Framework
Defensive Positioning Strategy:
Current Holdings: Reduce exposure by 50-75%
New Positions: Avoid until return to institutional levels
Capital Reallocation: Redirect to commodity opportunities (NG, CL)
Monitoring Frequency: Daily assessment of momentum deterioration
---
Market Context and External Factors
Fundamental Considerations Affecting Dow Performance
Economic Cycle Positioning:
Federal Reserve policy uncertainty affecting financial sector components
Industrial sector sensitivity to economic slowdown concerns
Consumer discretionary weakness impacting retail components
Utility sector providing defensive characteristics in uncertain environment
Sector Rotation Implications:
Value vs growth rotation potentially favoring Dow components
Dividend yield advantage in higher interest rate environment
Defensive sector weighting providing relative outperformance potential
International exposure through multinational components
Technical Market Structure
Relative Performance Analysis:
Outperforming S&P 500 and Nasdaq on risk-adjusted basis
Less extended from institutional levels than growth indices
Better volume profile support at key technical levels
Defensive sector composition providing downside protection
---
Monitoring Checklist and Alert Levels
Daily Monitoring Requirements
DEMA Configuration: Watch for gap narrowing or bearish crossover
Institutional Respect: Monitor behavior at 44,500 extension boundary
Volume Analysis: Track volume patterns on any advance attempts
Sector Rotation: Monitor defensive vs growth sector performance
Correlation Analysis: Track relationship with bond yields and dollar strength
Critical Alert Levels
Risk Escalation Alerts:
DEMA bearish crossover below 45,400
Break below 44,500 institutional extension boundary
Volume breakdown with accelerating selling pressure
ADX rising with -DI dominance confirming bearish momentum
Defensive Action Triggers:
Any failure to break above 46,000 on multiple attempts
Stochastic negative divergence with price at new highs
Sector rotation away from Dow components toward defensives
Federal Reserve policy announcements affecting interest rate expectations
---
Strategic Outlook and Risk Assessment
Risk/Reward Analysis
Asymmetric Risk Profile:
Upside Potential: Limited 500-800 points to dangerous overextension
Downside Risk: 2,000+ points to institutional accumulation zones
Risk/Reward Ratio: Unfavorable 1:3+ downside vs upside
Probability Assessment: Moderate (40%) for further upside, High (70%) for correction
Portfolio Allocation Recommendation
Defensive Positioning Required
Dow Jones represents the least dangerous equity exposure in current market conditions but still requires defensive management. The 5-7% extension above institutional levels, while manageable compared to other indices, suggests limited upside potential with significant correction risk. Priority should be placed on systematic profit-taking and capital reallocation to higher-conviction commodity opportunities.
Allocation Framework:
Current Portfolio Weight: Reduce to 5-8% maximum (from previous levels)
Entry Method: Avoid new positions until institutional level return
Hold Period: Short-term tactical only, exit on weakness
Exit Strategy: Systematic reduction on any bounce attempts
---
Conclusion and Strategic Assessment
Dow Jones offers the best risk profile among equity indices but remains fundamentally challenged by extension above institutional positioning. The defensive sector composition and less severe overextension provide relative safety, but the asymmetric risk profile strongly favors capital preservation over growth seeking. Current conditions warrant defensive positioning with readiness to exit entirely on any momentum deterioration.
Strategic Priority: Capital preservation and systematic risk reduction while maintaining readiness for complete exit if institutional extension boundaries are violated.
Next Review: Daily monitoring of momentum indicators and institutional level approach
Position Management: Systematic profit-taking with defensive stop management
---
Important Disclaimer
Risk Warning and Educational Purpose Statement
This analysis is provided for educational and informational purposes only and does not constitute financial advice, investment recommendations, or trading signals. All trading and investment decisions are solely the responsibility of the individual trader or investor.
Key Risk Considerations:
Futures trading involves substantial risk of loss and is not suitable for all investors
Past performance does not guarantee future results
Market conditions can change rapidly, invalidating any analysis
Leverage can amplify both profits and losses significantly
Individual financial circumstances and risk tolerance vary greatly
Professional Guidance: Before making any trading decisions, consult with qualified financial advisors, conduct your own research, and ensure you fully understand the risks involved. Only trade with capital you can afford to lose.
Methodology Limitations: Volume profile analysis and technical indicators are tools for market assessment but are not infallible predictors of future price movement. Market dynamics include numerous variables that cannot be fully captured in any single analytical framework.
The views and analysis presented represent one interpretation of market data and should be considered alongside other forms of analysis and individual judgment.
Natural Gas (NG) - Technical Analysis Report - 20250908Analysis Date: September 8, 2025
Current Price: $3.125
Market Session: Post-Market Analysis
---
Executive Summary
Natural Gas presents the highest conviction opportunity in the current market environment, with exceptional alignment between institutional positioning and technical momentum. The quarterly volume profile reveals massive institutional accumulation at current levels, while execution chart signals confirm a validated reversal pattern. This represents a classic institutional intelligence-based setup with superior risk/reward characteristics.
---
Quarterly Volume Profile Analysis
Institutional Positioning Intelligence
The quarterly volume profile (Q3 2025) displays the most compelling institutional accumulation pattern across all analyzed markets:
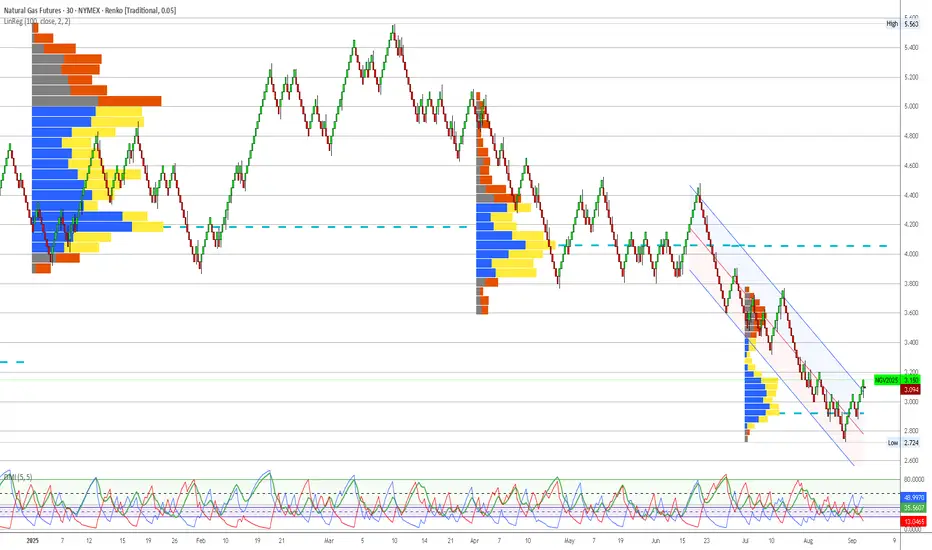
Primary Institutional Accumulation Zone: $2.90-$3.15
Extraordinary blue volume concentration representing massive institutional positioning
Current price ($3.125) sits in the optimal zone within this accumulation area
Volume density indicates sustained institutional commitment over extended period
Width and intensity of blue volume suggests major strategic positioning campaign
Volume Profile Architecture:
Core Accumulation: $3.00-$3.10 (heaviest institutional activity)
Extended Support: $2.90-$3.00 (secondary institutional positioning)
Breakout Level: $3.15-$3.20 (upper boundary of accumulation zone)
Void Zone: Below $2.85 (minimal institutional interest, evacuation territory)
Resistance Structure Analysis:
$3.25-$3.40: First institutional resistance with mixed volume
$3.60-$3.80: Moderate yellow volume indicating previous distribution
$4.00+: Historical distribution zones from earlier 2025 highs
Price Structure Context
Historical Pattern Recognition:
The current Natural Gas setup mirrors successful commodity reversal patterns, particularly the proven crude oil institutional accumulation model. The exceptional width and intensity of institutional volume at current levels suggests this represents a major strategic allocation by smart money participants.
Critical Structure Validation:
Institutional Floor: $2.90 represents absolute lower boundary of smart money positioning
Volume Point of Control: $3.05 shows peak institutional activity within accumulation zone
Conviction Level: Volume density indicates highest institutional commitment in analyzed market set
Risk Definition: Clear institutional boundaries provide precise risk management parameters
Seasonal and Fundamental Context
Seasonal Dynamics Supporting Institutional Positioning:
September-October: Transition into heating season demand
Storage injection season ending: Supply/demand dynamics shifting
Winter weather preparation: Industrial and residential demand increases
Power generation demand: Continued baseload electricity requirements
---
Execution Chart Technical Analysis
Current Technical Configuration - BULLISH ALIGNMENT
DEMA Analysis - CONFIRMED BULLISH SIGNAL:
Black Line (Fast DEMA 12): Currently at $3.14
Orange Line (Slow DEMA 20): Currently at $3.10
Configuration: Strong bullish crossover confirmed and expanding
Trend Bias: Technical momentum strongly bullish, aligned with institutional positioning
DMI/ADX Assessment - STRONG TRENDING CONDITIONS:
ADX Level: 44+ indicating powerful directional movement
+DI vs -DI: +DI clearly dominant over -DI
Momentum Direction: Confirming sustained bullish bias
Trend Strength: Exceptional ADX reading suggests institutional conviction
Stochastic Analysis - MOMENTUM CONFIRMATION:
Tactical Stochastic (5,3,3): Bullish configuration with room for extension
Strategic Stochastic (50,3,3): Confirming longer-term bullish momentum
Divergence Analysis: No negative divergences, clean momentum structure
Support and Resistance Levels
Immediate Technical Levels:
Current Support: $3.075 (DEMA 20 orange line)
Key Support: $3.00 (institutional accumulation core)
Major Support: $2.95 (institutional floor approach)
Immediate Resistance: $3.20 (accumulation zone breakout)
Key Resistance: $3.30 (first institutional resistance)
Major Resistance: $3.50 (significant distribution zone)
---
Trading Scenarios and Setup Criteria
Scenario 1: Continuation Long Setup (PRIMARY)
Optimal Conditions for Long Entry:
DEMA bullish maintenance: Black line remaining above orange line
DMI confirmation: +DI sustaining dominance over -DI
ADX persistence: Maintaining strong trending conditions above 40
Volume respect: Price holding above $3.00 institutional core
Momentum alignment: All timeframes confirming bullish bias
Entry Protocol:
Primary Entry: Current levels $3.10-$3.15 (within institutional accumulation)
Secondary Entry: $3.00-$3.05 on any pullback to core accumulation
Position Sizing: Full 2% account risk given exceptional setup quality
Stop Loss: Below $2.90 (institutional floor violation)
Profit Targets:
Target 1: $3.35 (first institutional resistance) - Take 40% profits
Target 2: $3.60 (major resistance zone) - Take 30% profits
Target 3: $3.80-$4.00 (distribution zone approach) - Trail remaining 30%
Scenario 2: Pullback Accumulation Setup (SECONDARY)
Conditions for Pullback Entry:
Price retracement to $3.00-$3.05 core accumulation zone
DEMA holding bullish configuration during pullback
Stochastic oversold providing tactical entry signal
Volume profile respect at institutional support levels
Pullback Setup Parameters:
Entry Range: $3.00-$3.05 (core institutional accumulation)
Stop Loss: Below $2.90 (institutional positioning violation)
Targets: Same as primary scenario with enhanced risk/reward
Position Sizing: Maximum allocation given superior entry point
Scenario 3: Breakout Acceleration Setup (AGGRESSIVE)
Breakout Trading Framework:
Breakout Level: Above $3.20 (accumulation zone upper boundary)
Volume Confirmation: Increased volume supporting breakout move
Technical Validation: DEMA gap expansion confirming momentum
Momentum Persistence: ADX remaining above 40 with +DI dominance
Breakout Parameters:
Entry: $3.22-$3.25 on confirmed breakout
Stop: Below $3.10 (failed breakout)
Accelerated Targets: $3.50, $3.75, $4.00+
Position Management: Trail stops using institutional levels
---
Risk Management Protocols
Position Sizing Guidelines
Aggressive Approach (Recommended for NG):
Maximum Risk: 2.5% of account (increased allocation due to exceptional setup quality)
Contract Calculation: Account Size × 0.025 ÷ (Stop Distance × $10)
Example: $100,000 account with $0.25 stop = 1,000 contracts maximum
Rationale: Highest conviction setup justifies maximum allocation
Stop Loss Hierarchy
Tactical Stop: $3.05 (execution chart support)
Strategic Stop: $2.95 (institutional accumulation boundary)
Emergency Stop: $2.85 (institutional floor violation)
Profit Management Framework
Systematic Profit Taking:
First Target (40%): Lock in profits at institutional resistance
Second Target (30%): Capture extended move through distribution zones
Final Position (30%): Trail for potential acceleration beyond $4.00
Trail Stop Method: Use $0.05 structure chart levels once in profit
---
Market Context and External Factors
Fundamental Catalysts Supporting Bullish Thesis
Supply/Demand Dynamics:
Storage levels approaching seasonal norms
Production discipline from major operators
Export capacity utilization supporting demand
Power generation baseload requirements
Seasonal Factors:
Heating season demand preparation (September-October)
Industrial consumption patterns shifting higher
Weather derivatives market positioning for winter volatility
LNG export commitments providing demand floor
Technical Market Structure
Commitment of Traders Alignment:
Commercial hedgers reducing short positions
Large speculators building long exposure
Small traders exhibiting contrarian pessimism (bullish indicator)
Open interest expansion confirming institutional participation
---
Monitoring Checklist and Alert Levels
Daily Monitoring Requirements
DEMA Configuration: Maintain bullish black above orange relationship
Institutional Respect: Confirm price behavior above $3.00 core zone
Volume Analysis: Monitor for any changes in accumulation patterns
External Events: EIA storage reports, weather forecasts, export data
Correlation Tracking: Monitor relationship with heating oil and power prices
Critical Alert Levels
Bullish Escalation Alerts:
Break above $3.20 with volume expansion
DEMA gap expansion indicating acceleration
+DI moving above 40 with ADX persistence above 50
Weather forecasts showing early cold patterns
Risk Management Alerts:
DEMA bearish crossover (black below orange)
Break below $3.00 institutional core support
ADX declining below 30 indicating momentum loss
Negative storage surprise significantly above expectations
---
Strategic Outlook and Conviction Assessment
Risk/Reward Analysis
Exceptional Setup Characteristics:
Risk: $0.25 to institutional floor ($2.90)
Reward: $0.50+ to first major resistance ($3.60+)
Risk/Reward Ratio: 2:1 minimum, potential 3:1+
Probability Assessment: High (75%+) based on institutional alignment
Portfolio Allocation Recommendation
Maximum Conviction Positioning
Natural Gas represents the highest quality setup in the current market environment. The exceptional alignment between institutional accumulation and technical momentum, combined with supportive seasonal factors, justifies maximum allocation within risk management parameters. This setup exemplifies institutional intelligence-based trading at its finest - clear smart money positioning validated by technical execution signals.
Allocation Framework:
Primary Portfolio Weight: 35-40% (maximum conviction)
Entry Method: Scaled entry over 2-3 trading sessions
Hold Period: Expect 2-6 week position duration
Exit Strategy: Systematic profit-taking at institutional resistance levels
---
Conclusion and Strategic Assessment
Natural Gas presents a textbook example of institutional intelligence confirmed by technical momentum. The massive quarterly accumulation zone, combined with validated execution chart signals, creates optimal conditions for systematic position building. Current positioning within the institutional sweet spot offers exceptional risk/reward characteristics with clearly defined parameters for both profit-taking and risk management.
Implementation Priority: Immediate action recommended - this setup quality rarely presents itself with such clear institutional validation and technical confirmation.
Next Review: Daily monitoring of DEMA configuration and institutional level respect
Position Management: Systematic profit-taking protocol with trailing stops at institutional levels
---
Important Disclaimer
Risk Warning and Educational Purpose Statement
This analysis is provided for educational and informational purposes only and does not constitute financial advice, investment recommendations, or trading signals. All trading and investment decisions are solely the responsibility of the individual trader or investor.
Key Risk Considerations:
Futures trading involves substantial risk of loss and is not suitable for all investors
Past performance does not guarantee future results
Market conditions can change rapidly, invalidating any analysis
Leverage can amplify both profits and losses significantly
Individual financial circumstances and risk tolerance vary greatly
Professional Guidance: Before making any trading decisions, consult with qualified financial advisors, conduct your own research, and ensure you fully understand the risks involved. Only trade with capital you can afford to lose.
Methodology Limitations: Volume profile analysis and technical indicators are tools for market assessment but are not infallible predictors of future price movement. Market dynamics include numerous variables that cannot be fully captured in any single analytical framework.
The views and analysis presented represent one interpretation of market data and should be considered alongside other forms of analysis and individual judgment.
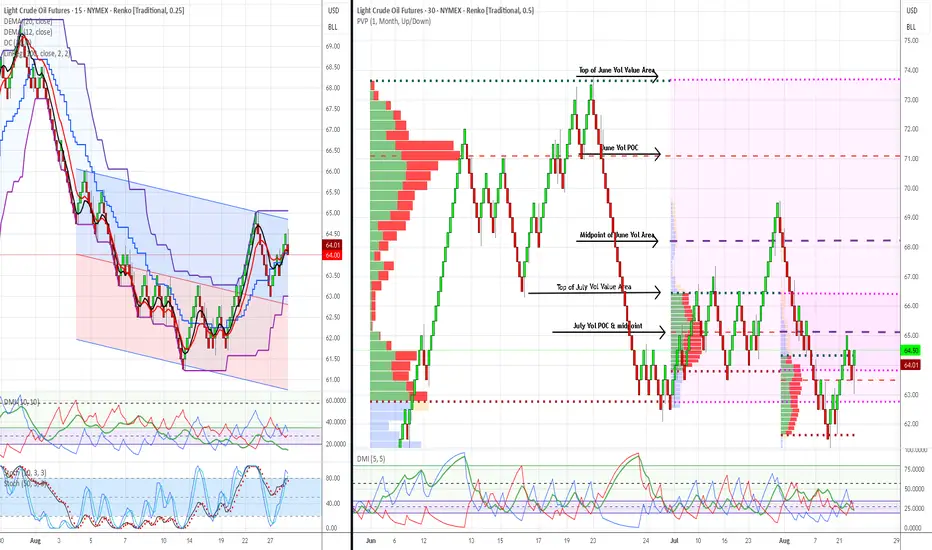
WTI Crude Oil (CL) - Technical Analysis Report - 20250908Analysis Date : September 8, 2025
Current Price : $62.25
Market Session : Pre-Market Analysis
Executive Summary
WTI Crude Oil presents a complex trading scenario with strong institutional support at current levels offset by concerning technical deterioration on the execution timeframe. The quarterly volume profile reveals massive smart money accumulation in the $62-64 zone, yet recent DEMA bearish crossover signals potential near-term weakness. This analysis provides a comprehensive framework for navigating this conflicted setup.
Quarterly Volume Profile Analysis
Institutional Positioning Intelligence
The quarterly volume profile (Q3 2025) reveals critical institutional positioning patterns that provide strategic context for all tactical decisions:
Primary Institutional Accumulation Zone: $62.00-$64.50
Massive blue volume concentration representing institutional accumulation
Heaviest volume density occurs at $62.50-$63.50 range
Current price ($62.25) sits at the lower boundary of this critical zone
Volume profile width indicates sustained institutional interest over extended period
Secondary Support Levels:
$60.50-$61.50: Moderate blue volume representing backup institutional support
$58.00-$59.00: Minimal volume suggesting limited institutional interest
Below $58.00: Complete volume void indicating institutional evacuation zone
Resistance Structure Analysis:
$65.00-$66.50: First institutional resistance zone with mixed volume
$68.00-$70.00: Heavy yellow volume indicating institutional distribution
$70.00+: Historical distribution zone from Q2 2025 peak
Price Structure Context
Historical Pattern Recognition:
The current positioning mirrors successful institutional accumulation patterns observed in previous commodity cycles. The width and intensity of the $62-64 blue volume zone suggests this represents a major strategic positioning by institutional participants, similar to the Natural Gas accumulation pattern that preceded its successful reversal.
Critical Structure Points:
Institutional Floor: $62.00 represents the absolute lower boundary of smart money positioning
Volume Point of Control: $63.25 shows peak institutional activity
Breakout Level: $64.50 marks the upper boundary requiring institutional continuation
Void Zone: $58-60 represents dangerous territory with minimal institutional backing
Execution Chart Technical Analysis
Current Technical Configuration
DEMA Analysis - CRITICAL WARNING SIGNAL:
Black Line (Fast DEMA 12): Currently at $62.25
Orange Line (Slow DEMA 20): Currently at $62.50
Configuration: Bearish crossover confirmed (black below orange)
Trend Bias: Technical momentum now bearish despite institutional support
DMI/ADX Assessment:
ADX Level: 40+ indicating strong directional movement
+DI vs -DI: -DI gaining dominance over +DI
Momentum Direction: Confirming the DEMA bearish bias
Trend Strength: High ADX suggests this technical shift has conviction
Stochastic Analysis:
Tactical Stochastic (5,3,3): Oversold territory providing potential bounce signal
Strategic Stochastic (50,3,3): Still showing bearish momentum
Divergence: Mixed signals between timeframes creating uncertainty
Support and Resistance Levels
Immediate Technical Levels:
Current Resistance: $62.75 (DEMA 20 orange line)
Key Resistance: $63.25 (institutional volume POC)
Major Resistance: $64.00 (upper institutional boundary)
Immediate Support: $61.75 (recent swing low)
Critical Support: $61.25 (institutional floor approach)
Emergency Support: $60.50 (secondary institutional zone)
Trading Scenarios and Setup Criteria
Scenario 1: Bullish Reversal Setup
Required Conditions for Long Entry:
DEMA recrossover: Black line must cross back above orange line
DMI confirmation: +DI must regain dominance over -DI
ADX maintenance: Strong directional reading above 25-30
Volume respect: Price must hold above $62.00 institutional floor
Stochastic alignment: Both tactical and strategic stochastics showing bullish divergence
Entry Protocol:
Primary Entry: $62.50-$63.00 upon DEMA bullish recrossover
Secondary Entry: $62.00-$62.25 if institutional floor holds with technical improvement
Position Sizing: 2% account risk maximum given conflicted signals
Stop Loss: Below $61.50 (institutional support violation)
Profit Targets:
Target 1: $65.00 (first institutional resistance) - Take 50% profits
Target 2: $67.00 (major resistance zone) - Take 25% profits
Target 3: $68.50-$70.00 (distribution zone) - Trail remaining 25%
Scenario 2: Bearish Breakdown Setup
Short Entry Conditions:
DEMA bearish continuation: Black line accelerating below orange line
Volume violation: Price breaking below $62.00 institutional floor
DMI confirmation: -DI expanding lead over +DI
ADX persistence: Maintaining strong directional bias
Short Setup Parameters:
Entry Range: $61.50-$61.75 on institutional support breakdown
Stop Loss: Above $62.75 (failed breakdown)
Targets: $60.00, $58.50, $57.00 (volume void zones)
Risk Management: Tight stops given counter-institutional positioning
Scenario 3: Range-Bound Consolidation
Sideways Trading Framework:
Range Definition: $62.00-$64.50 (institutional accumulation zone)
Long Zone: $62.00-$62.50 (lower boundary)
Short Zone: $63.75-$64.50 (upper boundary)
Stop Distance: 0.5-0.75 points ($500-$750 per contract)
Profit Target: Opposite range boundary
Risk Management Protocols
Position Sizing Guidelines
Conservative Approach (Recommended):
Maximum Risk: 1.5% of account (reduced from standard 2% due to technical/institutional conflict)
Contract Calculation: Account Size × 0.015 ÷ (Stop Distance × $10)
Example: $100,000 account with $0.75 stop = 200 contracts maximum
Stop Loss Hierarchy
Tactical Stop: $61.75 (execution chart support)
Strategic Stop: $61.50 (institutional boundary approach)
Emergency Stop: $60.75 (institutional floor violation)
Time-Based Risk Controls
Monitoring Requirements:
Daily: DEMA relationship and institutional level respect
4-Hour: DMI momentum shifts and ADX strength
Hourly: Stochastic divergence patterns
Exit Timeline: 10 trading days maximum if no clear resolution
Market Context and External Factors
Fundamental Considerations
Supply/Demand Dynamics:
OPEC+ production decisions impacting supply outlook
US Strategic Petroleum Reserve policies
China demand recovery prospects
Refinery maintenance season effects (September-October)
Geopolitical Factors:
Middle East tension levels affecting risk premiums
US-Iran relations impacting supply disruption concerns
Russia-Ukraine conflict ongoing effects on global energy flows
Seasonal Patterns
September-October Considerations:
End of summer driving season typically bearish for demand
Hurricane season potential for supply disruptions
Heating oil demand preparation potentially supportive
Refinery turnaround season creating temporary supply tightness
Monitoring Checklist and Alert Levels
Daily Monitoring Requirements
DEMA Status: Track black vs orange line relationship
Institutional Respect: Confirm price behavior at $62.00 floor
Volume Analysis: Monitor any changes in accumulation patterns
External Events: EIA inventory reports, Fed policy statements
Correlation Analysis: Monitor relationship with dollar strength and equity markets
Critical Alert Levels
Bullish Alerts:
DEMA bullish recrossover above $62.50
Strong bounce from $62.00 institutional floor
+DI reclaiming dominance over -DI
Break above $64.50 with volume confirmation
Bearish Alerts:
Break below $62.00 institutional floor
DEMA gap expansion (black line diverging from orange)
Volume breakdown below secondary support at $60.50
ADX above 50 with strong -DI dominance
Conclusion and Strategic Outlook
WTI Crude Oil presents a classic conflict between institutional positioning and technical momentum. The quarterly volume profile provides unambiguous evidence of major institutional accumulation at current levels, yet execution chart technical deterioration cannot be ignored. This scenario requires heightened vigilance and reduced position sizing until technical and institutional signals realign. The institutional floor at $62.00 represents the critical decision point - respect of this level with technical improvement offers exceptional risk/reward opportunities, while violation signals potential deeper correction despite smart money positioning.
Strategic Recommendation: Defensive positioning with readiness to capitalize on either directional resolution. Prioritize capital preservation while maintaining alert status for high-probability setups upon signal alignment.
Next Review: Daily assessment of DEMA configuration and institutional level respect
Document Status: Active monitoring required - conflicted signals demanding careful attention
Important Disclaimer
Risk Warning and Educational Purpose Statement
This analysis is provided for educational and informational purposes only and does not constitute financial advice, investment recommendations, or trading signals. All trading and investment decisions are solely the responsibility of the individual trader or investor.
Key Risk Considerations:
Futures trading involves substantial risk of loss and is not suitable for all investors
Past performance does not guarantee future results
Market conditions can change rapidly, invalidating any analysis
Leverage can amplify both profits and losses significantly
Individual financial circumstances and risk tolerance vary greatly
Professional Guidance: Before making any trading decisions, consult with qualified financial advisors, conduct your own research, and ensure you fully understand the risks involved. Only trade with capital you can afford to lose.
Methodology Limitations: Volume profile analysis and technical indicators are tools for market assessment but are not infallible predictors of future price movement. Market dynamics include numerous variables that cannot be fully captured in any single analytical framework.
The views and analysis presented represent one interpretation of market data and should be considered alongside other forms of analysis and individual judgment.
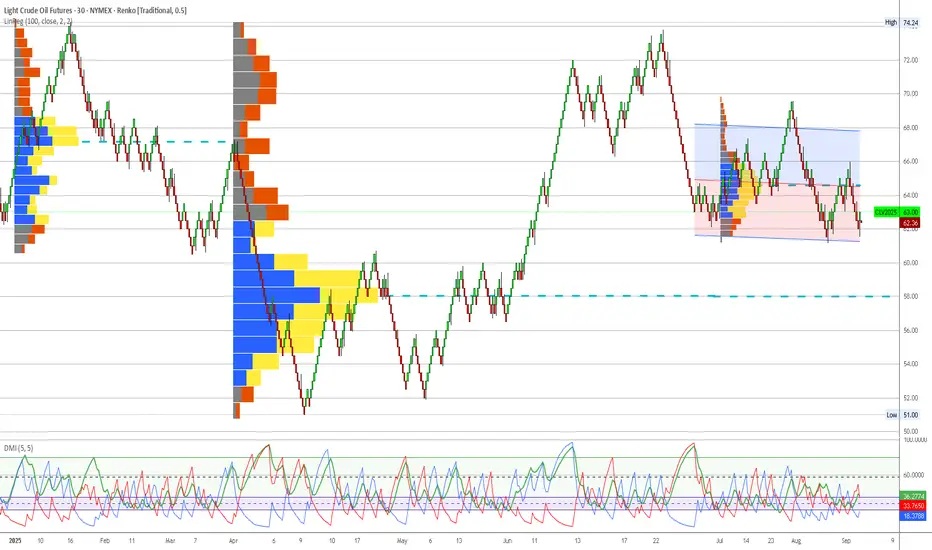
WTI Crude Oil Trading Analysis: 02-September-2025Week Ahead Plan: September 2-6, 2025
Analysis Period : August 26-30, 2025 Review | September 2-6, 2025 Outlook
Market : WTI Crude Oil Futures (CL1!)
Methodology : Dual Renko Chart System ($0.25/15min + $0.50/30min)
Current Price : $64.00 (August 30, 2025)
________________________________________
Strategic Outlook & Market Setup
Primary Scenario (70% Probability): Pullback First, Then Recovery
What to Expect : Market opens lower Tuesday ($63.00-63.50 range) due to bearish signal on short-term chart. This creates a buying opportunity if support holds.
Trading Plan:
Tuesday Opening : Expect gap down - don't panic, this was anticipated
Buy Zone : Look for entries between $62.00-63.50 (strong institutional support)
Confirmation Needed : Wait for short-term trend to flip bullish again before buying
Target : Still aiming for $66.50 but may take extra 3-5 days to get there
Secondary Scenario (25% Probability): Sideways Consolidation
What to Expect : Market trades in $63.50-64.50 range for several days while technical signals realign.
Trading Plan:
Strategy: Be patient - don't force trades in choppy conditions
Wait For: Clear breakout above $64.50 with volume
Risk: Could waste 1-2 weeks in sideways action
Low Probability Scenario (5% Probability): Immediate Continuation Up
What to Expect : Market gaps up above $64.25 and keeps rising.
Trading Plan:
Verify: Make sure both short-term and long-term signals turn bullish
Caution: Be skeptical without strong volume confirmation
Action: Can buy but use smaller position sizes until confirmed
________________________________________
Market Risk Factors & Monitoring
Critical Support Level : $62.00
Why Important: Massive institutional buying occurred here - if it breaks, the bullish case is dead
Action If Broken: Exit all long positions immediately, wait for new setup
Probability of Break: Low (15%) but must be respected
Key Events This Week :
Tuesday: ISM Services data (economic health indicator)
Wednesday: Weekly oil inventory report (could cause volatility)
Friday: Jobs report (affects overall market sentiment)
Warning Signs to Watch:
Technical: Short-term trend staying bearish for more than 3 days
Volume: Declining volume on any bounce attempts
Support: Any trading below $62.50 for extended periods
Time: No progress toward $66.50 target within 10 total trading days
Positive Signs to Look For :
Technical: Short-term trend flipping back to bullish (key confirmation)
Volume: Above-average volume on any recovery moves
Support: Strong buying interest at $62-63 zone
Momentum: Clean breakout above $64.50 with follow-through
________________________________________
Forward-Looking Adjustments
Modified Risk Management :
Position Size: Use 50% of normal position size until both timeframes align bullish
Stop Loss: Tighter stops at $62.75 (just below support zone)
Entry Patience: Don't chase - wait for pullback to support levels
Profit Taking: Be more aggressive taking profits at first target ($66.50)
Revised Entry Strategy:
Before Buying, Confirm ALL Three:
Price: Trading at or near $62-63 support zone
Technical: Short-term trend signal flips back to bullish
Volume: Above-average buying interest visible
Timeline Expectations :
Days 1-3: Expect pullback/consolidation phase
Days 4-5: Look for bullish confirmation signals
Days 6-10: Resume advance toward $66.50 target if signals align
Beyond Day 10: If no progress, reassess entire strategy
Success Metrics:
Minimum Goal: Protect capital during pullback phase
Primary Target: $66.50 within 2 weeks (revised from 1 week)
Risk Limit: Maximum 2% account loss if support fails
Time Limit: Exit strategy if no directional progress within 10 days total
Simplified Decision Framework :
Green Light to Buy: Price near $62-63 + Short-term trend bullish + Good volume Yellow Light (Wait): Mixed signals, choppy price action, low volume
Red Light (Exit): Price below $62, bearish trend continuing, time limit exceeded
________________________________________
Bottom Line : The bigger picture remains bullish, but short-term signals suggest a pullback first. Use any weakness to $62-63 as a buying opportunity, but only with proper confirmation. Be patient - the setup is still valid but timing may be delayed by a few days.
________________________________________
Document Classification : Trading Analysis
Next Update : September 6, 2025 (Weekly Review)
Risk Level : Moderate (controlled institutional setup)
This analysis represents continued validation of a systematic, institutional-grade trading methodology with demonstrated predictive accuracy and risk control capabilities. This is a view that represents possible scenarios but ultimate responsibility is with each individual trader.
Risk Disclaimer: Past performance does not guarantee future results. All trading involves risk of loss.
Crypto Trading 101: Scalping Trends With DEMAHi hoppers, today we are looking at a scalping strategy that involves scalping trends by combining the DEMA with the ADX. First, let’s break down the Double Exponential Moving Average (DEMA).
Double Exponential Moving Average
To understand the Double Exponential Moving Average, lets first explore the “Exponential Moving Average”. The Exponential Moving Average (EMA) is one of the most frequently used indicators in the crypto sphere. The EMA is a trend-following indicator that is used to identify the direction of a trend. The EMA reacts quicker than the Simple Moving Average to price changes because the EMA gives greater weight to the latest closing prices. The DEMA reacts faster than the EMA by giving even more weight to recent closing prices.
We can use the DEMA on the 15 minutes chart to identify solid entry points. Keep in mind, the DEMA has the same weakness as all trend-following indicators: ranging markets. When the market is ranging, the DEMA will keep opening up new positions. Therefore, it is critical to use another indicator to identify when the market is trending, and when it is not.
Now let’s take a look at how to use the ADX to improve the profitability of the DEMA.
Average Directional Index (ADX)
The ADX is a volatility indicator that measures the strength of a trend. When the ADX is above 25, we can infer that the market is in a strong trend. This can be seen on the graph when the white line crosses above the black line, and the green cloud is active. You can see this better if you click on “Maximize the chart”. We have chosen to run the ADX on the 4-hour chart as the indicator tends to be more reliable on the longer timeframes.
For our exit strategy, we have not chosen any indicator. Instead, we have decided to exit based on our usual scalping settings:
Take profit 7%
Stop-loss 1%
Trailing stop loss percentage 1%
Arm trailing stop loss 1.5%
You can see the positions opened by the strategy better if you click on “Maximize chart”.
Have a great trading week ahead, and we will catch you on the next one!
—CRYPTOHOPPER—
