Trend is your Friend. #NKE is a prime example...fade the bullish moves
look for continuation down
that is going to be the money maker
shorting into resistance
not longing on reversals
DOW

DOW JONES in synch with the USD to start a massive correction.Dow Jones (DJI) has been trading within a 17-year Channel Up ever since the bottom of the 2008 U.S. Housing Crisis. This is not the first time we give you this pattern, so I won't be getting into too much detail on its specifics.
What we do combine it with for the first time though, is the DXY (black trend-line), which has also been trading within a Channel Up since 2008, a direct consequence of the monetary policies that were applied globally by central banks to save the system following that credit-shock event.
What this cross symbol comparison offers, is give a clear unbiased illustration of the patterns and correlation involved between the stock market and DXY (U.S. Dollar Index). Most times that the DXY bottoms (green circles), Dow peaks its Bull Cycle and starts a correction (Bear Cycle, as shown in red). All of Dow's Bear Cycles have either pulled back to the 0.382 Fibonacci retracement level or the 1W MA200 (orange trend-line) or even both.
As a result, we estimate Dow to target 40000 by the time one of the above takes place, which can coincide with the DXY hitting the top of its inner Channel Down, similar to what it did during the previous two such smaller patterns within the main 17-year Channel Up.
---
** Please LIKE 👍, FOLLOW ✅, SHARE 🙌 and COMMENT ✍ if you enjoy this idea! Also share your ideas and charts in the comments section below! This is best way to keep it relevant, support us, keep the content here free and allow the idea to reach as many people as possible. **
---
💸💸💸💸💸💸
👇 👇 👇 👇 👇 👇

DowJones US30📊 $DowJones ( CAPITALCOM:US30 ) Technical Analysis (4H Timeframe)
The overall trend for the Dow Jones remains bullish, as the price continues to form a structure of higher highs and higher lows 📈. The index is trading well above the upward-sloping EMA 200 (black line), which serves as the primary trend confirmation. While the price recently experienced a minor correction (Wave 5), it found immediate support at the EMA 50 (red line), which is currently trending upwards and acting as dynamic support. The momentum is characterized by strong bullish candle bodies during the impulsive phases, indicating high demand. As long as the price sustains its position above the 48,800.0 USD structural support, the path of least resistance remains to the upside 🚀.
🔑 Key Levels to Watch:
Major Upside Target: 50,150.0 USD (Psychological Resistance) 🚩
Intermediate Target: 49,400.0 USD (Recent Peak) 🎯
Immediate Support: 48,800.0 USD (Grey Box / Flip Zone) 💡
Dynamic Support: 48,256.0 USD (EMA 50 Area) ⚡
Structural Support: 47,820.0 USD & 47,323.6 USD (Grey Box / EMA 200) 🛡️
Primary Demand Origin: 46,870.0 USD & 45,420.0 USD (Major Grey Boxes) 🏗️

DOW JONES Strongest sell signal in 2 months.Last week (see chart below) we gave a buy signal on Dow Jones (DJI), which easily hit our 48650 short-term Target, as the price found support inside a tight Triangle pattern:
This time, a strong sell opportunity is emerging (in fact strongest in two months) as we move to the longer 1D time-frame, where Dow has been trading within an 8-month Channel Up that is very close to its top (Higher Highs trend-line).
The 1D RSI however is already touching its multi-month Resistance Zone, which makes it a prime Sell Signal already as the last time it was there was almost 2 months ago (November 12 2025). What followed this was a strong -5.59% technical pull-back that found support exactly on the 1D MA100 (green trend-line) at the bottom of the Channel Up.
Basically, the current Bullish Leg has also just completed a +8.59 rise, which is the most a Bullish Leg has grown within this pattern. And since a -4.00% correction has been the usual decline on all corrections also, we expect Dow to hit the 47900 - 47600 Target Zone, consisting of the 1D MA50 (blue trend-line) and 1D MA100 respectively, with Support 1 in between.
Keep an eye also on the 1D RSI Support Zone. If it gets hit before any of those targets, it will be a good idea to take the profit on the shorts then, regardless of the price.
---
** Please LIKE 👍, FOLLOW ✅, SHARE 🙌 and COMMENT ✍ if you enjoy this idea! Also share your ideas and charts in the comments section below! This is best way to keep it relevant, support us, keep the content here free and allow the idea to reach as many people as possible. **
---
💸💸💸💸💸💸
👇 👇 👇 👇 👇 👇

DJIA: Major Formation About to Breakout!Hello There,
welcome to my new analysis about the Dow Jones Industrial Average Index (DJIA). The index recently came through with some important developments that caught my attention. Especially, the bullish build-up should not be underestimated here. Currently, the index has already completed a main formation, which is setting up the path for further price action upcoming. In my analysis I detected the most important signs to consider for the upcoming price action.
As when looking at my chart, we can see there that the DJIA is trading within this major ascending channel formation. Within this formation, the Dow Jones already bounced several times within the lower boundary. These signs are really bullish and point to a continuation of the bullishness and a major breakout just about to set up. Currently the index is already penetrating the upper boundary of the ascending channel, marking a structure from which a breakout is likely.
The most important part within this whole structure is the inverse head and shoulder formation. Within this formation, the left shoulder and the head were already formed. Now the index is about to complete the right shoulder of the whole formation. Once the breakout happens and the index stabilizes above the neckline, the whole formation will be completed. Once this major breakout happens, the target zones as seen in my chart will be activated.
What should not be underestimated here also is that a majority of analyst recommendations point in the bullish buy direction. Therefore, the index is currently considered as a strong buy candidate. Also, there are many major industry developments that support further bullish price action within the next times. Especially when the index attracts more industry leverage from major firms moving into the market, this will also confirm the breakout from a fundamental perspective.
Right now, we will watch out for the major confirmational price actions to set up within the upcoming times. Especially when a strong breakout happens, this will confirm the next steps within the structure. Currently, there are not many signs of invalidation. However, when the index falls below the 48600 level, this will firstly invalidate the bullish continuation. If this happens, further assumptions need to be made.
With this being said, it is great to consider the important trades upcoming.
We will watch out for the main market evolutions.
Thank you very much for watching!

DOW JONES Triangle started a Bullish Leg.Dow Jones (DJI) has been trading within a Triangle pattern on the short-term, with the price making a Higher Low on Wednesday on its bottom. With the 4H RSI rebounding just after it breached below the 30.00 oversold barrier, we expect the pattern to start its new Bullish Leg now.
A +1.30% rise to test its top (Lower Highs trend-line), would still be a minimum based on all the Bullish Legs that preceded. As a result, our short-term Target (unless the 4H MA50 rejects the uptrend) is 48650.
---
** Please LIKE 👍, FOLLOW ✅, SHARE 🙌 and COMMENT ✍ if you enjoy this idea! Also share your ideas and charts in the comments section below! This is best way to keep it relevant, support us, keep the content here free and allow the idea to reach as many people as possible. **
---
💸💸💸💸💸💸
👇 👇 👇 👇 👇 👇

GCILGCIL (PSX) – Bullish Continuation Setup 🚀
Fundamental Positives (Recent Quarter) 📊
✅ Earnings Growth: Latest quarterly results showed improved EPS, reflecting better operational performance 💰
✅ Margin Improvement: Gross & operating margins expanded due to better cost control and stable sales mix 📈
✅ Lower Financial Pressure: Finance cost remained controlled, supporting net profitability and cash flows 🏦
Technical View 🔍
📈 Healthy Retracement: Stock completed a controlled pullback from previous top and respected key support
🔼 Higher Highs Structure: Price action is now forming Higher Highs (HHs) & Higher Lows (HLs) clear bullish trend continuation
🔥 Momentum Shift: Buyers stepping in with strength, indicating potential breakout toward new High
Conclusion 🎯
GCIL is showing strong confluence of fundamentals + price action. As long as the HH–HL structure holds, bias remains bullish for upside continuation 🚀

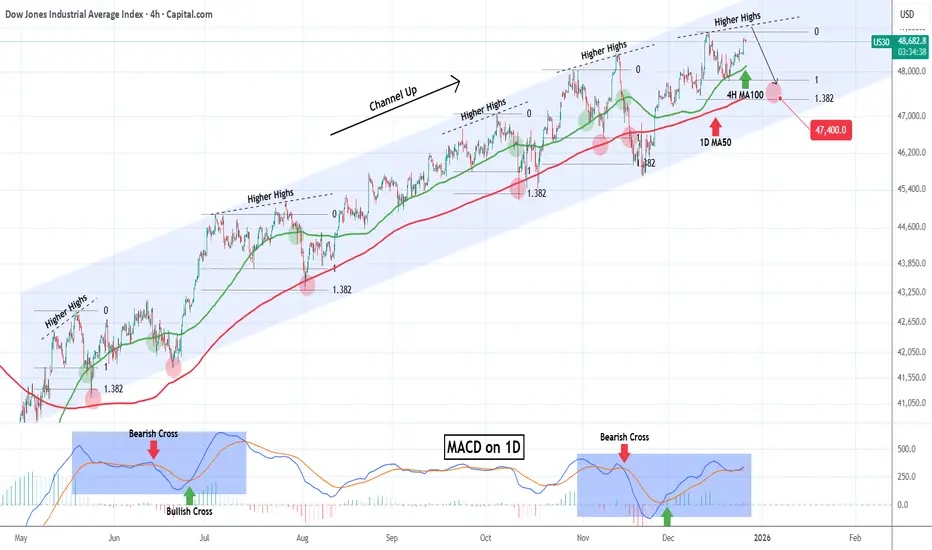
DOW JONES headed towards a rejection.Dow Jones (DJI) has been trading within a nearly 8-month Channel Up and is close to its All Time High (ATH) after rebounding last week on its 4H MA100 (green trend-line).
This pattern is cyclical and every time the latter support broke after a medium-term rally from its 1D MA50 (blue trend-line), the index got rejected on a Higher Highs trend-line and corrected back to the 1D MA50. Even the 1D MACD is printing a sequence similar to June - July.
As a result, we expect the new year to find Dow on its 1.382 Fibonacci extension at 47400 at least, which is the Fib level that every such correction pulled back to.
---
** Please LIKE 👍, FOLLOW ✅, SHARE 🙌 and COMMENT ✍ if you enjoy this idea! Also share your ideas and charts in the comments section below! This is best way to keep it relevant, support us, keep the content here free and allow the idea to reach as many people as possible. **
---
💸💸💸💸💸💸
👇 👇 👇 👇 👇 👇
US30 | Bullish Above 48020, Eyeing Break of 48420US30 | Technical Overview
US30 maintains a bullish momentum as long as the price trades above the pivot zone between 48020 and 47860.
For now:
The index is likely to retest 48420. A confirmed 1H candle close above 48420 would signal continuation of the bullish trend toward 48680 and 48850.
However, if the price fails to break above 48420, a correctional movement back toward 48020 may occur.
Key Levels
Pivot Line: 48260
Resistance: 48420, 48670, 48850
Support: 48020, 47860
Bias: Bullish above 48020; corrective below 48420.

US30 | Bullish Above Pivot Zone 48020–47860US30 | Technical Overview
US30 is stabilizing above the pivot zone between 48020 and 47860, which keeps the bullish structure active.
As long as the price trades above this zone, the index is expected to continue its upward movement toward 48260 and 48410.
For a bearish reversal, the market must break below 47860.
A confirmed break would open the way for a decline toward 47560 – 47460.
Key Levels
Pivot Line: 48020
Support: 47860, 47560
Resistance: 48250, 48410
Bias: Bullish above pivot; bearish only below 47860.

DOW JONES Multi-month Bear Cycle to 40000 starting.Dow Jones (DJI) has been trading within a 16-year Channel Up since the 2008 Housing Crisis and approximately every 3.5 years (44 months) it tops and starts a technical correction/ Bearish Leg.
All of those Bear Cycles essentially since October 2011 have eventually pulled-back to the 1M MA50 (blue trend-line) at roughly he 0.382 Fibonacci retracement level. Only once time the 1M MA50 broke significantly and that was in March 2020 during the COVID flash crash, which eventually found Support on the 1M MA100 (green trend-line).
As a result, we expect Dow to start its Bear Cycle in 2026. From the current high the 0.382 Fib stands at exactly 40000, which based on its trajectory is where the 1M MA50 is headed by Q3 2026.
---
** Please LIKE 👍, FOLLOW ✅, SHARE 🙌 and COMMENT ✍ if you enjoy this idea! Also share your ideas and charts in the comments section below! This is best way to keep it relevant, support us, keep the content here free and allow the idea to reach as many people as possible. **
---
💸💸💸💸💸💸
👇 👇 👇 👇 👇 👇

HINOON📊 HINOON (PSX) – Daily & Weekly Technical Setup
HINOON has made a fresh all-time high and is now retracing to the 0.5 Fibonacci level, forming a textbook continuation setup for HHHL (Higher High, Higher Low) structure 📈
🔹 Daily & Weekly trend: Bullish
🔹 Retracement: 0.5 Fib – healthy pullback
🔹 Structure: Trend intact, continuation likely
🎯 Targets:
TP1 – as marked on the chart
TP2 – as marked on the chart
🛡️ Risk Management:
Strict stop-loss below invalidation
Maintain favorable risk-to-reward
🧩 Fundamental Verdict (Strong Support) 💊
HINOON is fundamentally a strong pharmaceutical company in Pakistan:
✅ Consistent growth in revenue & profit
✅ Attractive margins vs industry peers
✅ Solid dividend history
✅ Ongoing export expansion
📌 Conclusion:
Technical continuation + strong fundamentals = high-probability setup
➡ Trade with discipline, not emotions.

FCSC First Capital Securities Corporation LtdFCSC First Capital Securities Corporation Ltd 1D PSX
TECH: Price already retraced to our buy zone 0.6.18 and should move up to make new high.
FUNDAMENTALS
Growth: ⭐⭐⭐⭐⭐
Stability: ⭐⭐⭐⭐☆
Cashflows: ⭐⭐⭐⭐⭐
Valuation: ⭐⭐⭐⭐⭐
6️⃣ YoY & QoQ Check
YoY
✔ Revenue ↑
✔ Operating Profit ↑
✔ EPS ↑
✔ Cash Flows ↑
✔ Balance sheet strength ↑
→ Very positive turnaround
QoQ (From Q3 to Q4)
Quarterly EPS improved
Revenue slightly stable
Costs controlled
→ Neutral to slight positive
9️⃣ Final Verdict
FCSC is a strong BUY both for:
✔ Long-term investors (Value Investing)
and
✔ Swing Traders (Technical + Momentum)
It qualifies as a classic value stock with momentum building.

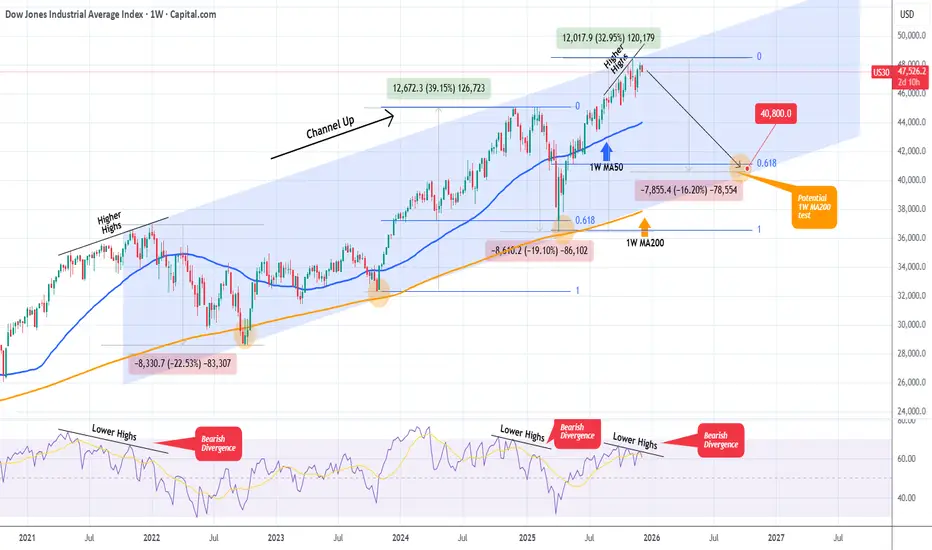
DOW JONES Is it starting a new Bear Cycle towards 40800?Dow Jones (DJI) has been trading within a 4-year Channel Up since the start of the 2022 Inflation Crisis. One month ago it hit the top of this pattern and hasn't made a new High since.
This is increasingly alarming as the 1W RSI is on a Bearish Divergence under Lower Highs against the market's Higher Highs. Every time this took place within this pattern, the index corrected heavily and attempted a 1W MA200 (orange trend-line) test.
As a result, if Dow fails to make a new High, we expect the bearish sentiment to intensify and start a new Bear Cycle (Bearish Leg for the Channel Up) towards its 1W MA200 and the 0.618 Fibonacci retracement level, which was the Target of the previous correction. Based on that it is possible for the index to hit 40800 at the bottom of the Channel Up.
---
** Please LIKE 👍, FOLLOW ✅, SHARE 🙌 and COMMENT ✍ if you enjoy this idea! Also share your ideas and charts in the comments section below! This is best way to keep it relevant, support us, keep the content here free and allow the idea to reach as many people as possible. **
---
💸💸💸💸💸💸
👇 👇 👇 👇 👇 👇
$YM Long the pullback.In the Dow today, we're coming off yestserday's fresh breakout to the upside, which makes us bullish for today.
We're simply waiting for a pullback on the 30 minute chart. We want a touch of the Weekly VWAP +1 standard deviation. Stop loss just above Weekly-VWAP.
Manage your risk and wait for the real pullback! Happy trading.

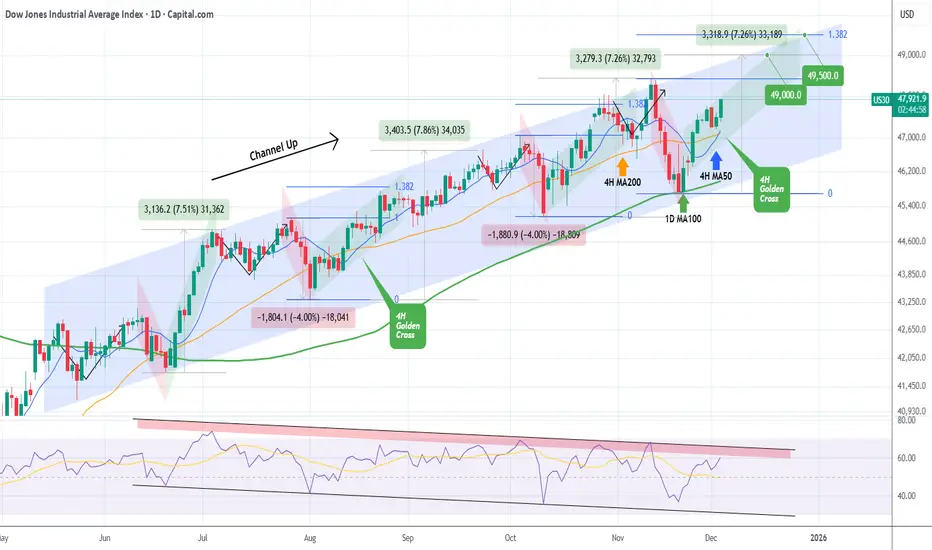
DOW JONES formed its first 4H Golden Cross since August. BullishDow Jones (DJI) has been trading within a 6-month Channel Up and today it formed its first 4H Golden Cross since August 15. Coming off a Higher Low bottom 2 weeks ago on the 1D MA100 (green trend-line), we are currently on the new Bullish Leg of the pattern.
The last one rose by +7.26%, roughly the % amount of the previous two as well, so our immediate Target remains 49000 as we've shown on last weeks analysis.
This time we also see an over-extended Target if the end-of-year rally lasts a bit longer, on the 1.382 Fibonacci extension at 49500, as this level has been hit on every Bullish Leg of this pattern.
If the 1D RSI though hits its Lower Highs Zone (red) earlier, it might be a good idea technically to book profits before those Targets are reached.
---
** Please LIKE 👍, FOLLOW ✅, SHARE 🙌 and COMMENT ✍ if you enjoy this idea! Also share your ideas and charts in the comments section below! This is best way to keep it relevant, support us, keep the content here free and allow the idea to reach as many people as possible. **
---
💸💸💸💸💸💸
👇 👇 👇 👇 👇 👇
DXY EXTREME BEARISH DIVERGENCE > ABOUT TO COME STRAIGHT DOWN!DXY Has been on a tear but I think thats about to end and I think it will end very quickly. There is multiple very strong bearish divergences on the weekly, across multiple indicators showing that a major move down is coming. I think we have reached the top for the DXY for a while and its about to tank. Dont know whats around the corner as far as news but something big is about to come out thats going to kill the DXY. This is not trading or financial advice this is just my opinion. If you apprecaite my work please consider giving this chart a boost and follow me for more updates. Thank you and good luck my friends.

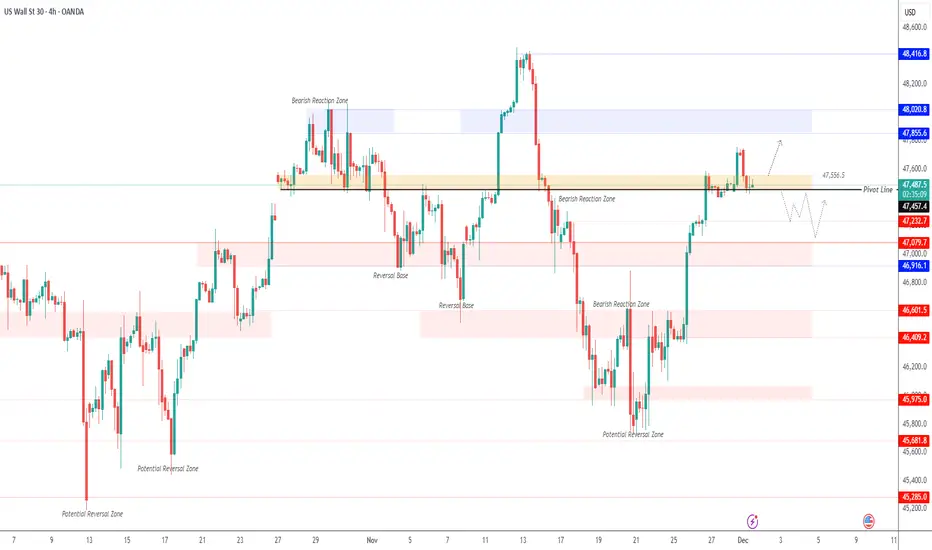
US30 | Breakout Confirmation RequiredUS30 – Technical Overview
US30 is currently consolidating between 47450 and 47560, awaiting a clear breakout to define the next direction.
A 1H or 4H close below 47450 will confirm bearish momentum, opening the way toward 47240 and then 47080.
However, a 1H — and especially a 4H — close above 47560 will signal continuation of the bullish trend toward 47850 and 48000.
Pivot Line: 47450
Support Levels: 47230 · 47080
Resistance Levels: 47700 · 47860
$YM | Get long the pullback!Today we go through plans in $YM. After a large bull day, it's not the best day to trade as the market often needs a 'day of rest'. However, we were able to dig into our tools and come up with a solid plan to potentially get long.
Hopefully you can learn something from this video about how to make plans admit the chaos of the market.

DOW JONES Inverse Head and Shoulders formed. Bullish.Last week (November 19, see chart below), we caught the very bottom of the 6-month Channel Up on the 1D MA100 (green trend-line) of Dow Jones (DJI):
This time we view the price action using the 4H time-frame, where we can see that an Inverse Head and Shoulders has been formed, with its Head being the 1D MA100 bottom.
If more aggressive, it may not follow the typical green Bullish Leg of the Channel Up but the Target remains almost the same at 48900. That is the 2.0 Fibonacci extension. Typically we should see the 4H MA50 (blue trend-line) turning into the Support until the very top.
---
** Please LIKE 👍, FOLLOW ✅, SHARE 🙌 and COMMENT ✍ if you enjoy this idea! Also share your ideas and charts in the comments section below! This is best way to keep it relevant, support us, keep the content here free and allow the idea to reach as many people as possible. **
---
💸💸💸💸💸💸
👇 👇 👇 👇 👇 👇

ZOETIS: Care for our pets and a potential good investmentZoetis Inc. is a leading animal health company that displays a strong financial position and significant growth opportunities. Despite a recent 30% stock price decline over the past 12 months, the company appears well-positioned for a meaningful recovery.
Zoetis' fundamentals are impressive, with EBITDA margins of 42.5%, profit margins of 28.2%, and $2.16 billion in free cash flow. This demonstrates the company's ability to generate robust cash flows and profitability. Additionally, its 49.9% ROE indicates efficient capital allocation. The company trades at a N/A P/E, suggesting the market is not fully capitalizing on its valuation potential.
The external context also supports the investment thesis. The animal health industry is experiencing sustained growth driven by demographic trends and increasing pet ownership. Furthermore, Zoetis has demonstrated strong strategic execution, launching new products and expanding its global presence.
The price has dropped to a strong support region, to about half it's maximum price on 2022. It is a cheap entry price for a company with excellent financial fundamentals.
With an average analyst price target of $169.96, implying a 39% upside potential.
My stock fundamentals recommender model (zignolz.com) gave it a strong confidence score: 81/100.
Zoetis appears to be an attractive recovery opportunity for long-term investors.

The us30-dow jones could have a drop.Dow Jones could experience a drop at the specified price, so look for confirmation according to the drawn schematic, and you could make a nice trade.
Make sure to get confirmation.
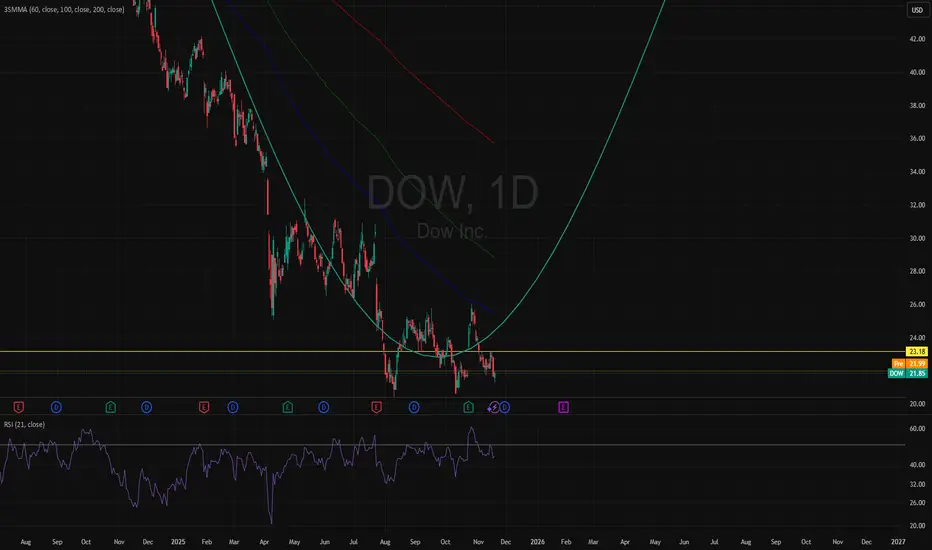
The BUY Signal looks stong with this one.NYSE:DOW
Using Sinewave Analysis, 3SMA, and RSI
I have noticed at the bottom of a 5 year low, a divergence as well higher high and lower low in attempts to break the SMA.