DOW30 SHORT MONTHLY CHARTMany tools show me that price can easily now going to retest the trendline and even break it to the downside.
Dow30

Dow Jones: Bearish divergence on RSI.DJI managed to recover the drop that (marginally) broke the 1D Channel Up resuming the bullish technical action (RSI = 64.012, MACD = 186.600, ADX = 46.489, Highs/Lows = 130.1071). The RSI on the 1D chart is on a bearish divergence though and the last two times that happened the index dropped -3.20% and 5.13%. If the current bearish divergence follows the same patterns then we are looking at two downside targets: 27,965 and 27,400.
** If you like our free content follow our profile (www.tradingview.com) to get more daily ideas. **
Comments and likes are greatly appreciated.

DOW CHRISTMAS DISCOUNT INCOMINGWe're rising on a descending volume, exhaustion is real. Simple trade

DJIA Struggle to Stay Above 28,000 It didn’t take long for the major indices to get back to all-time highs, as they began this shortened holiday week with a solid rally on hopes for a trade deal. The prospect of renewed economic growth and favorable monetary policy have also played some roles for the rally.
Overnight, DOW rose 0.68%, but lagged comparing it with S&P 500 and NASDAQ. Obviously, the market will continue reacting to whatever the current trade headline is - bad or good - with the relevant price action.
The H4 RSI indicator is going to test the 70% area now. This could imply an aggressive profit-taking activity for the coming sessions. The inability to keep above 28,000 will be the first sign of selling pressure. Taking out 27,675 will indicate the selling pressure is getting stronger. The next support in that case will be the 50-day SMA on 4-hour chart which has risen to 27,489.
On upside, the index seems ready to re-test the record high at 28,090. A clear break above it could extend the bullish pressure towards the upper line of daily Bollinger Bands at 28,237.
Take in mind, that the trading activity will decline in the coming days because Thanksgiving Day, and of course the market is closed on Thursday and closes early on Friday.

Dow Jones: Sell opportunity. Potential Double Top.DJI has extended the 1W Channel Up (RSI = 65.157, MACD = 519.030, Highs/Lows = 742.8189) that has previously provided a handful of trading opportunities (see bottom of the analysis).
At the moment a Double Top is being formed on 1D, which since April has been a bearish signal, later initiating a decline towards the Higher Low zone (where the 1D MA200 always supported).
We are expecting a similar behavior especially since the current levels are nearly overbought on 1D (RSI = 69.814). Our Target Zone is 27,000 - 26,800.
See the previous successful signals within this pattern below:
** If you like our free content follow our profile (www.tradingview.com) to get more daily ideas. **
Comments and likes are greatly appreciated.


Its time to care about recession and reality, even if we don't..Time to send the market into south direction. Why?
1) Recession marks in world Economy
2) No Trade Deal China - US
3) Massive overbought divergence H4-D1
4) Earnings Q4 2019 are low fitted
5) Markets bubbling up
Target 1: 26.350
Target 2: 25.640
Time Nov-Dez 2019

DOW (DJI) rejected at 27K again, market topping outThe winter is coming. As everyone can see the index is failing at making higher highs, the dips are shallow, but the conviction is not there, there is just no room to rally. We reached the TOP. RSI showing weakness in the bull market.
Expecting a correction to around 25300, then a low volume rally to retest some of the former highs, and then, the long awaited freefall in early 2020.
This is the last time we are seeing Dow above 200-day MA for a long time, once it breaks down it won't get above it swiftly. The bear season begins with the daily close below 200 day MA or a flash crash we can't foresee atm.
Whoever longs this after such an overextended bullmarket cycle is just delusional.
A marginal higher high to stop out everyone already shorting and then a crash is a possibility as well, although I wouldn't bet on it.
It seems like everyone hopes they can sell to somebody else once the panic kicks in.
The thing is, the theatre is getting more and more crowded... yet the exit door stay the same.

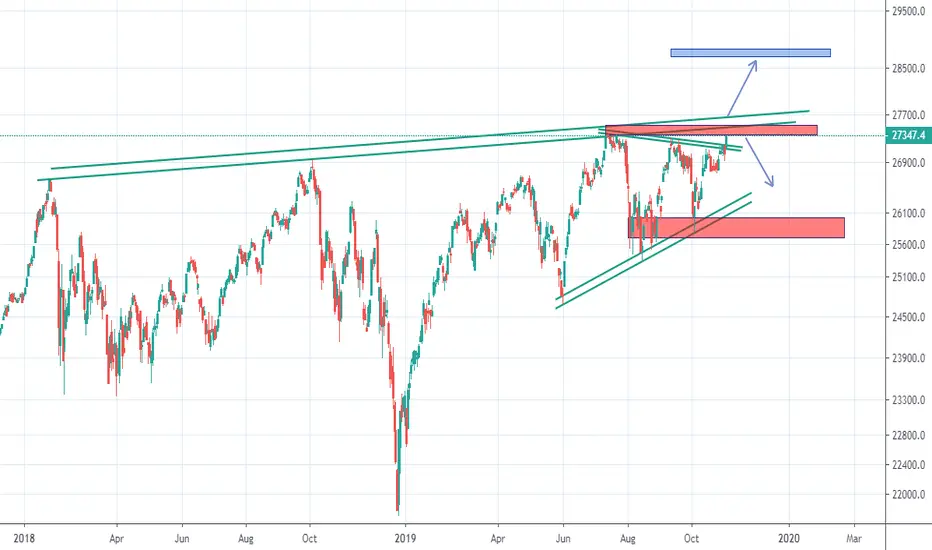
Dow Jones: 5H Golden Cross points to one last High.DJI has been trading inside a 1W Ascending Triangle (RSI = 55.808, MACD = 272.600) since June and is now approaching the 1W Resistance. Currently the Golden Cross formation is emerging on the 5H chart and based on the last 3 times that pattern printed, the price made at least one more High.
In January 2019 it made another three Higher Highs, in June again three and in September one. That leads us to expect at least one more High which could be lower than the 1W Resistance as since July each High is slightly lower than the previous on the 1W time frame. As a result our target for this is 27,250. If the index breaks below this week's bottom then the pattern is invalidated and you should be ready to close your position.
** If you like our free content follow our profile (www.tradingview.com) to get more daily ideas. **
Comments and likes are greatly appreciated.

UTX in Long-Term Trading RangeAlthough many Dow 30 components had a severe sell-down in December 2018, most have not gone up further than the previous highs. UTX is such a stock. It has now officially been range-bound for over a year, as it was range-bound before the December collapse.

Dow Jones: Channel Up turned into a Triangle.Dow Jones is extending the rebound on the Higher Low made yesterday on the 1W Channel Up (RSI = 51.067, MACD = 249.310, Highs/Lows = 0.0000) after the Nonfarm Payrolls missed the forecast today. This fundamentally bullish for the stock index (Fed and rate cut outlook).
Technically the 1W Channel Up failed to make a Higher High last month so the medium term overlay can turn into a Triangle. Thus we revise our target on a Lower High at 27,200.
** If you like our free content follow our profile (www.tradingview.com) to get more daily ideas. **
Comments and likes are greatly appreciated.

Possible turning pointWe have a possible demand-zone here. Wait for confirmation before buying.
Look at the gold-chart for confirmation as well. Gold and Dow have some correlation --> which means that if gold shows weakness, Dow will probably rise.

The Big Short (DOW30)When will the biggest bubble in the history of humanity go down?
Did The Human race really learn out of history or were they just making it worse and worse?
How much power is left to push more to the upside.

US30 dips continue to attract buyersOANDA:US30USD
Trade Idea
DOW30 - Intraday - We look to Buy at 27200 (stop at 27100)
Price action resulted in a new all-time high at 27403. A Morning Star formation has been posted at the low. The continuation higher in prices through resistance has been impressive with strong momentum and shows no signs of slowing. A bullish hammer has been posted as prices reject the lower levels. Further upside is expected although we prefer to set longs at our bespoke support levels at 27200, resulting in improved risk/reward.
Our profit targets will be 27400 and 27500
Resistance: 27403 / 27500 / 27625
Support: 27200 / 27000 / 26850

US30 - Indices Trading | Elliott Wave Structures | Q2 2019*Please support this idea with a LIKE if it helps you. Thanks!
More details about me in my signature.
US30USD - Elliott Wave Outlook
Bearish Swings - Patterns:
Flat Formation in Super-Cycle Wave (IV) (green)
Primary A (red) - Simple ABC Swing
Primary B (red) - Running Flat
Primary C (red) - Bearish Extension
Bullish Swings - Patterns:
Leading Diagonal in Primary 1 (pink)
ABC Swings in Intermediate degrees (1)(2)(3)(4)(5) (blue)
Next expected swing:
Bearish sequence in Primary (2) (pink)
Structure change:
Breach of the lower trend-line could lead towards Primary (2) (pink) already unfolding.

Home Depot: Domestic Consumer Retail EarningsI don't usually play earnings roulette, but I was willing to with HD. They're a US domestic consumer goods retailer, and they're going to be the recipient of goods more favorably prices for domestic consumption than international trade.
The technicals look good, they've been growing earnings consistently, and membership on the DOW30 does favor them for having a solid and reproducible formula for success.
Also, this could go completely the other direction, but they're so large that it's going to drive tomorrow's market direction overall whichever way it goes.

UNH: DOW30 Healthcare Value ReboundI've been researching stocks in the healthcare sector recently, and it seems that the places to put your money are into healthcare operators, hospital services, and medical facility REITs. United Healthcare got beaten down with the rest of the healthcare sector in late April. However, they rebounded in the other direction after their earnings call. I've been watching them to wait for a stronger trend to set in, and I believe the time is now. Volume spiked on earnings and has remained relatively flat since, so neither a drop or spike in volume is a good side that the buyers are holding and the sellers are having to be bid up to let go of their shares.
As for technicals, the price just popped above the 50 day moving average and the 20 day moving average shows a clear bottoming out and converging to overtake the 50 day. MACD has been weakly bullish in the histogram but just crossed positive, and this is confirmed with the holders sentient sloping upward and going positive. For trendedness, ADX is 17 showing that the old trend is long dead but a new one is still shaping up, but DI+ diverging from ADX and DI- shows that a new uptrend is brewing. RSI is sloping upward with the Friday and Monday above 50, so prices are out of oversold territory and rebounding but not yet oversold. Money flow continues to be positive, and the short interest is idling along showing that there's not a lot of confidence in betting against the stock.
Beyond the technicals, UNH is in a good position to weather this current bout of the trade war. They're primarily a domestic healthcare provider and operator, and they're going to benefit from the falling price in goods rather than be hurt by it. Demand for healthcare is fairly inelastic, and investors are going to seek shelter in service providers of various types with low risk exposure to selling goods or dealing with rising prices from import/export dynamics.

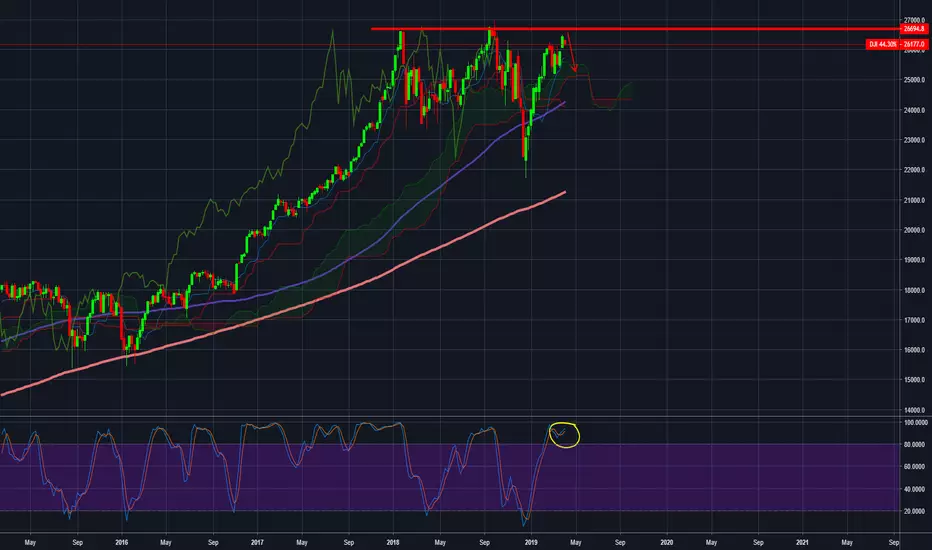
#Dow 30 How much would he fall?Although we are on an uptrend, the Dow Jones is currently facing serious weekly resistance at 26694, we believe it is on the way to making a price correction, The Stochastic indicator confirming what we thought as is in the upper term range that could mark a reversal of the trend (Last September when the stochastic was at these levels the Dow fell by 19 percent)
Sell DOW 30:
Entry price: 26186
Take profit: 25180
Stop loss: 26700
Dow Jones Futures, shortterm Bullish Bat (potentially)Long 26120 Executed, SL 26090, target: 26270, watch 26220 retreat to move SL to BE or maybe book some profits.
Next: Short 26270 with 2630x SL target the wave fibo levels of it gets there and price actions show rejections around 26270-26300 zone.
Trade at your own risk! Don’t trade money you cannot afford to lose. Trade safely.


The rebound is very strong. But it is starting to fall.The first ABC will happen. Second uncertainty

Microsoft Analysisjust randomly searched up Microsoft on the chart and this jumped out at me straight away..
with price at these levels in supply im looking at a weak MSFT even bearish the whole market.
