DOW JONES invalidating bearish patterns, targeting 34000 again.The Dow Jones Index (DJI) closed yesterday above its 1D MA50 (blue trend-line) as it is extending the rebound we called on our previous analysis:
As you see, that rebound came exactly on the Higher Lows trend-line that started on the June 17 Low and was the second (July 14 the first) time it held, making it the short-term Support. What Dow achieved with that 1D candle close above the 1D MA50, is to invalidate the February 24 - April 28 2022 fractal, which by that time was similar but failed to break and close above its 1D MA50 and eventually got sold aggressively.
What makes the current rebound potentially having a long-term effect is 1) the 1D RSI rebound on its multi-year Oversold Zone and 2) the Bullish Cross on the 1D MACD, which within 2022 always delivers at least a +8% rebound. Such % rise would be the test of the 1D MA200 (orange trend-line), which is our medium-term target. As mentioned numerous times before, in order to commit to long-term buying we would like to see the index close above the 1D MA300 (yellow trend-line) first, which provided the rejection on the August 16 High.
So far the medium-term trading strategy is to buy every pull-back on the Higher Lows trend-line/ RSI oversold zone. A break below that level, we'll consider a bearish signal, targeting the 1W MA200 (red trend-line).
--------------------------------------------------------------------------------------------------------
** Please support this idea with your likes and comments, it is the best way to keep it relevant and support me. **
--------------------------------------------------------------------------------------------------------
Dow30

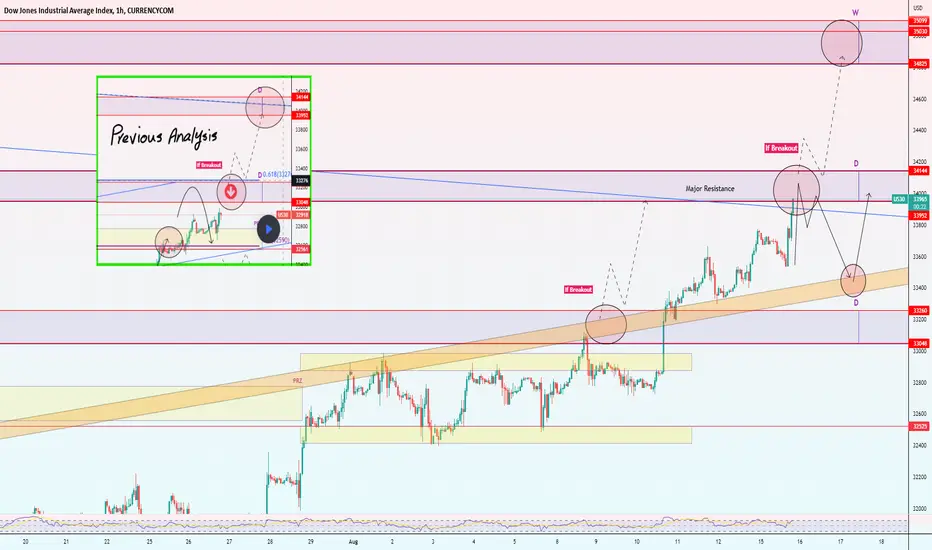
Dow Jones, in next days. US30Hello my friends, Everything is clear on the chart for you like always. There is a temporary upward trend so in pullback we can enter the buy position. Monitor the price's action in the circles.
Good luck.
If you like the idea, do not forget to support with a like and follow me for next analysis :)
Write your comment and opinion below to me

US30USD YM1! DOW 2022 SEP 12 Week
US30USD YM1! DOW 2022 SEP 12 Week
Last week's Scenario1 long on support of dotted trend line was good.
Caution: long trap observed, do not chase long.
Possible scenarios:
1) Long if 31450 / 31864-32029 is supported
2) Short on rejection of solid trend line / 32546
3) if triangle formation observed there may be short opportunity
Price reaction levels
Short on Test and Reject | Long on Test and Accept
32546 32029 31864
31450 30975 30406
Weekly: Low vol up bar close off high = minor weakness
Daily: Low vol up bar close off high = weakness
H4: Low vol narrow up bars + narrow close, followed by
ave vol up bar + UT bar = weakness
Remember to like and follow if you find this useful.
Have a profitable week ahead.

Nasdaq NQ - 8 Days & 1,700 PointsThe more I observe price action and the more I analyze charts, the more I feel that although the markets are absolutely primed for a major and inevitable correction towards the pre-COVID highs, which for Nasdaq and SPX are far under the June lows, we're on the cusp of a preceding bear lynching.
In my recent SPX call, I had forecasted a trip to the 3,8xx range early on in this Labor Day week in anticipation of everyone's favorite global market manipulator Federal Reserve Chairman Jerome Powell speaking on Thursday with FOMC and an inevitable rate hike looming on the 21st:
SPX / ES - Bull Whips and Bear Saws
What I had thought likely to happen was an early dump, followed by a pump into his speech, and then the beginning of our correction cycle.
And yet after observing the price action of Bitcoin and Ethereum over the weekend (significant since they tend to lead or match with the SPX since they have a CME futures market) in addition to Monday's price action when NYSE/TSX were closed for the weekend and today's strangely simple dump-into-accumulation pattern, I have since been forced to revised my theory.
I now believe that Big Jerome's talk on Thursday, September 8 is actually going to be used to propel the markets back to areas close to August highs.
Taking a look at my calendar, if this theory is true and Jerome was to pump it, you'd have eight trading days to do so until FOMC.
Afterwards, counting FOMC, there's still eight days left in the month to crash this plane straight into the side of the mountain all the way below July's lows as well.
What's the fundamental thesis for my theory? It's simple. One is that they've been selling a lot of VIX-enhanced puts for the last week and a half and a bull run will drop VIX back to like 19 and all those puts that they sold with high implied vol for monthly OpEx will expire worthless.
The second is that with VIX crushed, smart money can buy a large amount of October and November puts on the cheap for when we revisit 10,000 Nasdaq/SPX 3,500.
And the third is that with the USD going rampant, Wall Street Journal reported today that foreign buyers are going full ape risk-off trying to buy US equities because their national currencies are collapsing.
All on its own, perhaps it doesn't matter, yet consider that USDJPY is printing 143 and then Yen is the most worthless its been in 24 years:
Japan is most significant since the Bank of Japan pays no yield on bonds and so all that old, generational money props up the US equities market as it seeks returns elsewhere.
Also, the Bank of Japan's next meeting, where it really may have to finally abandon Yield Curve Control, is on the same day as FOMC: Sept. 21.
If BoJ is forced to raise their rates, finally, to try to save the Yen, and the Federal Reserve does something fun like 100 bps at the same time, you really are going to see the market crash with astoundingly violent force.
And if something this exciting were to happen, of course, as a Wall Street sociopath and a proper market maker, you would want prices to be high in advance, to take full advantage of the foreign market brought to you and the delightful opportunity to throw everyone off balance.
For all of this to work out will require that we aren't yet at the bottom. And we're not. Instead, I believe the pattern will be some kind of support or double bottom or stop sweep established around one of the June pivots @ ~11,500.
This is under the psychological 12,000 level and also doesn't totally break market structure yet.
Then, to rip it in the other direction back to a reasonable level will require a number roughly like 13,400. I do not believe they will take out the August high because what will unfold is ultimately a bull trap and not a true bear squeeze or a trend reversal.
Now you might think to yourself that this is too much volatility. This kind of pump is too far away, too fast. And this notion is really very reasonable.
However, I want to point out that Nasdaq did better than this in March, where it ran 2,300+ points in 11 trading days. Actually, counting the first eight trading days only, it more or less made 2,000 of those points.
And so, you all need to be careful. If this is totally wrong and you buy the bottom and it dies, well, it will hurt, but not so much if you keep your risk low. There will be good chances to buy a healthy gap up.
Where you're likely to get hurt is bottom shorting.
But the ones who are really going to get skinned are the FOMO crowd and the people who have no idea what time it is.
For a few days you will have returns. And for one weekend in the middle of September, as the autumn air chills, you'll be able to enjoy martinis at the bar, feeling like you've made it back to Tesla $1,000 Apple $200 and are thinking about what to waste your future winnings on.
But what comes after the Party is over will be like waking up from a dream and finding yourself inside of a concrete nightmare.
Because the drive down this time won't be like January-May was. It will gap down and the Terminator will be deployed, and hard, a lot like the COVID days.
But perhaps this time the Fed won't have any QE to save you with, because the intention is not to save you and keep the old Party going this time, it is to create a crisis and then save you from that crisis with a new Party composed of their technocratic paradigm of super communism.

DOW JONES hit the Higher Lows line. 1D RSI oversold.The Dow Jones Index (DJI) is on its 7th straight day below the 1D MA50 (blue trend-line) having fallen almost -10% since its August 16 High caused by the strong rejection on the 1D MA300 (yellow trend-line). The price has hit today the Higher Lows trend-line that started on the June 17 Low and had one more contact on July 14.
This is the only Support level that stands before a potential June 17 Low re-test, which is also where the 1W MA200 (red trend-line) is currently at, the index' natural long-term technical Support. As long as the Higher Lows hold, we can expect sideways trading within that trend-line and the 1D MA50. If the latter breaks, consider it a buy break-out signal targeting the 1D MA300 again or at least the 1D MA200 (orange trend-line) which was hit both on the June-Aug and Feb-March rallies. If the June Low and 1W MA200 break, then we can expect a new Lower Low around the -0.236 Fibonacci extension, as the May 20 Low did.
On a short to medium-term perspective, this is a buy opportunity as the 1D RSI is touching the Oversold zone that has been holding since the 2020 COVID crash. As you see, every direct hit in the Zone has delivered a rebound of at least +8.00%.
--------------------------------------------------------------------------------------------------------
** Please support this idea with your likes and comments, it is the best way to keep it relevant and support me. **
--------------------------------------------------------------------------------------------------------

Dow Jones, at the sensitive point. US30Hello my friends, Everything is clear on the chart for you like always. The bars going to key level as a major support and daily So this point very sensitive. also after this area is broken, next support will become active as a sell target. So monitor the price's action in the circles.
Good luck.
If you like the idea, do not forget to support with a like and follow me for next analysis :)
Write your comment and opinion below to me

DOW JONES on the 2008 crash fractal and how it avoids it. I've made many comparisons of Dow Jones' (DJI) 2022 Bearish Price Action with past Bear Cycles but being near closing its 3rd straight red 1W (weekly) candle since the August 15 rejection on the 1W MA50 (blue trend-line), it is time to update it.
As you see, this is a comparison of Dow's 2021/2022 chart against 2007/2008. The dynamic factor is WTI Oil (black trend-line). As you see in July 2008 Oil peaked while the index had already started it's correction inside the new Bear Market. Dow's 1W MA50 rejection was followed by a sharp sell-off below the 1W MA200 (orange trend-line) where the 1W MA50 crossed below the 1W MA100 (green trend-line) to form a Bearish Cross. The time that the index reached the 1W MA200 from its Market Top was 37 weeks (259 days).
At the moment the 2022 fractal looks to be following closely the 2008 sequence. If we exclude the fundamental extreme of the peak of the Ukraine - Russia war when Oil registered its peak (March 2022), its technical normalized top was in June 2022 right when Dow rebounded just before hitting the 1W MA200. See how even the 1W RSI sequences are identical so far. What this indicates is that Oil can continue dropping as the Fed attempts to lower an out of control inflation, but still stocks can fall along with it, just like it happened from mid 2008 to early 2009.
As a result, the 1W MA50 rejection seems so far consistent with mid-phases of a Bear Cycle. Fundamentally, a big factor that is not consistent with the 2008 fractal is the strong labor market we're currently at, with the Unemployment Rate (teal trend-line) still on market lows as opposed to the 2008 fractal, which by the 1W MA50 rejection in May 2008, it was already rising aggressively. This means that technically, a weekly candle close above the 1W MA50 can be regarded as an invalidation of the Bear Cycle fractal. Also the 1W RSI printing Higher Highs can be taken as such.
What do you think will happen next? Can Dow close above the 1W MA50 or August's rejection will hit the 1W MA200 as per the 2008 fractal?
P.S. Because the chart has the added elements of WTI Oil and the Unemployment Rate plotted and pinned to scales B and Z, it is not constant and may appear distorted based on your screen's/ browser dimensions. The original looks like this below, so if yours doesn't, adjust the vertical/ horizontal axis in order to make it look like this and better understand what is illustrated:
--------------------------------------------------------------------------------------------------------
** Please support this idea with your likes and comments, it is the best way to keep it relevant and support me. **
--------------------------------------------------------------------------------------------------------

Selling rallies in US30USD following NFP beatUS30USD - Intraday - We look to Sell at 31991 (stop at 32442)
The medium term bias remains bearish. There is scope for mild buying at the open but gains should be limited. Previous support at 32000 now becomes resistance. Resistance could prove difficult to breakdown. Preferred trade is to sell into rallies.
Our profit targets will be 30952 and 30700
Resistance: 32000 / 34200 / 36900
Support: 30950 / 29800 / 27000
Risk Disclaimer
The trade ideas beyond this page are for informational purposes only and do not constitute investment advice or a solicitation to trade. This information is provided by Signal Centre, a third-party unaffiliated with OANDA, and is intended for general circulation only. OANDA does not guarantee the accuracy of this information and assumes no responsibilities for the information provided by the third party. The information does not take into account the specific investment objectives, financial situation, or particular needs of any particular person. You should take into account your specific investment objectives, financial situation, and particular needs before making a commitment to trade, including seeking advice from an independent financial adviser regarding the suitability of the investment, under a separate engagement, as you deem fit.
You accept that you assume all risks in independently viewing the contents and selecting a chosen strategy.
Where the research is distributed in Singapore to a person who is not an Accredited Investor, Expert Investor or an Institutional Investor, Oanda Asia Pacific Pte Ltd (“OAP“) accepts legal responsibility for the contents of the report to such persons only to the extent required by law. Singapore customers should contact OAP at 6579 8289 for matters arising from, or in connection with, the information/research distributed.'

DOW daily : upper fibo 61% is 1st target but it can go to 35300butterfly pattern (and stupid Biden+Powel) do its job well push markets down
now dow reach fibo 61% (see red fibo on chart ) and it can start +uptrend to 33070
when pinbar comes on 1hour or 4hour or daily chart dont fear pick low size buy and hold it 7-8 day SL:pinbar low
good luck

Preferred trade is to sell into rallies on US30USDUS30USD - Intraday - We look to Sell at 32761 (stop at 33164)
The medium term bias remains bearish. A Doji style candle has been posted from the base. We look for a temporary move higher. A Fibonacci confluence area is located at 32800. Preferred trade is to sell into rallies.
Our profit targets will be 31822 and 31600
Resistance: 32800 / 34300 / 36800
Support: 32000 / 30400 / 29000
Risk Disclaimer
The trade ideas beyond this page are for informational purposes only and do not constitute investment advice or a solicitation to trade. This information is provided by Signal Centre, a third-party unaffiliated with OANDA, and is intended for general circulation only. OANDA does not guarantee the accuracy of this information and assumes no responsibilities for the information provided by the third party. The information does not take into account the specific investment objectives, financial situation, or particular needs of any particular person. You should take into account your specific investment objectives, financial situation, and particular needs before making a commitment to trade, including seeking advice from an independent financial adviser regarding the suitability of the investment, under a separate engagement, as you deem fit.
You accept that you assume all risks in independently viewing the contents and selecting a chosen strategy.
Where the research is distributed in Singapore to a person who is not an Accredited Investor, Expert Investor or an Institutional Investor, Oanda Asia Pacific Pte Ltd (“OAP“) accepts legal responsibility for the contents of the report to such persons only to the extent required by law. Singapore customers should contact OAP at 6579 8289 for matters arising from, or in connection with, the information/research distributed.'

US30USD YM1! DOW 2022 AUG 29 Week
US30USD YM1! DOW 2022 AUG 29 Week
Last week's 33205 rejection provided short opportunity.
Possible scenarios:
1) Long at 31780 support
2) Short on rejection of 32546 / 31780 / retracement on low
volume
Price reaction levels
Short on Test and Reject | Long on Test and Accept
34027 33326 32546
31780 31780
Weekly: Ave vol down bar close off low = Supply + some demand
Daily: High vol down bar close toward low = Supply, +
some demand coming in
H4: Climatic + high vol down bar close at low,
breaking down a previous support = bearish absorption
Remember to like and follow if you find this useful.
Have a profitable week ahead.

Selling rallies on US Wall St 30US30USD - Intraday - We look to Sell at 33964 (stop at 34295)
Although the bulls are in control, the stalling positive momentum indicates a turnaround is possible. A lower correction is expected. Horizontal resistance is seen at 34000. We look to sell rallies. Further downside is expected.
Our profit targets will be 33212 and 33000
Resistance: 34000 / 35500 / 37000
Support: 33200 / 31600 / 29600
Risk Disclaimer
The trade ideas beyond this page are for informational purposes only and do not constitute investment advice or a solicitation to trade. This information is provided by Signal Centre, a third-party unaffiliated with OANDA, and is intended for general circulation only. OANDA does not guarantee the accuracy of this information and assumes no responsibilities for the information provided by the third party. The information does not take into account the specific investment objectives, financial situation, or particular needs of any particular person. You should take into account your specific investment objectives, financial situation, and particular needs before making a commitment to trade, including seeking advice from an independent financial adviser regarding the suitability of the investment, under a separate engagement, as you deem fit.
You accept that you assume all risks in independently viewing the contents and selecting a chosen strategy.
Where the research is distributed in Singapore to a person who is not an Accredited Investor, Expert Investor or an Institutional Investor, Oanda Asia Pacific Pte Ltd (“OAP“) accepts legal responsibility for the contents of the report to such persons only to the extent required by law. Singapore customers should contact OAP at 6579 8289 for matters arising from, or in connection with, the information/research distributed.'

US30USD YM1! DOW 2022 AUG 22 Week
US30USD YM1! DOW 2022 AUG 22 Week
Last week supply returned for Scenario2 short opportunity.
Possible scenarios:
1) Daily/Weekly analysis showed minor strength,
let's see if demand is able to overcome supply for uptrend
continuation.
2) Short on rejection of 34027 or market
retraced on low volume.
Price reaction levels
Short on Test and Reject | Long on Test and Accept
34807 34027 33205
Weekly: Ave vol down bar close off low = minor strength
Daily: Ave vol down bar close off low = minor strength
H4: Very high volume up bar close off high followed by
down bar = weakness
Remember to like and follow if you find this useful.
Have a profitable week ahead.

Dow Jones, at the sensitive point. US30Hello my friends, This is an update of previous analysis (blow link). Everything is clear on the chart for you like always. The bars going to key level as a major resistance 34000-34150 as a resistance base and daily descending trend line, So this point very sensitive and I expect a pressure from sellers. also after this area is broken, next resistance will become active as a target. So monitor the price's action in the circles.
Good luck.
If you like the idea, do not forget to support with a like and follow me for next analysis :)
Write your comment and opinion below to me
DOW 4hour : sell under red arrow after pinbar comes as predict before ,dow reach 33800 area (can touch 34000)
under 33800 we have powerful trendline , so after pinbar comes on 1hour,4hour or daily chart we can sell with SL= pinbar high
if you have old sell (why dont put SL on high ? here no SL=margincall and loss) near 33130 you must close all or hedge
good luck , if dow break trendline can fly up to 35200 (i belive dow going to back to top

US30USD YM1! DOW 2022 AUG 15 Week
US30USD YM1! DOW 2022 AUG 15 Week
Last week market reached previous supply zone.
Long on retracement continues still preferred
Possible scenarios:
1) Continue of upward momentum for long on retracement
2) Short on rejection at channel supply
Price reaction levels
Short on Test and Reject | Long on Test and Accept
34807 34027 33205
Weekly: Ave vol up bar = minor strength
Daily: Ave vol up bar = minor strength
H4: Ave vol up bar = minor strength.
Remember to like and follow if you find this useful.
Have a profitable week ahead.

Dow 4 hour = fibo 61% show dow going to 34000exclent NFT news on friday , will push dow up this week !!!
if you have old sell , in deep hedge them and wait (never close buys frist)
strongly advice looking for buy , dont pick sell (only under red arrow +pinbar comes SL=pinbar high)
in 35200 we have powerfull support too , dow will see it too
i wish you win , stand on very very low and fix size
Dow 4 hour = upper target is 34000above green arrow we can pick buy (after pinbar comes on 1hour or 4hour or daily chart with SL = 100 point TP=33800 (under trend line)
ADVICE = DONT PICK SELL , LOOKING FOR BUY IN DEEP WITH SL IN DAY LOW OR 100 POINT
good luck

US30USD YM1! DOW 2022 AUG 01 Week
US30USD YM1! DOW 2022 AUG 01 Week
Last week market reached previous supply zone. Long on retracement continues.
And if price broken down of channel is is rejected,
target could be 30406.
Possible scenarios:
1) Continue of upward momentum for long on retracement
3) Rejection at previous supply zone + breakdown of channel for short
Price reaction levels
Short on Test and Reject | Long on Test and Accept
32563 31867
30406 29639 26212
Weekly: Ave vol up bar close at high = strength
Daily: Ave vol up bar close off high = minor weakness
H4: High vol narrow spread up bar followed by ave vol up bar close off high = weakness
Remember to like and follow if you find this useful.
Have a profitable week ahead.

Dow Jones, market in confusion and fear FOMC and GDP. US30Hello traders, Everything is clear on the chart for you like always. be careful today and tomorrow .
Good luck.
If you like the idea, do not forget to support with a like and follow me for next analysis :)
Write your comment and opinion below to me

Dow Jones, in uptrend to resistance zone. US30Hello traders, Everything is clear on the chart for you like always.
Good luck.
If you like the idea, do not forget to support with a like and follow me for next analysis :)
Write your comment and opinion below to me

US30USD YM1! DOW 2022 JULY 25 Week
US30USD YM1! DOW 2022 JULY 25 Week
Last week's long preference worked well.
Weakness shown over 3 TF analysis. We may see
short opportunity temporarily.
Possible scenarios:
2) Market rotation = trade at boundary of range
3) Behavior change scenario
Price reaction levels
Short on Test and Reject | Long on Test and Accept
32563 31867
30406 29639 26212
Weekly: Ave vol up bar close off high = weakness
Daily: Ave vol UT bar = weakness
H4: Ave vol tiny spread up bar = weakness
Remember to like and follow if you find this useful.
Have a profitable week ahead.

US30USD YM1! DOW 2022 JULY 18 Week
US30USD YM1! DOW 2022 JULY 18 Week
Last week, rotation strategy worked well again. Point to note for Dow, unlike
NASDAQ and SNP, we didn't see bullish volume returning.
So we will still adopt the rotation strategy.
Also with minor strength on Weekly tf, we can also look for long oppportunity
on retracement.
Possible scenarios:
2) Market rotation = trade at boundary of range
3) Behavior change scenario
4) Trend continuation - channel boundary trades
Price reaction levels
Short on Test and Reject | Long on Test and Accept
32563 31867
30406 29639 26212
Weekly: Ave vol down bar close toward high = minor strength
Daily: Ave vol u bar close at high = minor strength
H4: Very high vol narrow spread up bar close off high
followed by ave vol tiny spread up bar = weakness
Remember to like and follow if you find this useful.
Have a profitable week ahead.
