US30USD YM1! DOW 2022 JULY 11 Week
US30USD YM1! DOW 2022 JULY 11 Week
Last week, rotation support long was good. 3 TF analysis is displaying weakness.
We should be expecting lower prices temporarily.
I'm keeping the existing scenario plan from last week.
Possible scenarios:
1) Channel resistance / rotational resistance = short
2) Market rotation = trade at boundary of range
3) Behavior change senario
4) Trend continuation - channel boundary trades
Price reaction levels
Short on Test and Reject | Long on Test and Accept
32563 31867
30406 29639 26212
Weekly: Low volume up bar close off high = minor weakness
Daily: Ave vol up bar close toward low = weakness
H4: Very high vol up bar close off high toward middle + level close in background
= weakness
Remember to like and follow if you find this useful.
Have a profitable week ahead.
Dow30

DowJones Targeting The Equality Objective @32500In this update we review the recent price action in the DowJones futures contract and identify the next high probability trading opportunity and price objectives to target

Looking for temporary relief at trend support DOW30DOW30 - Intraday - We look to Buy at 30647 (stop at 30282)
The trend of higher lows is located at 30400. This is positive for sentiment and the uptrend has potential to return. A weaker opening is expected to challenge bullish resolve. Prices expected to stall near trend line support. We therefore, prefer to fade into the dip with a tight stop in anticipation of a move back higher.
Our profit targets will be 31586 and 31800
Resistance: 31600 / 33300 / 35300
Support: 30600 / 29000 / 26000
Risk Disclaimer
The trade ideas beyond this page are for informational purposes only and do not constitute investment advice or a solicitation to trade. This information is provided by Signal Centre, a third-party unaffiliated with OANDA, and is intended for general circulation only. OANDA does not guarantee the accuracy of this information and assumes no responsibilities for the information provided by the third party. The information does not take into account the specific investment objectives, financial situation, or particular needs of any particular person. You should take into account your specific investment objectives, financial situation, and particular needs before making a commitment to trade, including seeking advice from an independent financial adviser regarding the suitability of the investment, under a separate engagement, as you deem fit.
You accept that you assume all risks in independently viewing the contents and selecting a chosen strategy.
Where the research is distributed in Singapore to a person who is not an Accredited Investor, Expert Investor or an Institutional Investor, Oanda Asia Pacific Pte Ltd (“OAP“) accepts legal responsibility for the contents of the report to such persons only to the extent required by law. Singapore customers should contact OAP at 6579 8289 for matters arising from, or in connection with, the information/research distributed.'

US30USD YM1! DOW 2022 JULY 04 Week
US30USD YM1! DOW 2022 JULY 04 Week
Scenario1 short last week was good.
Market did not reach bottom of channel, temporary return of strength
Possible scenarios:
1) Channel resistance = short
2) Market rotation = trade at boundary of range
3) Behavior change senario
4) Trend continuation - channel boundary trades
Price reaction levels
Short on Test and Reject | Long on Test and Accept
32563 31867
30406 29639 26212
Weekly: Ave volume down bar close in middle = indecisive
Daily: Ave vol up bar close at high = minor strength
H4: Ave vol up bar close off high = weakness
Remember to like and follow if you find this useful.
Have a profitable week ahead.

DOW 30: Short term BullishCurrently @ 30,600
As the month comes to an end we expect some short term bullish movement just like
the previous month.
Bullish Scenarios
1. If Dow 30 breaks above 30,800 will expect it to test resistance @ 31,000 (38,2 % Fib Ret)
with a reversal back to 29,600 to complete a bullish harmonic on the 4H chart
2. If Dow 30 breaks above resistance @ 31,000 next resistance will be @ 31,300 (50% Fib Ret)
The month of July might reach highs of 32,350 (78,6 % Fib Ret) before continuing bearish
trend with next target @ 29,100 followed by 28,133 then 27,300 and 26,678.
Remember we are now in a Bear market any move to the upside will be short term
Positions
Buy Stop @ 30,100 - 30,600 closed, TP hit (last analysis link below)
Same positions in last analysis still active
New positions
Sell limit @ 32,200
Sell Stop @ 31,700
Sell Stop @ 31,300
Note: The two last positions/entries are only possible if 32,350 becomes resistance & highs of July 22
Link to previous analysis below
Note: this is just an analysis based on technical analysis & current events. All investments involve risk, our analysis and trading strategy does not guarantee future results or returns. Investors are fully responsible for any investment decisions they make.

US30USD YM1! DOW 2022 JUNE 27 Week
US30USD YM1! DOW 2022 JUNE 27 Week
Scenario2 channel & 29639 support provided long opportunity last week.
Daily TF cautioned of possible trap for long. If Weekly TF reveral pattern is to exert
influence, would prefer then a long on retracement when price finds support at
lower levels.
Possible scenarios:
1) Channel resistance + test of previous breakdown area - will short if resisted
2) test of 30683 / 30100 and if supported = long.
Price reaction levels
Short on Test and Reject | Long on Test and Accept
32563 31299 30999
30157 29639 26212
Weekly: Ave vol up bar close at high = minor strength (and reversal pattern)
Daily: Low vol up bar close at high = Caution, may be trap for long
H4: Ave vol up bar close off high = weakness
Remember to like and follow if you find this useful.
Have a profitable week ahead.

US30 THE DOW 30 CRASH, ONE YEAR LATER UPDATE Last year May we saw a potential crash for the Dow Jones 30 due to inflation fears
and now what we predicted is finally happening.
In our analysis a year ago Dow 30 was trading at 34,644 after reaching highs of 35100
we saw a potential sell signal on the 1W chart which was the formation of a bearish harmonic.
this halted our longs and swings on the Dow.
So what is Fueling the Dows Crash at the moment?
Same thing which was fueling it about a year ago, inflation fears in the US.
US investors have lost their trust in the Fed's ability to control inflation even
with the current 75 basis points interest hike we saw this week during the FOMC on Wednesday
to try and curb inflation, investors believe that the Feds tools have failed. Recent data has shown
that inflation is now at its highest in the last 40 years in the US and analysts have predicted
a decline in US GDP in the next coming years
meaning the US could be facing a recession or is already in one.
WHAT TO EXPECT
Currently @ 29,900
Next support for Dow 30 is 29,500 so we expect it to reach this support level before short term
retracement back to +30,000
Looking at the Covid Crash we expect Dow 30 to fall at least 10,000 points from its highs which were at 36,400 meaning
We expect Dow 30 to reach 26,000 before any reversals,
Our initial target from a year ago was 23,500 and we still think this might be a possibility.
Our positions
Active sell positions @ 31,600 & 31,300 from our last analysis link is attached below
New positions
Sell Limit @ 31,000 TP @ 30,000
Sell Stop @ 29,000 TP @ 28,000
Sell Stop @ 28,000 TP @ 27,000
Buy Stop @ 30,100 TP @ 30,600
Buy limit @ 29,500 TP @ 30,000
Buy limit @ 26,800 TP @ 28,000
Buy limit @ 23,700 TP @ 33,000
Note these are low risk entries
link to previous analysis attached below
Note: this is just an analysis based on technical analysis & current events. All investments involve risk, our analysis and trading strategy does not guarantee future results or returns. Investors are fully responsible for any investment decisions they make.

US30USD YM1! DOW 2022 JUNE 20 Week
US30USD YM1! DOW 2022 JUNE 20 Week
Last week shorts reigned. The week ended with demand coming in to support the market.
We may see long opportunity near 29639 temporarily.
Else, wait for price reaction to 29639.
Possible scenarios considered are:
1) 29639 support fail for short continuation
2) Channel and 29639 support: Return of demand for temporary long opportunity
3) If market retrace on low volume to higher levels and is rejected = short
Price reaction levels
Short on Test and Reject | Long on Test and Accept
32563 31299 30999
30157 29639 26212
Weekly: High vol wide spread down bar close off low = demand has come in.
Daily: High vol down bar, narrower spread and closing off low = strength - demand has come in
H4: Last 2 bars combined = UHV down bar closing in middle = Demand present
Remember to like and follow if you find this useful.
Have a profitable week ahead.

Breaking DOWn!!DOW30
Intraday
We look to Sell at 31095 (stop at 31410)
We look to sell rallies. Selling pressure dominated price action yesterday and we expect this to continue today. Although the bears are in control, the stalling negative momentum indicates a turnaround is possible. The bias is still for lower levels and we look for any gains to be limited. Expect trading to remain mixed and volatile.
Our profit targets will be 30200 and 29200
Resistance: 31345 / 32230 / 33000
Support: 30220 / 29200 / 26960
Please be advised that the information presented on TradingView is provided to Vantage (‘Vantage Global Limited’, ‘we’) by a third-party provider (‘Signal Centre’). Please be reminded that you are solely responsible for the trading decisions on your account. There is a very high degree of risk involved in trading. Any information and/or content is intended entirely for research, educational and informational purposes only and does not constitute investment or consultation advice or investment strategy. The information is not tailored to the investment needs of any specific person and therefore does not involve a consideration of any of the investment objectives, financial situation or needs of any viewer that may receive it. Kindly also note that past performance is not a reliable indicator of future results. Actual results may differ materially from those anticipated in forward-looking or past performance statements. We assume no liability as to the accuracy or completeness of any of the information and/or content provided herein and the Company cannot be held responsible for any omission, mistake nor for any loss or damage including without limitation to any loss of profit which may arise from reliance on any information supplied by Signal Centre

US30USD YM1! DOW 2022 JUNE 13 Week
US30USD YM1! DOW 2022 JUNE 13 Week
Last week we see a Scenario1 Rotation followed by Scenario3.
Market descended on strong volume, very nice short.
Possible scenarios considered are:
1) Market continue to be in rotation between 33205-32500
= Wait
2)32728 becomes support
3) 32728 becomes rejected and market return to test
30584-30926
Price reaction levels
Short on Test and Reject | Long on Test and Accept
36446 35750 35330
34807 34027 33531
33205 32563
31411 30926 30584
Weekly: Ave vol down bar close at low = Supply remains
Daily: Ave vol down bar closing toward low = Supply remains
H4: Ave vol down bar closing off low = some demand present
Remember to like and follow if you find this useful.
Have a profitable week ahead.

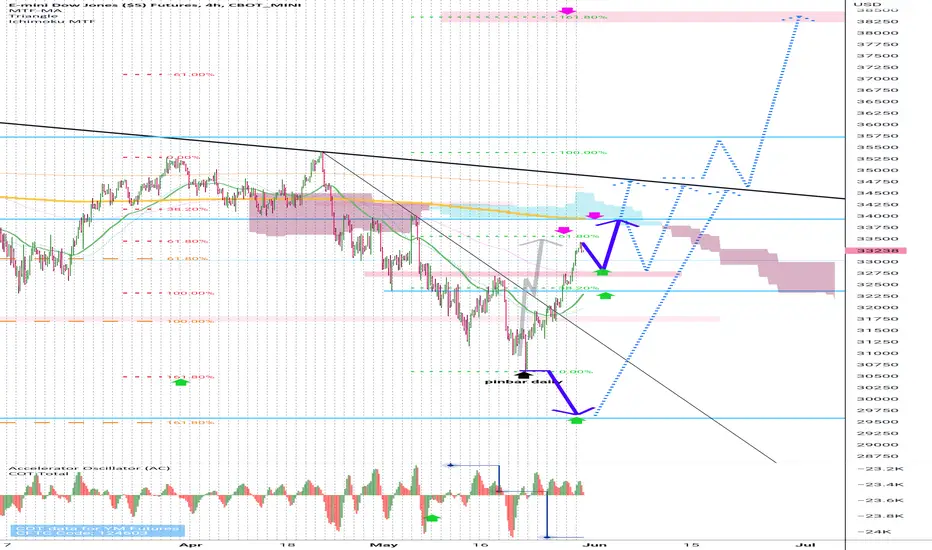
Dow 4hour :as i predict be4, it reach fibo 61% now can go down DONT PICK REVERSE SELL , looking for buy in deep , wait OK verfy comes
ok =buy pinbar on higher time frame or price break upper trendline in 15min chart
if you have old sell , close it near 32800
good luck , technical say dow can go to fibo 161% = 38000
US30USD YM1! DOW 2022 MAY 30 Week US30USD YM1! DOW 2022 MAY 30 Week
Last week market returned late weekto test edge of rotation zone.
Note: Strongest demand volume observed since downtrend.
Possible scenarios considered are:
1) Test rotation and rejected, for return to lower levels
2) (a) These levels become support for long
(a) 33205 (b) 32728 (c) 31411
Price reaction levels
Short on Test and Reject | Long on Test and Accept
36446 35750 35330
34807 34027
33531 33205 32728
31411 30584
Weekly: Ave vol down bar close off low = minor strength
Daily: Ave vol up bar closing off high = minor strength
H4: High vol up bar closing at high = strength
Remember to like and follow if you find this useful.
Have a profitable week ahead.

US 30: Intraday Technical AnalysisThe US30 once again took rejection from 32200. My idea is that the price is going to test the adjacent supports from where long positions can be taken. My goal is to enter after confirmation of supports near 31600 and 31200 with the goal of target resistance of 32000.
If you like this or if you think the opposite of this or if there is any other opinion, mention it in the comments. I am open to all kind of suggestions and critics

DOW 30: STILL BEARISH?Currently trading @ 31773
The Dow has been in a bearish trend for 8 weeks now and we still expect it
to continue its bearish trend.
Currently approaching the edge of the descending channel
We expect it to reject a potential break-out and it to continue to the downside.
Long-term we expect Dow to reach August to November 2020 support levels @ 29200
before some short term retracement to the upside in the month of June.
Short term key entries(Bearish)
Sells
Sell limit
@ 32,000
Sell Stop
@ 31,600
@ 31,300
Long term key entries(Bullish)
Note: on 1D & 1W chart Dow 30 is showing signs of turning bullish
Buys
Buy limit
@ 29,300
@ 30,200
Buy Stop
@ 32,700
Note: this is just an analysis based on technical analysis & current events. All investments involve risk, our analysis and trading strategy does not guarantee future results or returns. Investors are fully responsible for any investment decisions they make.

US30USD YM1! DOW 2022 MAY 23 Week
US30USD YM1! DOW 2022 MAY 23 Week
Last week scenario2 test and reject short was good.
Play scenarios mapped out:
1) Test and reject 32167 or supply line of channel for short
2) If market reaches 29523, wait for price reaction as
it was previous resistance turned support
Price reaction levels
Short on Test and Reject | Long on Test and Accept
36446 35750 35330
34945 34027 33066
32554 32492 32167
Weekly: Ave vol down bar close off low = minor strength
Daily: Ave vol up bar closing off high = minor strength
H4: High vol up bar closing at high = strength
Remember to like and follow if you find this useful.
Have a profitable week ahead.

DJI Death Sentence!The Dow is looking bearish AF!!! if we close below the 21 EMA on the monthly chart our next downside target will be between 21k and 23k.

ProShares Short Dow30 Is The US market crash coming ?Is The US market crash coming ?
We have 3 types of “crashes”
Correction <15% downward movement in a major indicy
Bear Market <20% downward movement in a major indicy
Black Swan event, something very unexpected that tanks the market, think 1987, 1929, challenger disaster, 911 and so on.
The fourth type is the 1919, 1929, 1999 and 2008 scenario that people generally refer to as a “crash” 2022 a new one ?
Sincereley L.E.D
In Spain 14/05/2022

It's Not Looking Good For The Dow!This is going to be the worst and best time in the history of the stock and crypto markets. Life changing moves are happening! Don't miss this drop!
Price targets if we continue the down trend:
28692.08
23531.31
Dead Zone Targets:
18152.33
16232.57

US30USD YM1! DOW 2022 MAY 08 Week
US30USD YM1! DOW 2022 MAY 08 Week
Last week, previous demand at 32427-32167 returned to support the market, so
we have scenario 3 where market returned to test the recent 2 highs.
Market is now again approaching 32427-32167. Again wait for price reaction
to this level.
Play scenarios mapped out:
1) Scenario 1 extension toward 32167-32427 region for a breakdown
2) Market rotates between 34027 and 32167-32427
Price reaction levels
Short on Test and Reject | Long on Test and Accept
36446 35750 35330
34945 34027
33066 32492 32167
Weekly: Average vol wide spread down bar close of low = strength
Daily: Ave volume down bar closing above mid of bar but off high = minor strenth
H4: Ultra high vol down bar closing off high followed by average volume
up bar closing off high = weakness
Remember to like and follow if you find this useful.
Have a profitable week ahead.

Dow can drop another 10%Like all stock indices, also Dow is not "feeling well", with the index starting the year badly and now trading again near support.
The recovery attempt started in March failed hard in the 35k zone and the selling power become very clear 2 weeks ago with a red candle that engulfs one month of trading.
As I said, Dow is trading near support now and I expect a breakdown
My target for this index is the 30k zone.
Sell rallies is, in my opinion, a very good strategy and I will be bullish only if the price pass above 35k

US30USD YM1! DOW 2022 MAY 02 Week
US30USD YM1! DOW 2022 MAY 02 Week
If no exception, market will likely continue toward 32427-32167 Scenario1 extension
from last week's analysis.
Wait for price reaction.
Play scenarios mapped out:
1) Test of 34220 breakdown, and continue toward 32167-32427 region
2) 32167-32427: If level is broken and later market returns to this area,
and is supported, next may be an attempt for an upward move
3) Market not ready for downward move toward 32427, return to clear
demand between 34220 - 33081 region
Price reaction levels
Short on Test and Reject | Long on Test and Accept
36446 35750 35330
34945 34367 34220
33066 32492 32167
Weekly: Average volume down bar close at low = weakness
with some demand
Daily: Ave volume down bar closing at low = weakness
H4: High vol down bar closing off low = minor strength
Remember to like and follow if you find this useful.
Have a profitable week ahead.

US30USD YM1! DOW 2022 APR 25 Week
US30USD YM1! DOW 2022 APR 25 Week
Scenario1 Rotational play between 34220-35330 yielded good result.
On Friday we saw Scenario 2 with breakdown of 34220 short.
Market should be attempting 33433 next, and then the 32427-32167
region.
Should market reach 32427-32167, wait for price reaction.
Play scenarios mapped out:
1) Test of 34220 breakdown, and continue toward 32167-32427 region
3) 32167-32427: If level is broken and later market returns to this area,
and is supported, next may be an attempt for an upward move
3) 33433 is supported and market attempt higher levels.
Price reaction levels
Short on Test and Reject | Long on Test and Accept
36446 35750 35330
34945 34367 34220
33427 32492 32167
Weekly: Average volume wider spread down bar close off low = weakness
with some demand
Daily: High volume down bar closing off low = weakness with some demand
H4: UHV bearish absorption + high vol down bar closing at low = weakness
Remember to like and follow if you find this useful.
Have a profitable week ahead.

DOW JONES starting new rally to 36000.Dow Jones (DJI) has been correcting inside a Channel Down ever since the March 29 Top. This was the top of the March rally that broke emphatically much higher than the 1D MA50 (blue trend-line), effectively confirming that this was the market bottom during the Ukraine - Russia war and the ongoing battle with inflation.
During uptrend technical structures, short-term Channel Down corrections are considered to be Bull Flags that serve as opportunities to buy for the continuation of the long-term bullish trend. The last such Bull Flag pattern, after a market correction of similar structured magnitude, was in May 2020 following the March 2020 correction due to the COVID pandemic market crash. Note that in both cases, the 1D Death Cross pattern (when the 1D MA50 crosses below the 1D MA200 (orange trend-line)) was formed on the market bottoms.
As you see, both Bull Flag patterns formed around the 0.618 Fibonacci retracement level and corrected as low as the 1D MA50 inside the Red Ichimoku Cloud. In 2020, shortly after the Bull Flag broke to the upside, the 1W MACD formed a Bullish Cross. On the current (2022) pattern, the 1W MACD is very close to forming that Bullish Cross, potentially meaning that we are currently on an early buy signal.
When the Bull Flag broke to the upside, the 2020 pattern made its next Higher High just above the 0.786 Fibonacci retracement level. On the current pattern, the 0.786 Fib is just below 36000. That is our target on Dow for the medium-term.
--------------------------------------------------------------------------------------------------------
Please like, subscribe and share your ideas and charts with the community!
--------------------------------------------------------------------------------------------------------
