Dow Jones Swing Trade Setup – Is 48,000 the Next Stop?📈 US30 "Dow Jones Industrial Average" CFD: Thief's Wealth Strategy Map (Swing/Day Trade) 🚨
🎯 Swing/Day Trade Setup: US30 (Dow Jones Industrial Average CFD)
Get ready to sneak into the market with the Thief Strategy — a cheeky, layered limit-order approach to steal profits from the Wall Street shadows! 😎 This bullish plan is designed for swing or day trading, with a professional yet playful vibe to maximize your market heist. Let’s break it down! 🕵️♂️
🧠 Trade Idea: Bullish Heist on US30 🚀
Asset: US30 (Dow Jones Industrial Average Index CFD)
Market: Wealth Strategy Map (Swing/Day Trade)
Outlook: Bullish 📈
Strategy: The Thief Strategy — using multiple buy limit orders in a layered entry style to catch the best price levels. Think of it as setting traps for profits! 🕸️
📝 The Thief’s Plan: Layered Entry & Key Levels
🔑 Entry Strategy:
Deploy multiple buy limit orders to layer your entries like a master thief:
🎯 46,500
🎯 46,600
🎯 46,700
🎯 46,800
Pro Tip: Feel free to add more layers based on your risk appetite or market conditions. The more traps, the merrier! 😜
Flexible Entry: You can enter at any price level within this range, but layering helps you average into the position like a sneaky pro.
🔐 Stop Loss (SL):
Set at 46,300 — the Thief’s escape hatch! 🚪
Note: Dear Ladies & Gentlemen (Thief OGs 🕶️), this SL is my suggestion, but it’s your heist! Adjust based on your risk tolerance and account size. Only risk what you can afford to lose!
🎯 Take Profit (TP):
Primary target: 47,600 — a juicy profit zone before the Police Barricade (resistance) at 48,000.
Why 47,600? This level avoids the overbought trap and potential reversal at 48,000, where strong resistance and market shenanigans may lurk. 🕵️♂️
Note: Thief OGs, this TP is my call, but you’re the boss! Take profits at your own discretion and secure the bag. 💰
🔍 Why This Setup? Key Analysis Points
Market Context: The US30 is showing bullish momentum, supported by recent economic data and market sentiment (check social posts and financial news for real-time vibes).
Technical View:
The layered entry approach leverages potential pullbacks within a bullish trend, maximizing your entry efficiency.
The 46,300 SL is placed below key support to protect against sudden reversals.
The 48,000 level acts as a major resistance (overbought zone + psychological barrier), making 47,600 a safer TP.
Risk Management: The Thief Strategy spreads risk across multiple entry points, reducing the impact of volatility spikes.
💹 Related Pairs to Watch (Correlated Assets in USD)
To boost your market awareness, keep an eye on these correlated assets:
SP:SPX (S&P 500 Index CFD): Moves closely with US30 due to shared exposure to U.S. large-cap stocks. A bullish US30 often aligns with SPX strength. 📈
PEPPERSTONE:NAS100 (Nasdaq 100 Index CFD): Tech-heavy index that can amplify or diverge from US30 moves. Watch for tech sector momentum. 💻
FX:USDJPY (Forex Pair): A stronger USD often supports bullish US equity indices like US30. Monitor for USD strength or Yen weakness. 💵
Key Correlation Insight: If SP:SPX and PEPPERSTONE:NAS100 show similar bullish patterns, it reinforces the US30 setup. Conversely, a sharp USDJPY drop could signal caution for US indices.
⚠️ Disclaimer
This Thief Style trading strategy is just for fun and educational purposes! 😜 Trading involves risks, and past performance doesn’t guarantee future results. Always conduct your own analysis, manage risk wisely, and only trade what you can afford to lose.
✨ If you find value in my analysis, a 👍 and 🚀 boost is much appreciated — it helps me share more setups with the community!
#US30 #DowJones #ThiefStrategy #SwingTrading #DayTrading #Bullish #TechnicalAnalysis #TradingView #WealthStrategy
Dowjonesindustrialanalysis

Can Dow Jones Maintain Bullish Momentum? Analysis🎯 US30 Dow Jones: The Great Heist Setup! 🏦💰
📊 Asset Overview
US30 (Dow Jones Industrial Average) - CFD Index
Trade Type: Swing/Day Trade
Bias: BULLISH 🐂
🔍 The Master Plan: Double Moving Average Confirmation
We're hunting for a pullback retest at two critical moving averages acting as dynamic support:
✅ Simple Moving Average (SMA) alignment
✅ Kijun-Sen (Ichimoku baseline) confluence
This double confirmation gives us the green light to ride the bullish trend with institutional-level precision. Think of it as the market leaving the vault door slightly open... 🚪💎
🎯 Entry Strategy: The "Thief Layering" Method
Primary Approach: Multiple Buy Limit Orders (Layering Strategy)
Recommended Layer Entry Zones:
🟢 Layer 1: 46,000
🟢 Layer 2: 46,200
🟢 Layer 3: 46,400
💡 Pro Tip: You can add more layers based on your risk appetite and position sizing. This strategy allows you to average into the position as price pulls back to support—like catching falling diamonds! 💎
Alternative: Market execution at any pullback to the moving average confluence zone.
🛡️ Risk Management
Stop Loss: 45,600
⚠️ Important: This is MY stop loss level based on technical invalidation. You're the captain of your own ship—adjust according to YOUR risk tolerance and account size. Trade at your own risk!
🎯 Target Zone: The Police Barricade
Take Profit Target: 47,600 🚨
This level represents:
🚧 Strong resistance zone (the "Police Barricade")
📈 Potential overbought conditions
Bull trap territory
Strategy: Scale out or secure profits as we approach this level. Remember: realized profits are better than paper gains!
⚠️ Reminder: This is MY take profit target. Your exit strategy should align with your trading plan and risk management rules. Lock in profits when YOU'RE comfortable!
🌐 Correlated Assets to Watch
Keep an eye on these related instruments for confluence:
SP:SPX (S&P 500): Broad market sentiment indicator—if SPX shows strength, US30 typically follows
SEED_ALEXDRAYM_SHORTINTEREST2:NQ (Nasdaq 100): Tech-heavy index correlation—risk-on appetite confirmation
TVC:DXY (US Dollar Index): Inverse correlation—weaker dollar often supports equity indices
TVC:TNX (10-Year Treasury Yield): Rate sensitivity—lower yields can fuel equity rallies
TVC:VIX (Volatility Index): Fear gauge—declining VIX supports bullish setups
Key Correlation Note: When these indices move in harmony with declining dollar strength, it strengthens the bullish case for US30. Watch for synchronized moves!
📝 Technical Summary
Trend: Bullish structure intact
Confirmation: Dual moving average support
Risk/Reward: Favorable with 400-1,600 point profit potential (depending on entry layer)
Time Frame: Swing to day trade duration
Strategy Style: "Thief layering" - accumulate on pullbacks
✨ If you find value in my analysis, a 👍 and 🚀 boost is much appreciated — it helps me share more setups with the community!
⚠️ Disclaimer
This "Thief Style" trading strategy is shared for educational and entertainment purposes only. This is NOT financial advice. Trading involves substantial risk of loss. Always conduct your own analysis, manage your risk appropriately, and never trade with money you cannot afford to lose. Past performance does not guarantee future results. You are solely responsible for your trading decisions.
#US30 #DowJones #SwingTrading #DayTrading #TechnicalAnalysis #MovingAverages #LayeringStrategy #IndexTrading #BullishSetup #TradingStrategy #CFDTrading #PriceAction #SupportAndResistance #TradingIdeas #MarketAnalysis #ThiefStyle

Can the DJIA Maintain Its Momentum? A Strategic Long Setup📈 DJIA Money-Making Plan: Thief Strategy (Swing/Day Trade) 🕵️♂️
🚀 Swing/Day Trade Setup for Dow Jones Industrial Average (DJIA) CFD
Join the "Thief OG" crew with this bullish plan to navigate the market with precision! Using a layered limit order strategy, this setup targets smart entries and calculated exits while keeping risk management first. Let’s dive into the plan! 💥
📊 Trade Plan Overview
Asset: Dow Jones Industrial Average (DJIA) CFD 💰
Direction: Bullish 🐂
Current Price (Sep 10, 2025): 45,711 🟢 (+0.43% from previous close)
Strategy: Thief Layered Limit Order Strategy 🕵️♂️
Place multiple buy limit orders at key levels to "steal" entries during pullbacks.
Suggested Entry Levels: $45,400, $45,500, $45,600, $45,700 (or customize based on your analysis).
Note: You can add more layers or adjust levels to suit your risk appetite. Flexibility is key! 🔧
Stop Loss (SL): $45,100 (Thief OG’s starting point).
Important: Adjust your SL based on your strategy and risk tolerance. This is a suggestion, not a rule! ⚠️
Target Price (TP): $46,600 (Escape before the "police barricade"!).
Note: Set your own TP based on your goals. Take profits at your discretion—don’t follow blindly! 💸
Risk Disclaimer: Dear Traders (Thief OG’s), this plan is a guide, not a guarantee. Always trade at your own risk and adjust SL/TP to your strategy. Protect your capital! 🛡️
🧠 Why This Plan? Thief Strategy + Market Insights
The "Thief" strategy uses layered limit orders to capitalize on pullbacks in a bullish trend, backed by solid market data. Here’s why this setup shines:
Thief Technical Strategy 🕵️♂️:
Layered Entries: Multiple buy limit orders ($45,400–$45,700) allow you to scale into the trade during dips, maximizing entry precision.
Risk Management: Suggested SL at $45,100 protects against unexpected reversals. Customize to your comfort level.
Profit Potential: Target $46,600 aligns with resistance levels and recent momentum. Exit strategically to lock in gains.
Fundamental & Macro Score: 7/10 (Solid Foundation) 🟢
Earnings Growth: Expected 7-10% for 2025, driven by strong corporate balance sheets.
Sector Strength: 10/11 S&P sectors up YTD, with tech and industrials leading.
Macro Environment:
Cooling inflation (CPI ~3.1% YoY).
Fed rate cuts expected, supporting growth.
Mild headwinds from tariffs and global trade risks.
Resilient labor market (unemployment 4.3%) and consumer spending fuel upside.
Trader Sentiment Outlook 😊:
Retail: 51% Bullish 🟢 | 34% Bearish 🔴 | 15% Neutral ⚪
Optimism driven by dip-buying in tech and industrials.
Institutional: 45% Bullish 🟢 | 40% Bearish 🔴 | 15% Neutral ⚪
Cautious positivity, focusing on corporate fundamentals amid policy uncertainties.
Overall Mood: Mildly positive, but stay alert for volatility from trade talks or inflation data.
Fear & Greed Index: 51 (Neutral) ⚖️
Balanced emotions: Not too scared, not too greedy.
Steady momentum, but watch for volatility spikes with upcoming data (e.g., inflation reports).
Market Outlook: Bullish 🚀
Bullish trend intact with no recession signals.
Expect modest single-digit % gains, led by earnings.
Stay cautious of pullbacks from policy news, but avoid shorting for now.
🔗 Related Pairs to Watch (in USD)
S&P 500 CFD ( SP:SPX ): Tracks broader market trends, often moves in tandem with DJIA.
NASDAQ 100 CFD ( NASDAQ:NDX ): Tech-heavy index, great for confirming bullish momentum.
FX:USDJPY : Currency pair sensitive to U.S. economic data and Fed policy.
OANDA:XAUUSD (Gold): Safe-haven asset; monitor for risk-off moves if sentiment shifts.
📝 Final Notes
This DJIA setup combines the tactical "Thief" layered entry strategy with robust market data to guide your trades. Stay disciplined, manage risk, and adapt the plan to your style. Let’s make smart moves together! 💪
✨ “If you find value in my analysis, a 👍 and 🚀 boost is much appreciated — it helps me share more setups with the community!”
#TradingView #DJIA #SwingTrading #DayTrading #ThiefStrategy #Bullish #TechnicalAnalysis #MarketAnalysis
US30: Late-Cycle Pop or Pullback Setup?The 𝐃𝐨𝐰 is pressing fresh highs into a historically soft seasonal window with stretched momentum and limited follow-through. I’m initiating/adding to a daily timeframe short aiming for a retrace back into prior breakout territory. My baseline path is a drift lower toward 44,500–44,000 (T1) and then the broader demand band near 43,000–42,2500 (T2), where I’ll reassess.
This isn’t a “crash” call—just a tactical mean-reversion as macro tailwinds fade, breadth narrows and the first Fed cut shifts the narrative from “rates down” to “why they’re down.”
Technicals:
• Stretched swing: Price has stair-stepped higher with shallow pullbacks; we’re now extended above the 50/100-DMA stack with waning impulse on push days (smaller real bodies, upper wicks).
• Local resistance: Repeated stalls into the same supply shelf. I’m leaning into the most recent failed extension and fading the box.
Structure map:
• Entry: around/into the failed-break zone 46.4k area.
• Invalidation: daily close > recent spike highs around 47.7k-48.0k.
• Targets: T1 45,000–44,500 (prior ATH retest / micro-POC region); T2 44,000–43,000.
• Risk: 0.5–1.0R per add; scale in only on rejection prints or lower-highs.
Fundamentals:
1) The first Fed cut is not automatically bullish.
The Fed delivered a 25 bps cut in September and signaled more easing, which historically can coincide with late-cycle growth scares and choppier equity returns rather than a straight-line melt-up. The cut was framed around cooling activity and inflation progress. 
2) Growth data is mixed—manufacturing still weak.
The ISM Manufacturing PMI remained in contraction in August (48.7)—below the 50 expansion line—signaling ongoing softness in goods demand. That is typically a headwind for the Dow’s cyclical mix. 
3) ES500 (S&P 500) breadth is narrow; concentration risk elevated.
Mega-caps continue to dominate performance and index leadership, while equal-weight underperforms and concentration risk stays high—conditions that historically increase pullback vulnerability. 
4) Valuations are rich versus history.
FactSet’s mid-summer forward 12-month P/E for the S&P 500 hovered well above 5- and 10-year averages (>22x vs. ~19x/17x), leaving less cushion if growth wobbles or margins compress. 
5) Sentiment & seasonality aren’t tailwinds.
September/early Q4 are seasonally tricky—historically the weakest stretch for US equities—just as the market tries to price the path of cuts vs. growth. 
6) Policy & trade headline risk.
Tariff timelines and “reciprocal” duties remain in play (with officials signaling Aug-1 implementation and additional measures possible), a rolling overhang for global cyclicals and exporters tied into the Dow complex. 
Note: Please remember to adjust this trade idea according to your individual trading conditions, including position size, broker-specific price variations, and any relevant external factors. Every trader’s situation is unique, so it’s crucial to tailor your approach to your own risk tolerance and market environment.

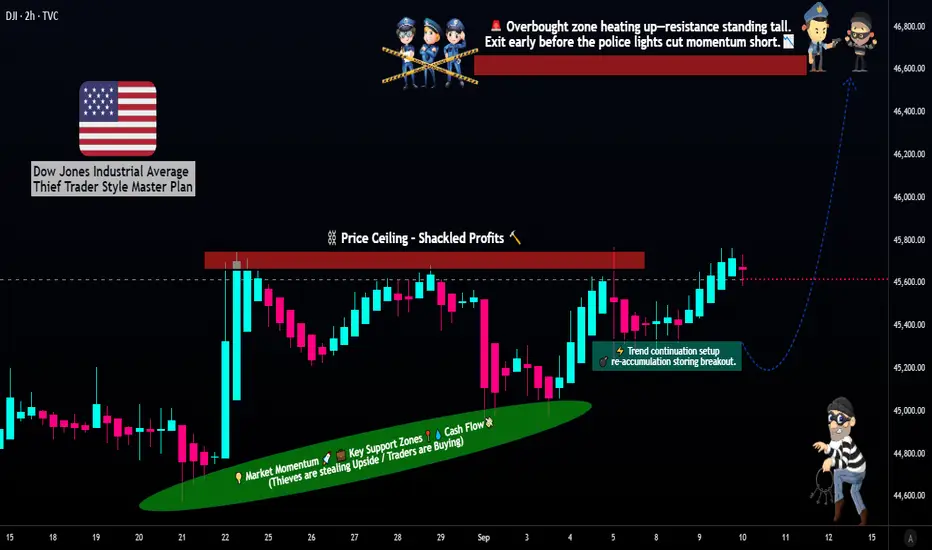
Market Heist in Progress! US30/DJI Long Trade – Ride or Escape?🔥 "The US30/DJI Heist: Bullish Loot & Escape Before the Trap!" 🔥
🌟 Hi! Hola! Ola! Bonjour! Hallo! Marhaba! 🌟
Dear Money Makers & Market Robbers, 🤑💰💸✈️
Based on the 🔥Thief Trading Style🔥 (technical + fundamental analysis), here’s our master plan to heist the US30/DJI (Dow Jones Industrial Average). Follow the strategy on the chart—long entry is the play! Aim to escape near the high-risk RED Zone (overbought, consolidation, potential reversal). The bears are lurking, so take profits and treat yourself—you’ve earned it! 💪🏆🎉
🚀Entry (The Vault is Open!)
"Swipe the bullish loot at any price!"
For precision, place buy limit orders within 15-30min timeframe (recent swing lows/highs).
Set alerts! Don’t miss the heist.
🛑 Stop Loss (Safety Net)
Thief-style SL at nearest swing low (3H timeframe) → 41,400 (adjust based on risk/lot size).
🏴☠️ Target 🎯: 44,200.00
Bullish momentum is fueling this heist—ride the wave but exit before the trap!
📰 Fundamental Backing (Why This Heist Works)
Macroeconomic trends, COT data, geopolitics, and sentiment align for bullish moves.
Full analysis? Check our bio0 linkk! 👉🔗🌎
⚠️ Trading Alerts (News & Risk Mgmt)
Avoid new trades during high-impact news (volatility = danger).
Use trailing stops to lock profits and dodge sudden reversals.
💥 Boost This Heist!
Hit 👍 (Boost Button) to strengthen our robbery squad!
More heists = More profits—stay tuned for the next steal! 🚀🤑
See you soon, fellow thieves! 🤝🎉

US30/DJI "Dow Jones" Index CFD Market Heist Plan (Day or Swing)🌟Hi! Hola! Ola! Bonjour! Hallo! Marhaba!🌟
Dear Money Makers & Robbers, 🤑💰✈️
Based on 🔥Thief Trading style technical and fundamental analysis🔥, here is our master plan to heist the US30/DJI "Dow Jones" Index CFD Market. Please adhere to the strategy I've outlined in the chart, which emphasizes short entry. Our aim is the high-risk Yellow MA Zone. Risky level, oversold market, consolidation, trend reversal, trap at the level where traders and bullish robbers are stronger. 🏆💸"Take profit and treat yourself, traders. You deserve it!💪🏆🎉
Entry 📈 : "The vault is wide open! Swipe the Bearish loot at any price - the heist is on!
however I advise to Place sell limit orders within a 15 or 30 minute timeframe most nearest or swing, low or high level for Pullback Entries.
Stop Loss 🛑:
📌Thief SL placed at the nearest/swing High or Low level Using the 1D timeframe (41000) Day/Swing trade basis.
📌SL is based on your risk of the trade, lot size and how many multiple orders you have to take.
Target 🎯: 35000 (or) Escape Before the Target
💰💵💸US30/DJI "Dow Jones" Index CFD Market Heist Plan (Swing/Day Trade) is currently experiencing a Bearish trend.., driven by several key factors.👇👇👇
📰🗞️Get & Read the Fundamental, Macro, COT Report, Geopolitical and News Analysis, Sentimental Outlook, Intermarket Analysis, Index-Specific Analysis, Future trend targets with Overall outlook score... go ahead to check 👉👉👉🔗🔗
⚠️Trading Alert : News Releases and Position Management 📰 🗞️ 🚫🚏
As a reminder, news releases can have a significant impact on market prices and volatility. To minimize potential losses and protect your running positions,
we recommend the following:
Avoid taking new trades during news releases
Use trailing stop-loss orders to protect your running positions and lock in profits
💖Supporting our robbery plan 💥Hit the Boost Button💥 will enable us to effortlessly make and steal money 💰💵. Boost the strength of our robbery team. Every day in this market make money with ease by using the Thief Trading Style.🏆💪🤝❤️🎉🚀
I'll see you soon with another heist plan, so stay tuned 🤑🐱👤🤗🤩

"US30/DJI30" Index CFD Market Heist Plan (Scalping/Day Trade)🌟Hi! Hola! Ola! Bonjour! Hallo! Marhaba!🌟
Dear Money Makers & Robbers, 🤑 💰💸✈️
Based on 🔥Thief Trading style technical and fundamental analysis🔥, here is our master plan to heist the "US30/DJI30" Index CFD Market. Please adhere to the strategy I've outlined in the chart, which emphasizes long entry. Our aim is to escape near the high-risk MA Zone. Risky level, overbought market, consolidation, trend reversal, trap at the level where traders and bearish robbers are stronger. 🏆💸"Take profit and treat yourself, traders. You deserve it!💪🏆🎉
Entry 📈 : "The heist is on! Wait for the MA breakout (40800) then make your move - Bullish profits await!"
however I advise to Place Buy stop orders above the Moving average (or) Place buy limit orders within a 15 or 30 minute timeframe most recent or swing, low or high level for Pullback entries.
📌I strongly advise you to set an "alert (Alarm)" on your chart so you can see when the breakout entry occurs.
Stop Loss 🛑: "🔊 Yo, listen up! 🗣️ If you're lookin' to get in on a buy stop order, don't even think about settin' that stop loss till after the breakout 🚀. You feel me? Now, if you're smart, you'll place that stop loss where I told you to 📍, but if you're a rebel, you can put it wherever you like 🤪 - just don't say I didn't warn you ⚠️. You're playin' with fire 🔥, and it's your risk, not mine 👊."
📍 Thief SL placed at the recent/swing low level Using the 1H timeframe (39200) Day trade basis.
📍 SL is based on your risk of the trade, lot size and how many multiple orders you have to take.
🏴☠️Target 🎯: 42700 (or) Escape Before the Target
🧲Scalpers, take note 👀 : only scalp on the Long side. If you have a lot of money, you can go straight away; if not, you can join swing traders and carry out the robbery plan. Use trailing SL to safeguard your money 💰.
💰💵💴💸"US30/DJI30" Index CFD Market Heist Plan (Day / Scalping Trade) is currently experiencing a bullishness🐂.., driven by several key factors.👇👇👇
📰🗞️Get & Read the Fundamental, Macro, COT Report, Quantitative Analysis, Sentimental Outlook, Intermarket Analysis, Future trend targets... go ahead to check 👉👉👉🔗🔗
⚠️Trading Alert : News Releases and Position Management 📰 🗞️ 🚫🚏
As a reminder, news releases can have a significant impact on market prices and volatility. To minimize potential losses and protect your running positions,
we recommend the following:
Avoid taking new trades during news releases
Use trailing stop-loss orders to protect your running positions and lock in profits
💖Supporting our robbery plan 💥Hit the Boost Button💥 will enable us to effortlessly make and steal money 💰💵. Boost the strength of our robbery team. Every day in this market make money with ease by using the Thief Trading Style.🏆💪🤝❤️🎉🚀
I'll see you soon with another heist plan, so stay tuned 🤑🐱👤🤗🤩

Just In: The Dow Jones Industrial Average (DJI) Dip 1,300 PointsOverview
The Dow Jones Industrial Average, also known as the DJIA or simply the Dow, is a market index frequently used to gauge the overall performance of the U.S. stock market. Indexes like the DJIA track the prices of a group of securities.
The Consumer index saw a downtick of 1300 points representing a 5.5% dip. This was days after Donald Trump declared a new set of tariffs targeting 185 countries, including major U.S. trading allies.
Tariffs Concern
The US stocks are poised to continue their bloodbath as futures signaled more fear over President Donald Trump's tariffs. Administration officials and Trump himself signaled on Sunday that they won't back down from their aggressive decisions. Meanwhile, an inflation report is due later this week as well as bank earnings.
Wall Street remained in fear mode over President Donald Trump's tariffs on Sunday evening as futures pointed to more steep losses.
The S&P 500 futures also sank 3.9% and Nasdaq futures dived 4.9%. That follows a devastating week that saw the worst selloff since the early days of the COVID-19 pandemic.
Similarly, the 10-year Treasury yield dropped 8.5 basis points to 3.906%, and US crude oil prices fell 3.7% to $59.72 a barrel.
Countries affected by the tariff rates are:
China (34%), the European Union (20%), and Japan (24%). Fitch Ratings estimated that the effective tariff rate could hit 25% on average — the highest in more than 115 years.
In an X post on Sunday, Former Treasury Secretary Larry Summers cautioned, saying there's a very good chance of more market turbulence similar to what was seen on Thursday and Friday.
Those sessions represented the fourth largest two-day drop in the last 85 years, Summer said. The selloff wiped out about $6 trillion in market cap.
“A drop of this magnitude signals that there’s likely to be trouble ahead, and people ought to be very cautious,” Summers wrote.
Meanwhile, Trump administration and the president himself defended the tariffs.
Technical Outlook
as of the time of writing, the The Dow Jones Industrial Average (DJI) Dip index point is down 5.5% trading in tandem with the support point that aligns with the 38,000 points. On a bearish case scenario, a break below this axis could be canning for the stock market as it will lead to panic selling in the industries concerned.
Similarly, should the bulls manage to thrust the DJI points up to the 42,000 points, we should experience a respite from the bears and possibly increased momentum might sent the stocks soaring higher. With the RSI at 23, this is hinting to a weak momentum with more downside ahead.

DJI - 1590 Points and Running!This is a long trade setup on the Dow Jones Industrial Average (DJI) on the 15-minute timeframe. The trade was initiated on January 14th, 2025, and has shown a significant upward move since then. As of today, the position is currently sitting at a substantial profit of 1590 points.
Trade Confirmation Rules:
The Risological Dotted Trend Line turned green, indicating a bullish trend or a change in trend direction.
The Risological Options Trading Indicator turned green with a bullish crossover, suggesting favorable conditions for long options positions.

DJI Pair : DJI - Dow Jones Description : Rising Wedge as an Corrective Pattern in Short Time Frame with the Breakout of the Lower Trend Line and Retracement. Completed " 12345 " Impulsive Waves and " AB " Corrective Waves. RSI - Divergence. Break of Structure.

Dow Jones Big Move ?Pair : Dow Jones - DJI
Description :
Bullish Channel as an Corrective Pattern in Long Time Frame and Rejection from Upper Trend Line. Completed " ABC " Corrective Waves. Break of Structure and Strong Divergence. Symmetrical Triangle as an Correction in Short Time Frame with the Breakout of Lower Trend Line.

UPDATE: DOW JONES INDUSTRIAL (US30)Last time i expected 1 more high at 34000-34400 (as Ending Diagonal on C) to start downtrend, it failed.
This is my new perspective on Dow Jones (US30), i strongly believe there will be a bearish to come.
Kindly remember, Elliott Wave is highly subjective, i will post if there's a new update on my perspective.
Trade safe, Everyone!
Cheers.

Dow Jones 3000$ predictedHere you find attached my old forecast for the DJI where I was calling a bottom and looking for upside resumption back in May.
We successfully rallied ever since and now we could see a little pullback to then reach wave (iii) target.
Feel free to ask me questions and trade safe!

DOW Elliott Wave Analysis for Friday 30/06/2023A pullback is ongoing in the lower timeframe. We see an opportunity for a long trade.

Dow Jones: Breather 😮💨Dow Jones is taking a breather near the resistance at 34 363 points, showing (again) a distinct response to this mark. Soon, though, the index should resume the ascent to develop the top of wave (i) in blue, which should then initiate a prominent downward movement. However, there is a 30% chance that Dow Jones could drop below the support at 32 246 points, plunging into the orange zone between 31 675 and 29 939 points to already expand wave alt.(ii) in blue. From this low, the index would then start a fresh upward movement.

Dow Jones: Spring Fever 🥱Has Dow Jones caught spring fever? At the moment, the index seems to lack the necessary drive to continue expanding wave (i) in blue. However, we expect Dow Jones to pull itself together soon and to summon up enough momentum to make it above the resistance at 35 521 points. The index should not surmount the higher mark at 36 446, though, but finish the current movement and turn downwards again. There is also still a 35% chance that Dow Jones could slip below the support at 28 635 points, heading for a new low in the form of wave iv in magenta.

Dow Jones: Periscope 👀Like a periscope, Dow Jones is craning its neck upwards, watching waves v in orange and (i) in blue unfolding before its eyes. To finish the current movement, the index should climb above the resistance at 35 521 points but ideally stop just short of the next mark at 36 446 points. Wave (ii) in blue should then lead Dow Jones decidedly back below 35 521 points. A 35% chance remains, though, for the index to turn downwards and to drop below the support at 28 635 points. In that case, Dow Jones would develop a new low in the form of wave alt.iv in magenta first before heading upwards again.

Dow Jones: Defenses 🍵When it’s cold outside, it’s always important to strengthen your body’s defenses. To boost its own immune system, Dow Jones is currently taking an invigorating sip of hot turmeric-ginger tea in the form of the orange zone between 33 283 and 31 689 points. We expect the index to expand this healthy swig to finish wave iv in orange. Afterwards, it should be bolstered enough to tackle the resistance at 34 707 points. There’s a 30% chance, though, that the warm beverage might relax Dow Jones too much so that the index could slip through the orange zone. In that case, it should drop into the blue zone between 30 955 and 29 934 points first before climbing upwards again.

Value buying opportunity S&P has completed a perfect 50% correction of the 2020 crash.
Currently as explained in charts. The best point to buy is 3897 - 3860 for target upto 4200. Sl will be 3850.
For any query contact me.

US30 3/11/2022the price after strong bearish run and a HTF bearish engulfing candle close, formed a small structure with some ranging on small TF by facing support at 32041 & resistance at 32234.
Now if price makes a break & closes below the recent support in atleast 30m-1hr TF then price might continue its bearish run towards next support at 31719 or all the way to 31193.
However if we see price closing above the recent resistance, then it might continue pushing up towards the HTF Resistance at 32371.

Dow Jones: Bar ExercisesOur athletic Dow Jones! After it has hopped from line to line, all the while finishing not only the overarching downwards movement in the course of wave iv in magenta but also waves (i) and (ii) in blue, the index has continued its fitness training with some bar exercises at the resistance line at 30513 points. We expect it to upswing from this mark, rising into the blue zone between 32567 and 33685 points to complete wave (iii) in blue, before starting a countermovement. However, there is a 45% chance that Dow Jones could lose its grip and drop below the support at 29640 points, thus triggering further descent below the next mark at 28635 points.

US30 (High Probability Buy Setup Soon)Here we can see clearly Dow Jones Industrial Average (US30) is forming the perfect ( H&S) Reversal Pattern, we're using 15M time frame for a clearer view of our analysis, so we can't predict which time frame for our Setup to Happen, Keep a close eye on US30 today, happy pip hunting traders.

Dow Jones: Jello 🍮What’s your favorite kind of jello? Cherry? Lemon? Raspberry? Dow Jones seems to prefer woodruff, as the index has been munching through the green jello between 30576 and 31689 points quite efficiently. Now that it has finished wave 2 in green, Dow Jones is already on its way to the next green jello between 37669 and 39249 points, where it should complete wave 3 in green. To take a bite there, it has to climb above the resistance at 34246 points first, though. Also, there is still a 42% chance that Dow Jones could wobble downwards below the support at 30109 points and thus below the next one at 29639 points as well.
