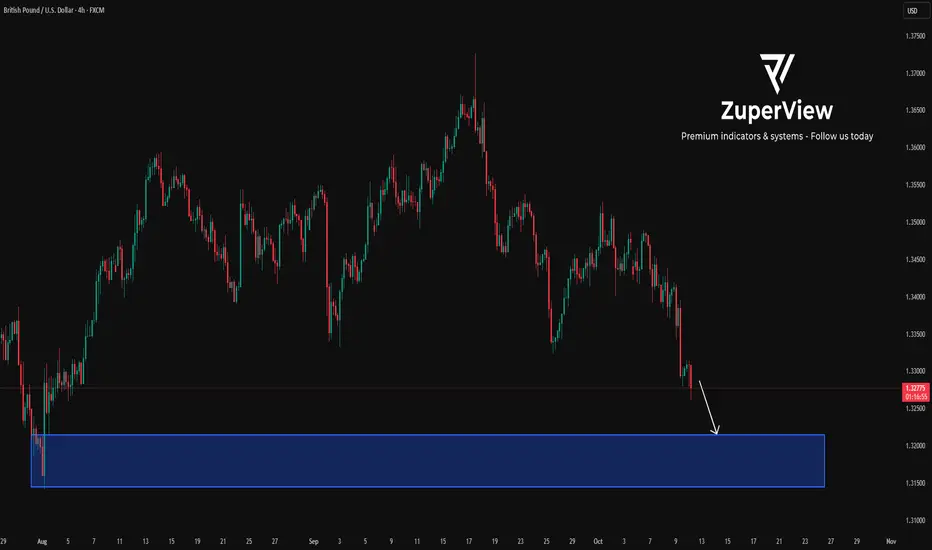
GBPUSD: Waiting for price to react to a major support levelTo better understand my current outlook on GBPUSD, please refer to my previous higher-timeframe and fundamental analyses:
* Trend: assessed using at least three trend indicators, with market structure as the primary guide.
** Weak or Reversal Signals: Assessed based on one of our criteria for trend reversal signals.
*** Support/Resistance: Selected from multiple factors – static (Swing High, Swing Low, etc.), dynamic (EMA, MA, etc.), psychological (Fibonacci, RSI, etc.) – and determined based on the trader’s discretion.
**** Our advice takes into account all factors, including both fundamental and technical analysis. It is not intended as a profit target. We hope it can serve as a reference to help you trade more effectively. This advice is for informational purposes only and we assume no responsibility for any trading results based on it.
Please like and comment below to support our traders. Your reactions will motivate us to do more analysis in the future 🙏✨
George Vann @ ZuperView
Downtrend
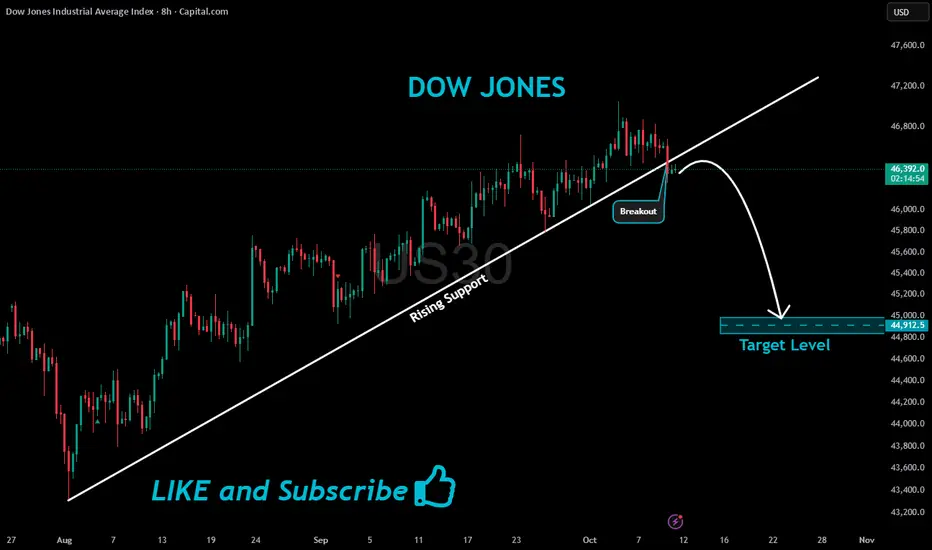
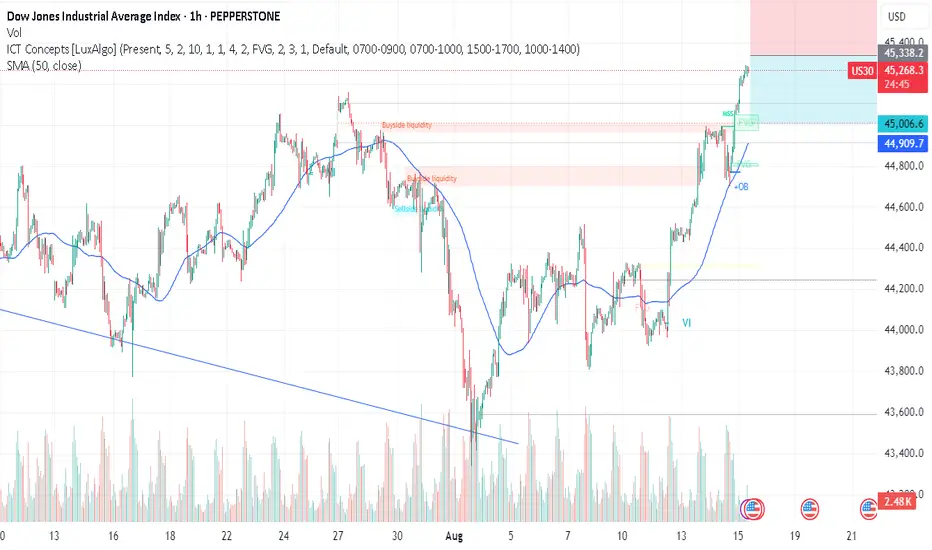
US30 Bearish Breakout!
HI,Traders !
#US30 made a bearish
Breakout of the rising support
Line and we are bearish biased
So we will be expecting a
Further bearish move down !
Comment and subscribe to help us grow !
Taking a trade on DOGE/USDTI’m a new trader and just started sharing my experience here. This is not financial advice, so take your own risk

Taking a trade on DOGE/USDTI’m a new trader and just started sharing my experience here. This is not financial advice, so take your own risk

Reversal in progress?Is NESF starting to complete the Head phase of an inverse H&S pattern?
Still no end to the downtrend yet.
Probably need to wait another 12 months to see.
If the BOE further reduce interest rates, this will help its cost of capital.

Liquidity Shift Suggests Extended Bearish CycleThe market is showing a progressive decline after losing upward strength. Recent swings indicate a decisive bearish control, with successive shifts in structure confirming the downward pressure. Attempts to recover higher levels have been shallow, reflecting exhaustion on the buy side and stronger liquidity flow toward sellers.
Market behavior suggests that rallies are being used as opportunities to exit or reposition short rather than initiate sustained bullish momentum. This is consistent with the overall weakening tone across the chart, where volatility spikes have favored downward extensions.
Looking ahead, if the current pace of distribution continues, the market is likely to maintain a bearish trajectory with potential for deeper declines as liquidity seeks out lower price ranges.

BTCUSD Short: Fading the Rally in a Bear ChannelHello, traders! The price auction for BTCUSD has been in a clear bearish phase since its rejection from the SUPPLY ZONE 2 near 115200. This has established a well-defined descending channel that has been guiding the price lower through a series of impulsive declines and corrective rallies, confirming that sellers have the initiative.
Currently, after testing the lower support line of the channel, the price is in the midst of a corrective bounce. This upward move is carrying the auction towards the upper boundary of the channel, which represents a major area of dynamic resistance.
My scenario for the development of events is that this corrective rally will fail upon testing the channel's resistance line, which aligns with the SUPPLY ZONE around the 111000 level. I expect this area to hold as strong resistance, causing a rejection and a continuation of the primary downtrend. The take-profit is therefore set at 107000, targeting a new lower low within the channel. Manage your risk!

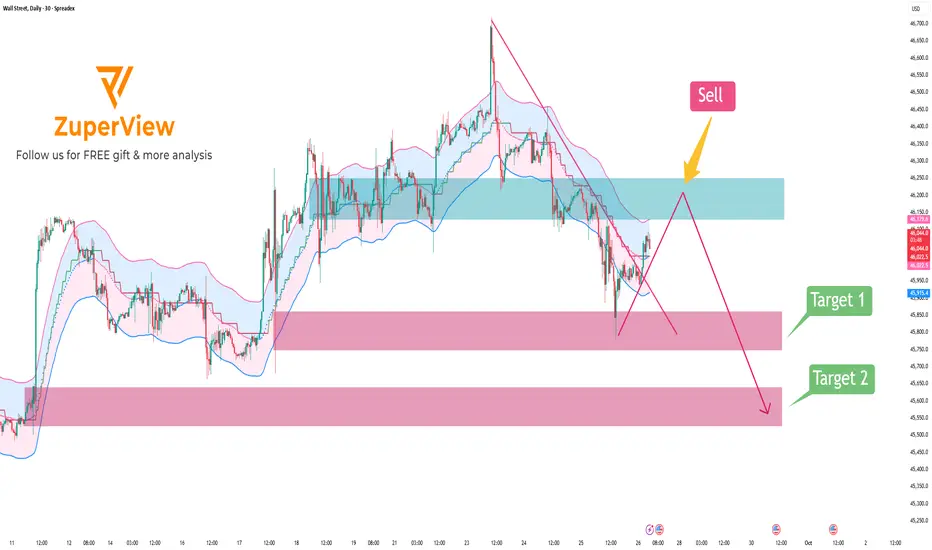
US30: Rebound to resistance & continue to break down
📝 1. Market Context
The SPREADEX:DJI dropped sharply from the recent high around 46,700 down to near 45,700, showing that sellers are currently in control in the short term. After this sharp decline, price is experiencing a mild recovery but still remains within a clearly defined downtrend channel and below key resistance.
🟥 2. Resistance Zone
The major resistance is located around 46,250 – 46,130 (highlighted in blue on the chart):
• This zone overlaps with the EMA and the upper band of the Keltner Channel.
• It was previously a sideways consolidation area that has now turned into resistance.
• It also intersects with the descending trendline, making a bearish rejection likely.
🟩 3. Support Zone
The nearest support lies at 45,858 – 45,748 (first pink zone).
If price breaks below this level, it is likely to continue falling toward the lower support zone at 45,520 – 45,640 (second pink zone).
🚨 4. Bearish Scenario
• Main scenario: Wait for a price pullback into the 46,250 – 46,130 area and watch for bearish signals → then SELL.
• Target: First target at 45,860 – 45,750 → if broken, expect further decline toward 45,520 – 45,640.
• Invalidation: A daily close above 46,250 would invalidate this bearish setup.
Please like and comment to support our traders. Your feedback motivates us to produce more analysis in the future 🙏✨
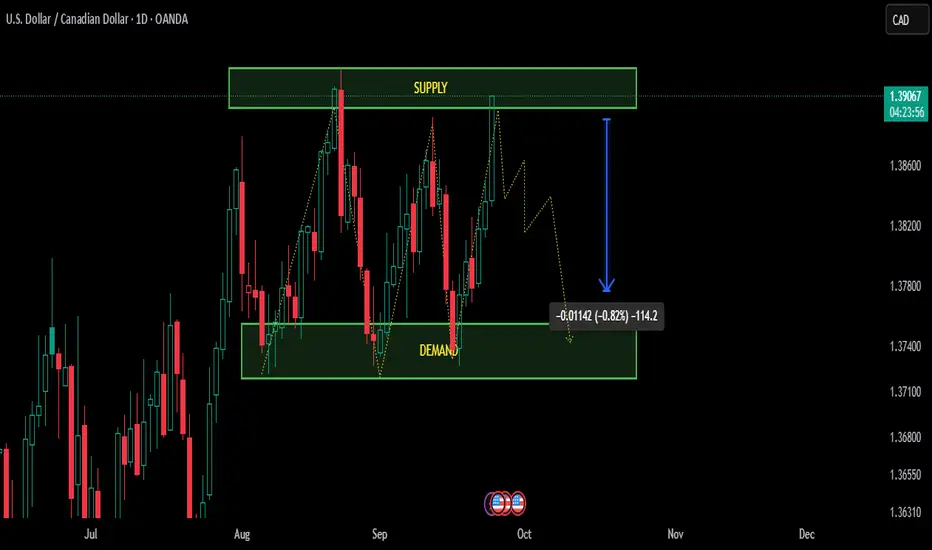
A perfect Supply and Demand USDCADA perfect Supply and Demand is created by the market on daily time frame, But maybe possible a little bit Liquidity sweep maybe created before down trend on above the supply zone ...
IMPORTANT POINTS;
PAIR: USDCAD
TIME FRAME: Daily
Liquidity sweeps maybe created by market makers be aware
Always put STOPLOSS
DOW/US30 - TIME FOR A KILLTeam, we have not been trading DOW/US30 since last week's successful short
WHY, we wait for the rate decision to come out
NOW, investors' hope is invalid, no momentum for a rate cut
LETs short the beast at 46135-46160
STOP LOSS AT 46250- OR 46280
EASY TARGET AT 46117-46070 - take partial 50-70% and bring stop loss to BE
2ND TARGET at 45972-45955
LETS GO

EURUSD: Price Exit from Triangle and Start FallHello everyone, here is my breakdown of the current Euro setup.
Market Analysis
From a broader perspective, EURUSD has been in a prolonged consolidation phase, forming a large symmetrical triangle. The price has been coiling between the major Support zone around the 1.1580 level and the key Resistance Zone up to the 1.1755 area, indicating a long period of market balance.
Currently, the price is at a critical decision point, trading at the apex of this triangle. It is directly challenging the descending resistance line, and the contracting volatility suggests a powerful, decisive move is on the horizon for the market.
My Scenario & Strategy
My scenario is built around the idea of a potential 'bull trap' or a failed breakout. While the price may initially break the triangle's resistance line, I believe the major Resistance Zone between the 1.1735 and 1.1755 area will hold firm, as it has done in the past.
I'm looking for the price to push above the trendline and into the Resistance Zone, which would likely trap optimistic buyers. The key signal would be a swift and forceful rejection from this area, pushing the price back down below the breakout point and eventually below the triangle's ascending support line. The primary target for this move is 1.1640, an objective below the current consolidation.
That's the setup I'm tracking. Thank you for your attention, and always manage your risk.

Bitcoin will continue to decline inside downward channelHello traders, I want share with you my opinion about Bitcoin. The dominant market structure for Bitcoin remains bearish, with the price action being clearly contained within a well-defined downward channel since the major rejection from the 116800 Resistance Level. This structure has been guiding the asset lower through a series of impulsive declines and corrective rebounds, confirming that sellers are in control of the trend. The most significant recent development was the breakdown below the key horizontal support around the 109000 level. Currently, after this breakdown, the price of BTC is in a corrective phase, rallying back to retest this broken structure from below, which now acts as the current resistance level. This 109000 - 109800 resistance zone is a critical inflection point. The primary working hypothesis is a short scenario, predicated on the failure of this retest. A confirmed rejection from this former support area would validate the continuation of the bearish momentum and signal that the next impulsive downward fall is imminent. Therefore, the TP for this trend continuation play is logically placed at 104000 points. This target represents a new lower low within the channel and is the next major area of structural interest for the price. Please share this idea with your friends and click Boost 🚀

BTCUSD: Decline Movement ContinuesHello everyone, here is my breakdown of the current Bitcoin setup.
Market Analysis
From a broader perspective, the price action for Bitcoin has been bearish since it was rejected from the major Resistance Zone 2 near 118900. This initiated a downtrend that has since been developing within the confines of a large downward wedge pattern, creating a sequence of lower highs and lower lows.
The most recent significant event was the breakdown below the key horizontal Resistance Zone 1 around the 112100 mark. After finding temporary support, the price is now in a corrective rally, heading back up towards the main resistance line of the wedge in a classic retest move.
My Scenario & Strategy
My scenario is based on the expectation that the dominant downtrend will continue. I'm anticipating that the price will complete this corrective bounce and touch the wedge's resistance line. Upon reaching this area, I expect sellers to show strength, reject the price, and cause a reversal that initiates the next impulsive move downwards within the overall structure.
Therefore, the strategy is to watch for this rejection from the wedge's resistance. The primary target for this move is 106500 points, which aligns perfectly with the lower support line of the wedge pattern.
That's the setup I'm tracking. Thank you for your attention, and always manage your risk.

EURUSD Short: Drop from Supply LevelHello, traders! The price auction for EURUSD has been characterized by a period of consolidation, which has formed a large symmetrical triangle. This pattern of contracting volatility was established by a series of key pivot points, with a pivot point high anchoring the 1.1720 supply area and a pivot point low defining the 1.1575 demand area. These actions have set the stage for the current state of market equilibrium, squeezing the price between the supply line and the demand line.
Currently, the auction is at a critical inflection point. Following a bounce from the ascending demand line, the price has rallied across the pattern and is now directly testing the descending supply line. This area represents a significant confluence of resistance, as it aligns with the horizontal 1.1720 - 1.1740 supply zone, a known territory of seller activity.
The primary scenario anticipates that sellers will successfully defend this resistance confluence and reject the current rally. A confirmed failure to break above the supply line would validate the integrity of the triangle pattern and likely initiate a new downward rotation. This would shift the short-term initiative back to the bears. The take-profit for this rotational play is therefore set at 1.1620, targeting the ascending demand line. Manage your risk!

XAUUSD Short: Sellers to Maintain Control at 3380 SupplyHello, traders! The macro structure for the XAU price auction has been defined by two critical pivot points, establishing a wide and volatile consolidation range. A major pivot point high was formed at the 3390 supply zone, while a subsequent pivot point low anchored the market at the 3300 demand zone. All price action since has occurred between these two dominant control zones, transitioning the market into a state of balance.
Currently, the price action is contracting within a large symmetrical triangle, signaling a compression of volatility. The auction is now at a critical inflection point, as it is directly testing the upper boundary of this formation. This area represents a powerful confluence of resistance, where the descending supply line and the horizontal 3380 - 3390 supply zone intersect, providing a key battleground for market participants.
The working hypothesis is a short scenario, predicated on sellers successfully defending this resistance confluence. It is anticipated that the price will make a final push into the supply zone before being rejected. A confirmed failure to break higher would validate the triangle's integrity and initiate a full rotation to the downside. The take-profit is therefore set at 3330, targeting the high-liquidity area where the ascending demand line converges with the horizontal demand zone. Manage your risk!

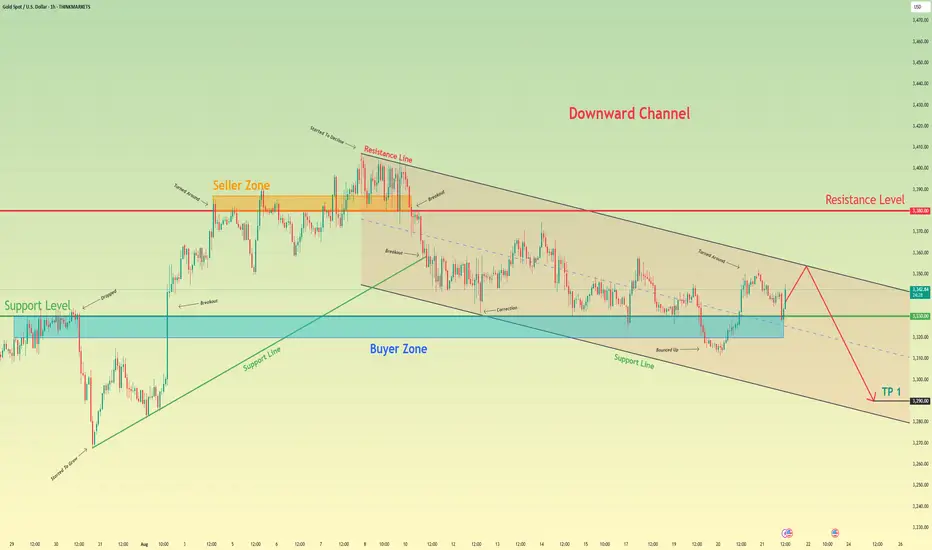
Gold can continue to decline inside downward channelHello traders, I want share with you my opinion about Gold. The price action for Gold has been dictated by a large downward channel since the last major peak was established at the 3380 resistance level. This bearish structure has effectively contained the market, guiding it through a series of impulsive declines and corrective rebounds between its well-defined support and resistance lines. After the most recent upward rebound originated from the lower boundary of the channel, the price has been in a corrective rally, now approaching a formidable confluence of resistance. This critical area is formed by the intersection of the channel's descending resistance line and the major horizontal seller zone around 3380. The primary working hypothesis is a short scenario, which is based on the expectation that this powerful resistance will hold and cause the current corrective rally to fail. A confirmed rejection from this zone would validate the integrity of the downward channel and signal that the dominant bearish trend is set to resume. This would likely trigger the next major impulsive fall, which is expected to break through the immediate support level at 3330. Therefore, the TP for this continuation scenario is logically placed at the 3290 level, a target that represents a new lower low within the channel's structure and a prudent objective for the anticipated move. Please share this idea with your friends and click Boost 🚀
Disclaimer: As part of ThinkMarkets’ Influencer Program, I am sponsored to share and publish their charts in my analysis.
Xauusd downtrendXAUUSD is currently trading around 3328. The market structure shows bearish momentum with sellers still in control. If this pressure continues, I expect price to push further down toward the 3288 level, which may act as the next support zone. Traders should watch for confirmation signals before entering, as volatility around key levels is likely.

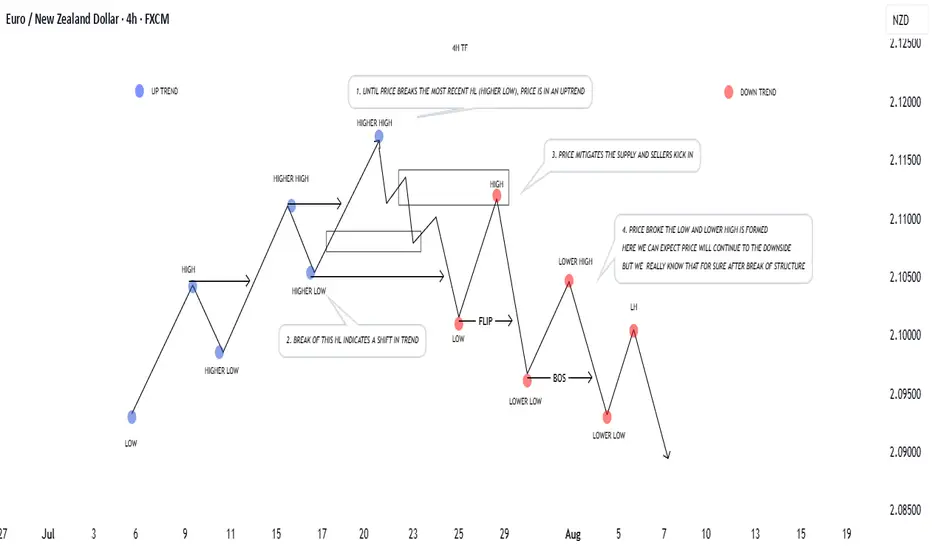
How to Identify Market Structure: From Uptrend to DowntrendUnderstanding market structure is key to trading well.
📈 In an uptrend, price forms a sequence of Higher Highs (HH) and Higher Lows (HL). As long as the most recent HL is respected, buyers remain in control. Pullbacks into demand often provide continuation opportunities.
📉 Once the most recent HL is broken, structure shifts — buyers lose control, and the market can flip into a downtrend with Lower Highs (LH) and Lower Lows (LL). Pullbacks into supply confirm bearish momentum.
🔑 Remember:
Market structure is fractal — always check higher timeframes for better understanding of price action.
A break of any important structure ( lows, highs ) tells us that either price is continuing or reversing.
Supply and demand zones are where reversals usually begin. And that is due to volatility and orders, volume coming into the market.
Don’t fight momentum — align with structure, and let the market confirm direction before you do anything.
Keep this framework in mind, and reading trends will become much clearer.
Blessings, T
DOW - TRUMP MEETING WITH PUTIN - Team,
Today we got LONG GOLD, SHORT UK100, SHORT AUS200, all target meet at our chat room
Here is the set up trade for US30
Entry: 45,272–45,300
Stop: 45,340–45,360
TP1: 45,080
TP2: 44,880
LETS GO
Bearish trend for GoldAre you ready for bearish trend of Gold?
After touching upper line of channel, Gold is ready for starting bearish trend.

ETHUSDT 4H Chart Review🔍 General Technical Context:
Prior Trend: Upward (strong rally from around 3,150 USDT).
Current Structure: After breaking out of the ascending channel, there was a strong decline, but is currently rebounding upward – it looks like a test of prior support as resistance.
📈 Key Horizontal Levels (Support/Resistance):
Resistance:
3,794 USDT – strong resistance resulting from the prior high (green line).
3,943 USDT – high of the ascending channel.
Support:
3,504 USDT – prior support, now potentially acting as resistance (red line).
3,383 USDT – July support.
3,132 USDT – strong base support, potential correction low.
📉 Technical Patterns:
Broken Upward Channel (orange lines): A clear downward breakout suggests a weakening of the previous trend.
Downward Trendline (purple): The current price is approaching it – a test and reaction (bounce or breakout) may occur.
📊 Stochastic RSI (oscillator at the bottom):
The indicator is entering the overbought zone (>80).
This may indicate an impending slowdown or correction, especially if the price encounters resistance at the purple downward trendline.
🔮 Scenarios:
✅ Bullish (if the breakout is upward):
A breakout of the purple trendline and resistance at 3,794 USDT could signal further gains towards 3,943 USDT or higher.
Confirmation could come from a retest of the purple line as support.
❌ Bearish (if resistance rejected):
Rejection from the trendline or the 3,794 USDT zone = possible correction to 3,504 or 3,383 USDT.
Break of 3,383 = potential decline to the 3,132–3,150 USDT zone.
🧭 Conclusion:
The market has regained strength from the local low but is at a potentially strong resistance zone.
Stochastic RSI overbought + near resistance = high risk of a near-term correction.
The key will be price performance within the purple trendline and 3,794 USDT.

Bullish Divergence appearing!2222 - Closed at 24 (03-08-2025)
Currently in Downtrend.
However, Bullish Divergence has
started appearing on Bigger tf.
Bearish ABCD pattern target seems to
be around 22 - 23 & it may reverse from
that point. But Confirmation will be
required before taking position. Otherwise,
Next possible Support level can be around 20 - 20.50.
Immediate Resistance seems to be around 25 - 26.
It needs to cross & sustain 29 to start its Uptrend.

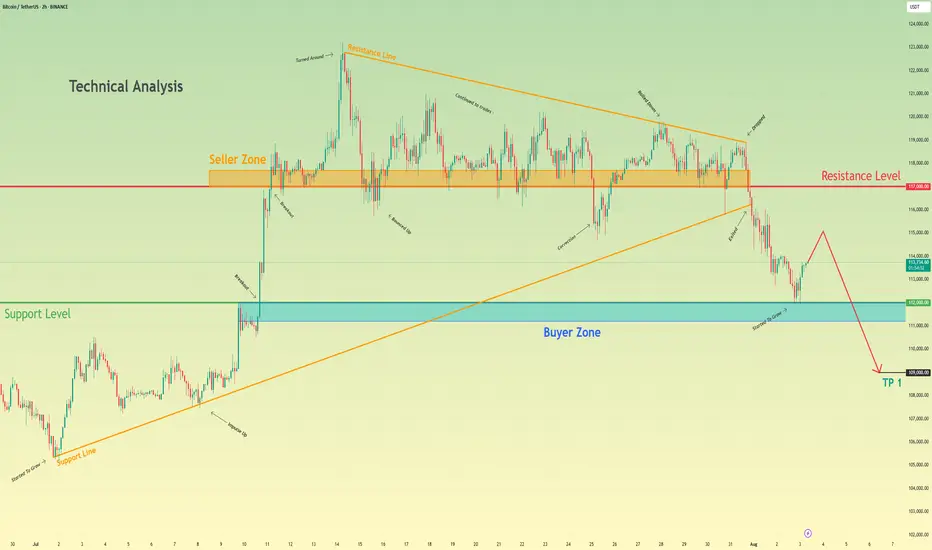
Bitcoin can continue to decline and break support levelHello traders, I want share with you my opinion about Bitcoin. Following an earlier upward trend, bitcoin entered a prolonged phase of consolidation, forming a large upward pennant where price action was tightly contested between the seller zone near 117000 and an ascending support line. This period of balance, however, has recently resolved to the downside with a significant change in market structure. A decisive breakdown has occurred, with the price breaking below the pennant's long-standing support line, signaling that sellers have ultimately gained control. Currently, after the initial drop, the asset is undergoing a minor upward correction, which appears to be a classic retest of the broken structure from below. The primary working hypothesis is a brief scenario that anticipates this corrective rally will fail upon encountering resistance from the broken trendline. A confirmed rejection from this area would validate the bearish breakdown and likely initiate the next major impulsive leg downwards. The first objective for this move is the buyer zone around the 112000 support level, but given the significance of the pattern breakdown, a continuation of the fall is expected. Therefore, the ultimate target price for this scenario is placed at the 109,000 level, representing a logical measured move target following the resolution of the large consolidation pattern. Please share this idea with your friends and click Boost 🚀
Disclaimer: As part of ThinkMarkets’ Influencer Program, I am sponsored to share and publish their charts in my analysis.