DOW JONES in synch with the USD to start a massive correction.Dow Jones (DJI) has been trading within a 17-year Channel Up ever since the bottom of the 2008 U.S. Housing Crisis. This is not the first time we give you this pattern, so I won't be getting into too much detail on its specifics.
What we do combine it with for the first time though, is the DXY (black trend-line), which has also been trading within a Channel Up since 2008, a direct consequence of the monetary policies that were applied globally by central banks to save the system following that credit-shock event.
What this cross symbol comparison offers, is give a clear unbiased illustration of the patterns and correlation involved between the stock market and DXY (U.S. Dollar Index). Most times that the DXY bottoms (green circles), Dow peaks its Bull Cycle and starts a correction (Bear Cycle, as shown in red). All of Dow's Bear Cycles have either pulled back to the 0.382 Fibonacci retracement level or the 1W MA200 (orange trend-line) or even both.
As a result, we estimate Dow to target 40000 by the time one of the above takes place, which can coincide with the DXY hitting the top of its inner Channel Down, similar to what it did during the previous two such smaller patterns within the main 17-year Channel Up.
---
** Please LIKE 👍, FOLLOW ✅, SHARE 🙌 and COMMENT ✍ if you enjoy this idea! Also share your ideas and charts in the comments section below! This is best way to keep it relevant, support us, keep the content here free and allow the idea to reach as many people as possible. **
---
💸💸💸💸💸💸
👇 👇 👇 👇 👇 👇
Dowsignals

DOW JONES Strongest sell signal in 2 months.Last week (see chart below) we gave a buy signal on Dow Jones (DJI), which easily hit our 48650 short-term Target, as the price found support inside a tight Triangle pattern:
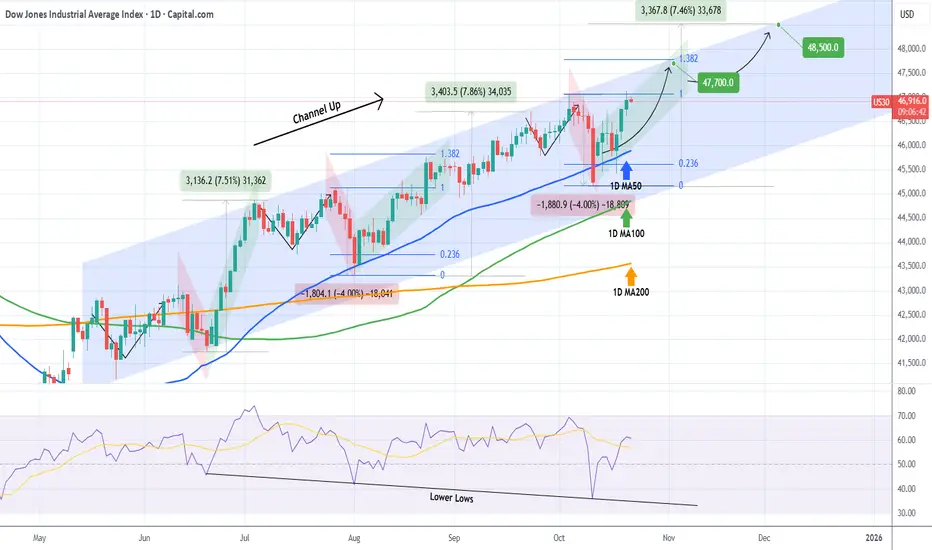
This time, a strong sell opportunity is emerging (in fact strongest in two months) as we move to the longer 1D time-frame, where Dow has been trading within an 8-month Channel Up that is very close to its top (Higher Highs trend-line).
The 1D RSI however is already touching its multi-month Resistance Zone, which makes it a prime Sell Signal already as the last time it was there was almost 2 months ago (November 12 2025). What followed this was a strong -5.59% technical pull-back that found support exactly on the 1D MA100 (green trend-line) at the bottom of the Channel Up.
Basically, the current Bullish Leg has also just completed a +8.59 rise, which is the most a Bullish Leg has grown within this pattern. And since a -4.00% correction has been the usual decline on all corrections also, we expect Dow to hit the 47900 - 47600 Target Zone, consisting of the 1D MA50 (blue trend-line) and 1D MA100 respectively, with Support 1 in between.
Keep an eye also on the 1D RSI Support Zone. If it gets hit before any of those targets, it will be a good idea to take the profit on the shorts then, regardless of the price.
---
** Please LIKE 👍, FOLLOW ✅, SHARE 🙌 and COMMENT ✍ if you enjoy this idea! Also share your ideas and charts in the comments section below! This is best way to keep it relevant, support us, keep the content here free and allow the idea to reach as many people as possible. **
---
💸💸💸💸💸💸
👇 👇 👇 👇 👇 👇

DOW JONES Triangle started a Bullish Leg.Dow Jones (DJI) has been trading within a Triangle pattern on the short-term, with the price making a Higher Low on Wednesday on its bottom. With the 4H RSI rebounding just after it breached below the 30.00 oversold barrier, we expect the pattern to start its new Bullish Leg now.
A +1.30% rise to test its top (Lower Highs trend-line), would still be a minimum based on all the Bullish Legs that preceded. As a result, our short-term Target (unless the 4H MA50 rejects the uptrend) is 48650.
---
** Please LIKE 👍, FOLLOW ✅, SHARE 🙌 and COMMENT ✍ if you enjoy this idea! Also share your ideas and charts in the comments section below! This is best way to keep it relevant, support us, keep the content here free and allow the idea to reach as many people as possible. **
---
💸💸💸💸💸💸
👇 👇 👇 👇 👇 👇

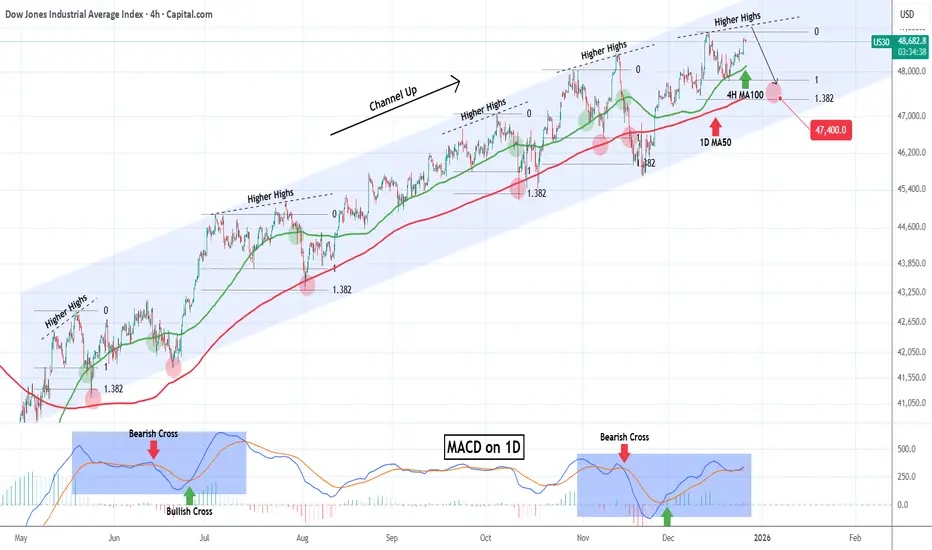
DOW JONES headed towards a rejection.Dow Jones (DJI) has been trading within a nearly 8-month Channel Up and is close to its All Time High (ATH) after rebounding last week on its 4H MA100 (green trend-line).
This pattern is cyclical and every time the latter support broke after a medium-term rally from its 1D MA50 (blue trend-line), the index got rejected on a Higher Highs trend-line and corrected back to the 1D MA50. Even the 1D MACD is printing a sequence similar to June - July.
As a result, we expect the new year to find Dow on its 1.382 Fibonacci extension at 47400 at least, which is the Fib level that every such correction pulled back to.
---
** Please LIKE 👍, FOLLOW ✅, SHARE 🙌 and COMMENT ✍ if you enjoy this idea! Also share your ideas and charts in the comments section below! This is best way to keep it relevant, support us, keep the content here free and allow the idea to reach as many people as possible. **
---
💸💸💸💸💸💸
👇 👇 👇 👇 👇 👇
DOW JONES Multi-month Bear Cycle to 40000 starting.Dow Jones (DJI) has been trading within a 16-year Channel Up since the 2008 Housing Crisis and approximately every 3.5 years (44 months) it tops and starts a technical correction/ Bearish Leg.
All of those Bear Cycles essentially since October 2011 have eventually pulled-back to the 1M MA50 (blue trend-line) at roughly he 0.382 Fibonacci retracement level. Only once time the 1M MA50 broke significantly and that was in March 2020 during the COVID flash crash, which eventually found Support on the 1M MA100 (green trend-line).
As a result, we expect Dow to start its Bear Cycle in 2026. From the current high the 0.382 Fib stands at exactly 40000, which based on its trajectory is where the 1M MA50 is headed by Q3 2026.
---
** Please LIKE 👍, FOLLOW ✅, SHARE 🙌 and COMMENT ✍ if you enjoy this idea! Also share your ideas and charts in the comments section below! This is best way to keep it relevant, support us, keep the content here free and allow the idea to reach as many people as possible. **
---
💸💸💸💸💸💸
👇 👇 👇 👇 👇 👇

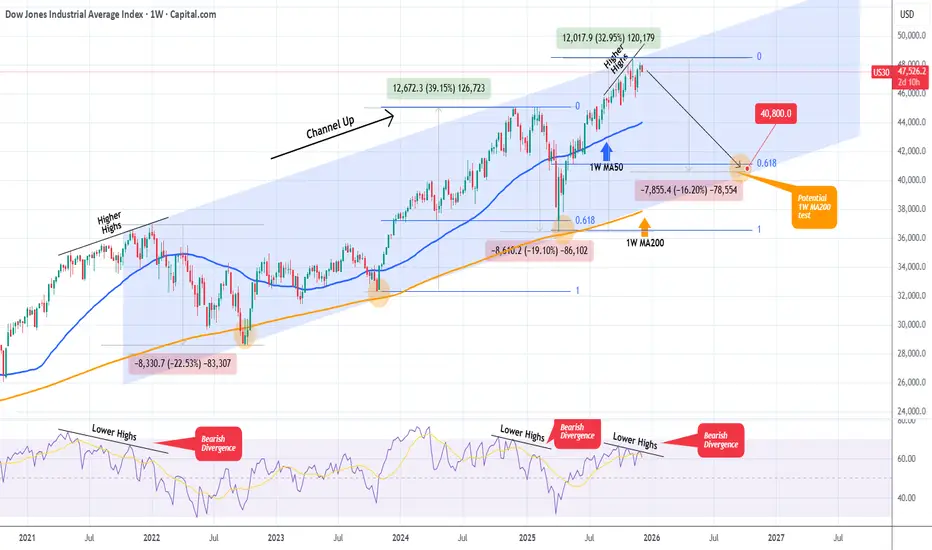
DOW JONES Is it starting a new Bear Cycle towards 40800?Dow Jones (DJI) has been trading within a 4-year Channel Up since the start of the 2022 Inflation Crisis. One month ago it hit the top of this pattern and hasn't made a new High since.
This is increasingly alarming as the 1W RSI is on a Bearish Divergence under Lower Highs against the market's Higher Highs. Every time this took place within this pattern, the index corrected heavily and attempted a 1W MA200 (orange trend-line) test.
As a result, if Dow fails to make a new High, we expect the bearish sentiment to intensify and start a new Bear Cycle (Bearish Leg for the Channel Up) towards its 1W MA200 and the 0.618 Fibonacci retracement level, which was the Target of the previous correction. Based on that it is possible for the index to hit 40800 at the bottom of the Channel Up.
---
** Please LIKE 👍, FOLLOW ✅, SHARE 🙌 and COMMENT ✍ if you enjoy this idea! Also share your ideas and charts in the comments section below! This is best way to keep it relevant, support us, keep the content here free and allow the idea to reach as many people as possible. **
---
💸💸💸💸💸💸
👇 👇 👇 👇 👇 👇
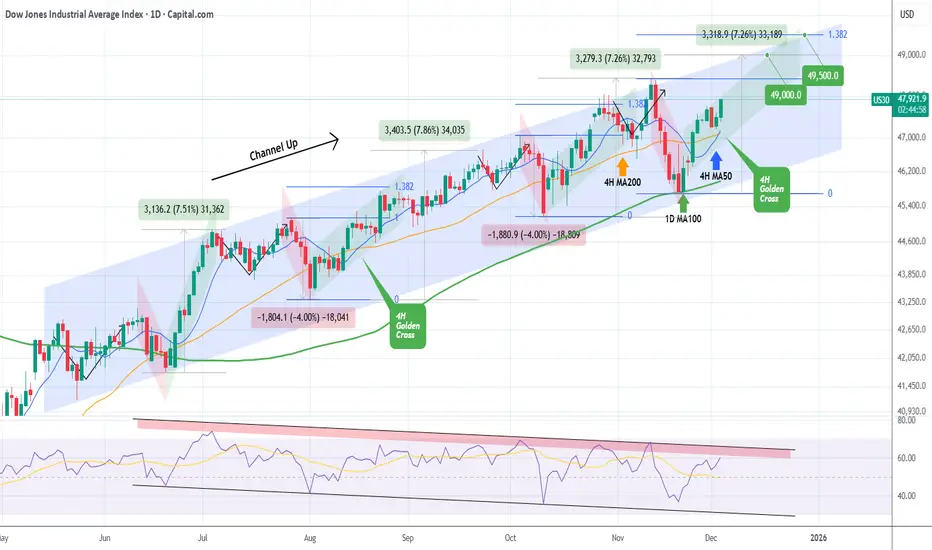
DOW JONES formed its first 4H Golden Cross since August. BullishDow Jones (DJI) has been trading within a 6-month Channel Up and today it formed its first 4H Golden Cross since August 15. Coming off a Higher Low bottom 2 weeks ago on the 1D MA100 (green trend-line), we are currently on the new Bullish Leg of the pattern.
The last one rose by +7.26%, roughly the % amount of the previous two as well, so our immediate Target remains 49000 as we've shown on last weeks analysis.
This time we also see an over-extended Target if the end-of-year rally lasts a bit longer, on the 1.382 Fibonacci extension at 49500, as this level has been hit on every Bullish Leg of this pattern.
If the 1D RSI though hits its Lower Highs Zone (red) earlier, it might be a good idea technically to book profits before those Targets are reached.
---
** Please LIKE 👍, FOLLOW ✅, SHARE 🙌 and COMMENT ✍ if you enjoy this idea! Also share your ideas and charts in the comments section below! This is best way to keep it relevant, support us, keep the content here free and allow the idea to reach as many people as possible. **
---
💸💸💸💸💸💸
👇 👇 👇 👇 👇 👇
DOW JONES Inverse Head and Shoulders formed. Bullish.Last week (November 19, see chart below), we caught the very bottom of the 6-month Channel Up on the 1D MA100 (green trend-line) of Dow Jones (DJI):
This time we view the price action using the 4H time-frame, where we can see that an Inverse Head and Shoulders has been formed, with its Head being the 1D MA100 bottom.
If more aggressive, it may not follow the typical green Bullish Leg of the Channel Up but the Target remains almost the same at 48900. That is the 2.0 Fibonacci extension. Typically we should see the 4H MA50 (blue trend-line) turning into the Support until the very top.
---
** Please LIKE 👍, FOLLOW ✅, SHARE 🙌 and COMMENT ✍ if you enjoy this idea! Also share your ideas and charts in the comments section below! This is best way to keep it relevant, support us, keep the content here free and allow the idea to reach as many people as possible. **
---
💸💸💸💸💸💸
👇 👇 👇 👇 👇 👇

DOW JONES Will the 1D MA100 save the day?Dow Jones (DJI) has been trading within a 6-month Channel Up and in the past 4 days it has been correcting on its latest Bearish Leg. By doing so, it broke below the 1D MA50 (blue trend-line) and is approaching the 1D MA100 (green trend-line) right at the bottom of the pattern.
This is the Channel's last Support. As long as it closes the daily candles above it, we will be bullish on Dow, targeting 49000, which represents a +7.25% rise, something all previous 3 Bullish Legs did.
---
** Please LIKE 👍, FOLLOW ✅, SHARE 🙌 and COMMENT ✍ if you enjoy this idea! Also share your ideas and charts in the comments section below! This is best way to keep it relevant, support us, keep the content here free and allow the idea to reach as many people as possible. **
---
💸💸💸💸💸💸
👇 👇 👇 👇 👇 👇

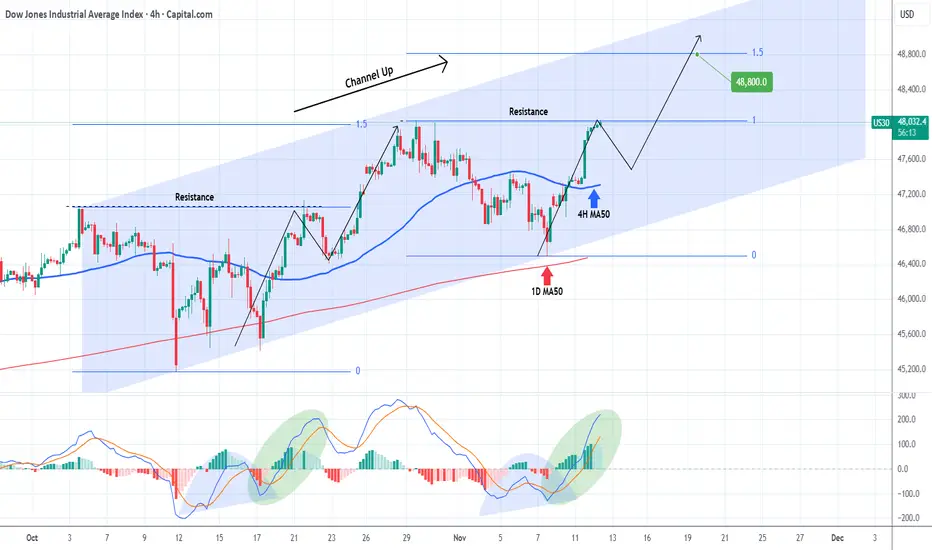
DOW JONES to new All Time Highs and won't stop there!Dow Jones (DJI) has been trading within an aggressive Channel Up since October 03, which made today a new All Time High (ATH). This is its technical Bullish Leg following the Higher Low bottom near the 1D MA50 (red trend-line).
With a 4H MACD sequence identical to the previous Leg, it is possible to see a re-test of the 4H MA50 (blue trend-line) next but on the medium-term, a new Higher High of at least 48800 (the 1.5 Fibonacci extension as on the previous Bullish Leg) is expected.
---
** Please LIKE 👍, FOLLOW ✅, SHARE 🙌 and COMMENT ✍ if you enjoy this idea! Also share your ideas and charts in the comments section below! This is best way to keep it relevant, support us, keep the content here free and allow the idea to reach as many people as possible. **
---
💸💸💸💸💸💸
👇 👇 👇 👇 👇 👇
DOW JONES recovered and is looking for a High at 48500.Exactly 2 weeks ago (October 22, see chart below), we gave a strong Buy Signal on Dow Jones (DJI), as the index had already initiated the new Bullish Leg of its 6-month Channel Up and quickly hit our 47700 Target:
That trading plan included a 2nd Target as well at 48500, which represented a +7.50% rise from the October 10 Low, which was a Higher Low for the Channel Up on its 1D MA50 (blue trend-line).
As Target 1 was on the 1.382 Fibonacci extension, the recent pull-back was technically expected as the sequence was similar to those of August 22 - September 02 among others. As you can see, all minor pull-backs that took place within this Channel Up, hit the 4H MA100 (red trend-line) and rebounded. Major ones found support lower on the 1D MA50, as did the October 10 Low.
Since the index hit yesterday its 4H MA100 and is rebounding today, the Bullish Leg remains valid and on the medium-term can reach our final 48500 Target.
-------------------------------------------------------------------------------
** Please LIKE 👍, FOLLOW ✅, SHARE 🙌 and COMMENT ✍ if you enjoy this idea! Also share your ideas and charts in the comments section below! This is best way to keep it relevant, support us, keep the content here free and allow the idea to reach as many people as possible. **
-------------------------------------------------------------------------------
💸💸💸💸💸💸
👇 👇 👇 👇 👇 👇

DOW JONES approaching the end of its Bull Cycle?Dow Jones (DJI) has been trading within a 16-year Channel Up ever sine the March 02 2009 market bottom of the U.S. Housing Crisis. As this chart shows, we have divided this pattern into three different phases.
Since the March 2020 COVID crash, it appears that the Cycle got restarted as the index broke below its 1W MA200 (orange trend-line) again after 10 years. Technically that was the only time that multi-year Support trend-line broke in 15 years.
In any case, following that Cycle 'restart', it appears that the index is currently inside the Megaphone pattern that in 2015 concluded Phase 2. The conclusion came with a second test on the 1W MA200 (Double Bottom). The first test was the April 07 2025 Low.
With their 1W RSI sequences also identical, having the first 1W MA200 forcing a 30.00 (oversold) RSI rebound, we expect the index to start a new Bearish Leg that might potentially test the 1W MA200 around 39000. For long-term investors, that is the market's next Buy Entry.
-------------------------------------------------------------------------------
** Please LIKE 👍, FOLLOW ✅, SHARE 🙌 and COMMENT ✍ if you enjoy this idea! Also share your ideas and charts in the comments section below! This is best way to keep it relevant, support us, keep the content here free and allow the idea to reach as many people as possible. **
-------------------------------------------------------------------------------
💸💸💸💸💸💸
👇 👇 👇 👇 👇 👇

DOW JONES eyes two Bullish Targets before the end of the year.Dow Jones (DJI) has been trading within a 5-month Channel Up and is currently on its new Bullish Leg following the October 10 bounce on its 1D MA50 (blue trend-line).
As you can see, there is a high degree of symmetry between both the Bearish and Bullish Legs within this pattern and if that continues to hold, the immediate Target of the current Bullish Leg is the 1.382 Fibonacci extension at 47700, which we've already mentioned on our previous analysis.
This time however, we also set a second Target towards the end of the year, being a +7.50% rise (standard Leg as you can see) from the bottom at 48500. Both Targets would make ideal technical Higher Highs for the Channel Up.
Notice also how the October 10 bounce took place also on the 1D RSI's Lower Lows trend-line. An additional indication of a strong support for the long-term bullish trend.
-------------------------------------------------------------------------------
** Please LIKE 👍, FOLLOW ✅, SHARE 🙌 and COMMENT ✍ if you enjoy this idea! Also share your ideas and charts in the comments section below! This is best way to keep it relevant, support us, keep the content here free and allow the idea to reach as many people as possible. **
-------------------------------------------------------------------------------
💸💸💸💸💸💸
👇 👇 👇 👇 👇 👇
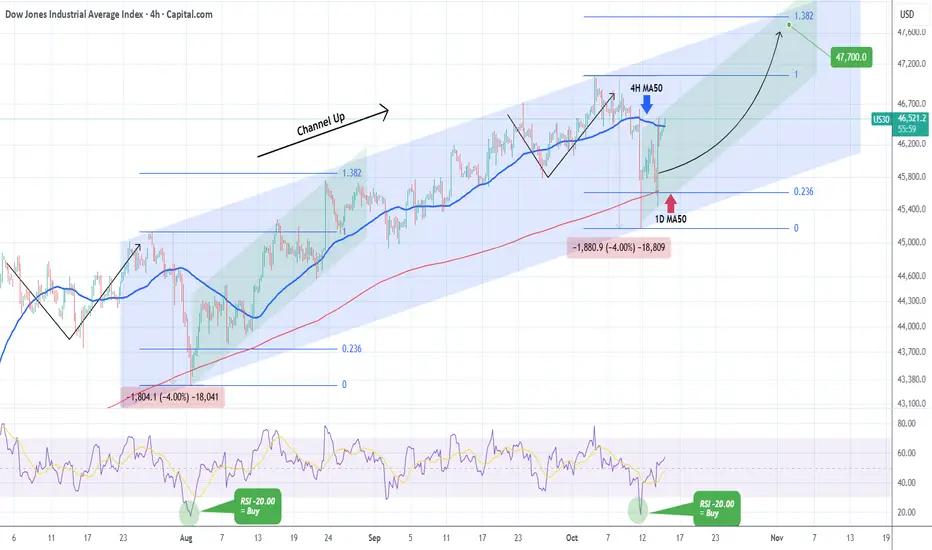
DOW JONES bounced at the bottom of the Channel Up. Buy signal.Dow Jones (DJI) has been trading within a 3-month Channel Up, with last Friday's flash crash breaching marginally below its 1D MA50 (red trend-line). That touched the bottom of the pattern and is technically a Higher Low, identical to the what the previous Bearish Leg did on the August 01 Low.
As you can see both Legs declined by -4.00% with their 4H RSIs touching the -20.00 level and rebounded. That is a technical Buy Signal, the strongest you can get within this Channel Up, and as long as the pattern's bottom holds, we expect another rise to the 1.382 Fibonacci extension (Our Target is 47700), similar to August's Bullish Leg.
-------------------------------------------------------------------------------
** Please LIKE 👍, FOLLOW ✅, SHARE 🙌 and COMMENT ✍ if you enjoy this idea! Also share your ideas and charts in the comments section below! This is best way to keep it relevant, support us, keep the content here free and allow the idea to reach as many people as possible. **
-------------------------------------------------------------------------------
💸💸💸💸💸💸
👇 👇 👇 👇 👇 👇
DOW JONES waiting for a rebound on its 4H MA50.Dow Jones (DJI) gave us last week (October 01, see chart below) an excellent Buy Signal on its 4H MA100 (green trend-line) that almost instantly hit our 47000 Target:
This time it is the 4H MA50 (blue trend-line) that is providing the new buy opportunity as following the 47000 Higher High of the Bullish Leg, the index pulled-back on a Bearish Leg.
As you can see, the symmetry within this pattern remains high with all three Bullish Legs so far rising by around +2.75% and the 4 MA50 / 4H MA100 providing support for the Bearish Legs.
As a result, we expect a new short-term rebound, as long as the 4H MA50 holds, targeting the 1.5 Fibonacci extension at 47180.
-------------------------------------------------------------------------------
** Please LIKE 👍, FOLLOW ✅, SHARE 🙌 and COMMENT ✍ if you enjoy this idea! Also share your ideas and charts in the comments section below! This is best way to keep it relevant, support us, keep the content here free and allow the idea to reach as many people as possible. **
-------------------------------------------------------------------------------
💸💸💸💸💸💸
👇 👇 👇 👇 👇 👇

DOW JONES Can the 4H MA100 initiate a comeback??Dow Jones (DJI) has been trading within a 2-month Channel Up and today touched its 4H MA100 (green trend-line) for a second time after September 25.
Both in terms of price and 4H RSI action, this sequence is similar to the September 02 rebound fractal, which also following a Bull Flag, it touched the 4H MA100 for a 2nd time and then moved on to a rally that peaked on the 1.5 Fibonacci extension.
The 1.5 Fib ext also priced the Higher High of the first Bullish Leg of the pattern, thus offers currently the highest probability for our next Higher High. Our long Target is slightly below it at 47000, representing a +2.80% rise from the recent Low.
-------------------------------------------------------------------------------
** Please LIKE 👍, FOLLOW ✅, SHARE 🙌 and COMMENT ✍ if you enjoy this idea! Also share your ideas and charts in the comments section below! This is best way to keep it relevant, support us, keep the content here free and allow the idea to reach as many people as possible. **
-------------------------------------------------------------------------------
💸💸💸💸💸💸
👇 👇 👇 👇 👇 👇

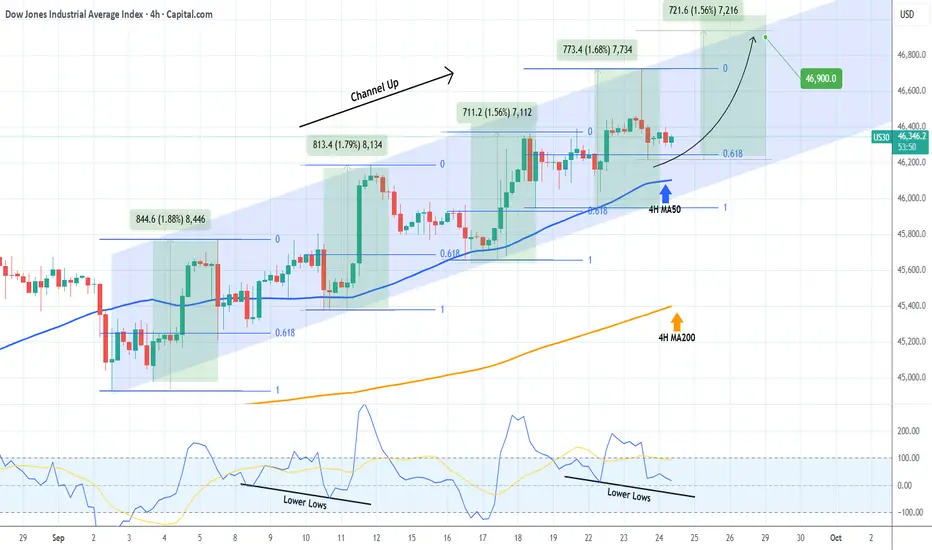
DOW JONES forming a bottom ahead of the next rally.Dow Jones (DJI) has been trading within a Channel Up since the start of September and right now it is consolidating after having hit the 0.618 Fibonacci retracement level, following a Higher High rejection at the top of the pattern.
As you can see, the 0.618 Fib was always pull-back tested after a Higher High, with the 4H MA50 (blue trend-line) also or at least coming very close to. As a result, the current 4H candle consolidation is technically a bottoming process before the new Bullish Leg.
The weakest Bullish Leg of this Channel Up has been +1.56%, which more than covers our 46900 Target.
-------------------------------------------------------------------------------
** Please LIKE 👍, FOLLOW ✅, SHARE 🙌 and COMMENT ✍ if you enjoy this idea! Also share your ideas and charts in the comments section below! This is best way to keep it relevant, support us, keep the content here free and allow the idea to reach as many people as possible. **
-------------------------------------------------------------------------------
💸💸💸💸💸💸
👇 👇 👇 👇 👇 👇
DOW JONES The Cyclical Pivot that MUST hold.Last week (Sep 03, see chart below) we gave a buy signal on Dow Jones (DJI) right at the bottom of its medium-term Channel Up, which quickly hit our 46100 Target:
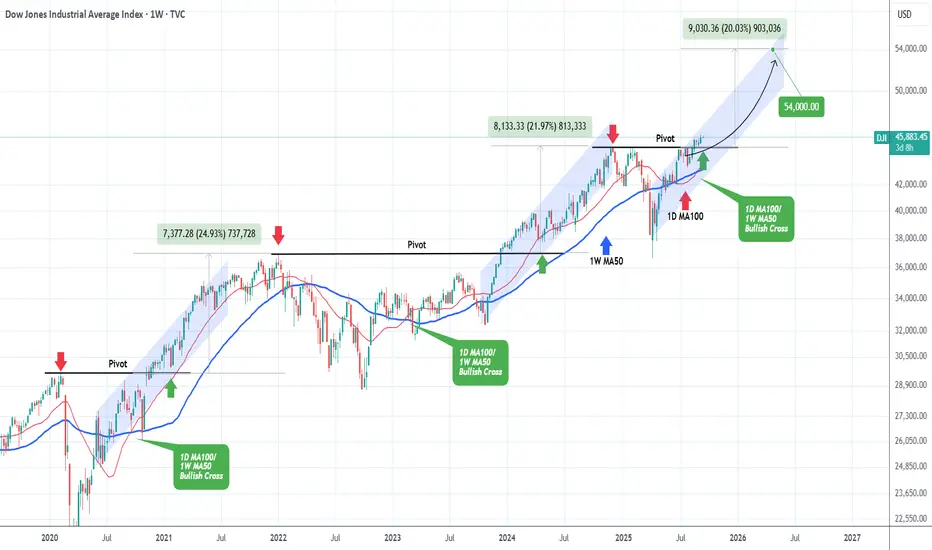
This time we switch to a much wider and longer term outlook on the 1W time-frame as we are just a day before the Fed Rate Decision. The index has been trading within a strong Channel Up ever since the April 07 2025 market bottom, product of the Trade War correction early in 2024.
The 1D MA100 (red trend-line) crossed above the 1W MA50 (blue trend-line) forming a peculiar Bullish Cross, which interestingly enough, it is the 3rd time we see it since September 2020.
As a result, it is highly critical and as you can see, after such cross, the 1W MA50 has historically led the index higher.
What is perhaps even more critical however is the Pivot trend-line, which is essentially the former All Time High (ATH) turned into Support for the Channel Up pattern that have pushed the market higher since 2020.
As you can see, that level always held and the two rallies that we've had on the pattern like the current one, completed +25% and +22% rallies above it before an eventually correction that broke below the 1W MA50.
As a result, we could see another +20% rise at least, translating into a 54000 long-term Target, as long as both the 1W MA50 and the Pivot hold.
-------------------------------------------------------------------------------
** Please LIKE 👍, FOLLOW ✅, SHARE 🙌 and COMMENT ✍ if you enjoy this idea! Also share your ideas and charts in the comments section below! This is best way to keep it relevant, support us, keep the content here free and allow the idea to reach as many people as possible. **
-------------------------------------------------------------------------------
💸💸💸💸💸💸
👇 👇 👇 👇 👇 👇
DOW JONES close to a Triangle break-out leading to 47500!Dow Jones (DJI) has been trading within a Channel Up pattern since April 24. Following the August 21 Low, it entered a short-term Ascending Triangle pattern, looking identical to May - June, which also started after a 4H MA50 (blue trend-line) test.
That pattern was a re-Accumulation phase, which after breaking upwards pushed the price just below its 2.5 Fibonacci extension.
With also similar 4H RSI sequences, we expect a similar reaction upon a Triangle break-out, targeting 47500 (Fib 2.5 extension).
-------------------------------------------------------------------------------
** Please LIKE 👍, FOLLOW ✅, SHARE 🙌 and COMMENT ✍ if you enjoy this idea! Also share your ideas and charts in the comments section below! This is best way to keep it relevant, support us, keep the content here free and allow the idea to reach as many people as possible. **
-------------------------------------------------------------------------------
💸💸💸💸💸💸
👇 👇 👇 👇 👇 👇

DOW JONES assisted by the 4H MA50 this Bullish Leg targets 47200Dow Jones (DJI) has turned its 4H MA50 (red trend-line) into Support and following the August 01 (Higher Low) bottom on the 1D MA50 (blue trend-line), it is extending the new Bullish Leg of the 4-month Channel Up.
With the 1D RSI also bouncing on its medium-term Support, this is a strong short-term buy signal. The previous two Bullish Legs both rose by a little over +9.00%. This gives us a 47200 Target on the short-term.
-------------------------------------------------------------------------------
** Please LIKE 👍, FOLLOW ✅, SHARE 🙌 and COMMENT ✍ if you enjoy this idea! Also share your ideas and charts in the comments section below! This is best way to keep it relevant, support us, keep the content here free and allow the idea to reach as many people as possible. **
-------------------------------------------------------------------------------
Disclosure: I am part of Trade Nation's Influencer program and receive a monthly fee for using their TradingView charts in my analysis.
💸💸💸💸💸💸
👇 👇 👇 👇 👇 👇

DOW JONES Double MA50 Support Zone coming to the rescue?Dow Jones (DJI) has been trading within a 4-month Channel Up and following the recent High, the price started to pull-back ahead of this week's major macroeconomic events.
By doing so, it has approached the 4H MA50 (blue trend-line), which has been the first line of Support inside this pattern. The previous (Higher) Low of the Channel Up was priced on the 1D MA50 (red trend-line) and the 2 form the strongest medium-term Support Zone at the moment.
With even the 4H RSI fractals identical, the current price action resembles the June 12 one, post 1D MA50 Low (May 23). Even if the 4H MA50 breaks, the trend will remain bullish unless it closes a 1D candle below the 1D MA50 (which would also be an invalidation of the Channel Up).
The most common rise on a Bullish Leg on this pattern has been +9.00%. As a result, our Target is 47200 as we enter September.
-------------------------------------------------------------------------------
** Please LIKE 👍, FOLLOW ✅, SHARE 🙌 and COMMENT ✍ if you enjoy this idea! Also share your ideas and charts in the comments section below! This is best way to keep it relevant, support us, keep the content here free and allow the idea to reach as many people as possible. **
-------------------------------------------------------------------------------
Disclosure: I am part of Trade Nation's Influencer program and receive a monthly fee for using their TradingView charts in my analysis.
💸💸💸💸💸💸
👇 👇 👇 👇 👇 👇

DOW JONES Holding the 1W MA50 can push it to 50900.Dow Jones (DJI) has been trading within a massive 3-year Channel Up (almost) and following the April 07 2025 rebound on its 1W MA200 (orange trend-line), it's been unfolding the new Bullish Leg.
Having established also the 1W MA50 (blue trend-line) as its Support in recent weeks, the pattern should now aim for its new Higher High long-term. Every time the index broke and stayed above its 1W MA50 during both previous Bullish Legs, a strong sustainable rally took place.
Given the similarities between their 1W MACD sequences as well as the fact that +39.51% has been a common long-term rise, we expect Dow to top next around 50900.
-------------------------------------------------------------------------------
** Please LIKE 👍, FOLLOW ✅, SHARE 🙌 and COMMENT ✍ if you enjoy this idea! Also share your ideas and charts in the comments section below! This is best way to keep it relevant, support us, keep the content here free and allow the idea to reach as many people as possible. **
-------------------------------------------------------------------------------
Disclosure: I am part of Trade Nation's Influencer program and receive a monthly fee for using their TradingView charts in my analysis.
💸💸💸💸💸💸
👇 👇 👇 👇 👇 👇

DOW JONES Channel Up on its strongest Support.Dow Jones (DJI) has been trading within a Channel Up since the April 25 Low and right now it is consolidating straight after a direct contact and bounce on the 1D MA50 (blue trend-line).
Given that this also took place at the bottom of the Channel Up, it is a technical Higher Low formation, thus the strongest Support level possible.
With the 1D RSI also rebounding around the same level as the previous Higher Low, we expect the next technical Bullish Leg of the Channel Up to begin. The previous two rose by at least +7.00%, so the minimum Target we are looking for on the short-term is 46350.
-------------------------------------------------------------------------------
** Please LIKE 👍, FOLLOW ✅, SHARE 🙌 and COMMENT ✍ if you enjoy this idea! Also share your ideas and charts in the comments section below! This is best way to keep it relevant, support us, keep the content here free and allow the idea to reach as many people as possible. **
-------------------------------------------------------------------------------
Disclosure: I am part of Trade Nation's Influencer program and receive a monthly fee for using their TradingView charts in my analysis.
💸💸💸💸💸💸
👇 👇 👇 👇 👇 👇
