DOW JONES Very clear bearish signal.Dow Jones (DJI) is approaching the top (Higher Highs trend-line) of the the 1.5 year Channel Up, while flashing a very unique medium-term sell signal. That is the 1W MACD Histogram, which is declining, a Bearish Divergence that during that period of time, has initiated 3 declines of more than -9% each.
Given the fact that the current Bullish Leg of the Channel Up has extended to almost 21.9%, which is almost as high as the October - December 2022 sequence, we are expecting a medium-term correction back to at least the middle of the Channel Up. Target is 37120 (Support 1) and if a 1W candle closes below the middle, we expect a bottom around the 1W MA50 (blue trend-line) at 36000 (Support 2).
-------------------------------------------------------------------------------
** Please LIKE 👍, FOLLOW ✅, SHARE 🙌 and COMMENT ✍ if you enjoy this idea! Also share your ideas and charts in the comments section below! This is best way to keep it relevant, support us, keep the content here free and allow the idea to reach as many people as possible. **
-------------------------------------------------------------------------------
💸💸💸💸💸💸
👇 👇 👇 👇 👇 👇
Dowsignals

DOW JONES Channel Up with the 4H as the key level.Dow Jones (DJI) is trading within a Channel Up pattern on the 4H time-frame with the 4H MA50 (blue trend-line) supporting since the January 19 break-out, being right on its bottom (Higher Lows trend-line). As long as the price action is closing candles above it, we remain bullish, targeting a Higher High at 39100.
If it closes a 4H candle below the 4H MA50, we will take the loss and sell instead, targeting the 1D MA50 (red trend-line) at 37800. Note that the last medium-term Support has been the 1D MA200 (orange trend-line) on January 18 and being overbought for too long on the 1D time-frame while the 4H RSI is on a Bearish Divergence throughout the index' whole Channel Up, a short-term correction to the 1D MA50, would technically be quite likely here.
-------------------------------------------------------------------------------
** Please LIKE 👍, FOLLOW ✅, SHARE 🙌 and COMMENT ✍ if you enjoy this idea! Also share your ideas and charts in the comments section below! This is best way to keep it relevant, support us, keep the content here free and allow the idea to reach as many people as possible. **
-------------------------------------------------------------------------------
💸💸💸💸💸💸
👇 👇 👇 👇 👇 👇

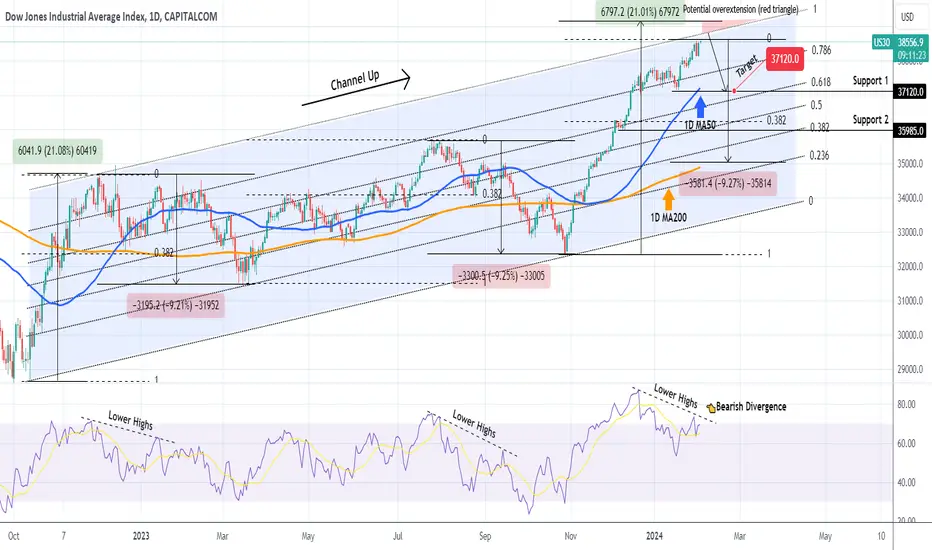
DOW JONES at the top of the 18month Channel Up. Medium-term SellDow Jones has been trading within a 18-month Channel Up pattern since the October 13 2022 global market bottom. The current price action is approaching its top (Higher Highs trend-line) for the first time in more than 1 year (since December 13 2022). With the 1D RSI on Lower Highs, which is a Bearish Divergence against the Higher Highs of the price action, the current levels are a strong candidate for a medium-term pull-back.
Even though we are past the transition year of 2023, which got the index out of the 2022 Bear Cycle and into the new Bull Cycle, thus we do not necessarily need a strong correction like those of August - October 2023 and December 2022 - March 2023, a smaller technical pull-back would be natural to normalize the overbought technical indicators and extend the long-term bullish trend.
As a result, we are targeting at least 37120, which is Support 1 and just above the 0.618 Fibonacci Channel level, the first target of the December 19 2022 pull-back and a typical % correction similar to August 24 and May 25 2023.
Not that the 1D RSI was under a Lower Highs trend-line both during the August 2023 and December 2022 corrections. Interestingly enough, both corrected by -9.20%, so technically we can see a correction as low as the 1D MA200 (orange trend-line) and the 0.236 Fibonacci Channel level at 35000 (even though it is less likely unless very negative fundamentals hit the market). Also it is worth pointing out that there is a technical maximum extension above the Channel Up, which is the red Triangle, in case the current Bullish Leg of the pattern goes for a +21% rise, like the December 01 2022 did.
-------------------------------------------------------------------------------
** Please LIKE 👍, FOLLOW ✅, SHARE 🙌 and COMMENT ✍ if you enjoy this idea! Also share your ideas and charts in the comments section below! This is best way to keep it relevant, support us, keep the content here free and allow the idea to reach as many people as possible. **
-------------------------------------------------------------------------------
💸💸💸💸💸💸
👇 👇 👇 👇 👇 👇
Most overbought condition 1) Most overbought condition since May 2021 on the weekly RSI 14.
2) Converging trendlines at 38,200 stretching back since late 2021 create solid roof tested 3 times at least on 2 separate trend-lines which would make for a very tough level to break, especially when it's this overbought.
***A correction down to retest the connecting lows trend-line since late 2022 would make a lot of sense even if a new high would be reached in the future, a correction down is very likely in the current technical condition - Which would be down to the 34,200 floor.

DOW JONES Correction has started. Where can it stop?Dow Jones (DJI) started a strong decline since our December 29 2023 sell call (see chart below), the strongest since the remarkable rally started on the October 29 bottom:
On today's analysis, we want to look into the same market dynamics and the pattern we drew 10 days ago but this time on the 1D time-frame. What stands out the most is that this time on the January 02 2024 High, the RSI peak that was made a few days back on December 19 2023 (hence the Bearish Divergence) was a (much) Higher High that the previous two (red arrows down) on the Higher Highs trend-line (July 26 2023 and April 13 2023), that was made on the vastly overbought level of 87.50 (highest since January 11 2018).
Our short-term target remains 36750, which represents the 0.618 Fibonacci retracement level from the Jan 02 High. The other feature on this 1D chart that stands out is the 38.50 1D RSI Support, which provided rebounds on May 25 2023 (long-term) and August 24 2023 (short-term). That RSI Support reveals where our first buy attempt should be. Price-wise that could be as low was the 0.5 Fibonacci retracement level (35100) of the October 27 Low. By the time it potentially makes contact with it, the 1D MA200 (orange trend-line) could be there as well.
A medium-term candidate is also a -4.50% range from the Jan 02 High, which would give us 36150 and is where the 1D MA50 (blue trend-line) is headed right now.
-------------------------------------------------------------------------------
** Please LIKE 👍, FOLLOW ✅, SHARE 🙌 and COMMENT ✍ if you enjoy this idea! Also share your ideas and charts in the comments section below! This is best way to keep it relevant, support us, keep the content here free and allow the idea to reach as many people as possible. **
-------------------------------------------------------------------------------
💸💸💸💸💸💸
👇 👇 👇 👇 👇 👇

DOW JONES Huge Bearish Divergence on 4HDow Jones (DJI) is trading within a very aggressive Channel Up since the October 27 bottom that has seen it rise almost by +17%, making new a All Time High (ATH) in the process. In the meantime it is about to hit the Higher Highs trend-line that has been acting as a Resistance, rejecting similar Channel Up patterns since April 14.
What is more alarming than this Resistance, is the Channel Down that has emerged on the 4H RSI. The other two similar Channel Down patterns that emerged after the RSI got overbought, did so right before the index peaked on the Higher Highs trend-line, starting two corrective Bearish Megaphone patterns. Those structures reached at least the 0.5 Fibonacci retracement level measured from the previous Higher Low, and the 0.618 Fibonacci level from the bottom of the (blue) Channel Up.
Based on this occurrence, we expect yet another Higher Highs rejection that will test at least the 0.618 Fib at 36750, which is our current sell target. Potentially, if the selling pressure is pilled up and transitions to the 1D time-frame, it can reach as low as the 0.5 Fibonacci from the October bottom at 35150.
-------------------------------------------------------------------------------
** Please LIKE 👍, FOLLOW ✅, SHARE 🙌 and COMMENT ✍ if you enjoy this idea! Also share your ideas and charts in the comments section below! This is best way to keep it relevant, support us, keep the content here free and allow the idea to reach as many people as possible. **
-------------------------------------------------------------------------------
💸💸💸💸💸💸
👇 👇 👇 👇 👇 👇

DOW JONES Channel Up still holding, aiming at All Time Highs.Dow Jones (DJI) maintains its bullish trade within the Channel Up pattern that started on the October 27 Low. The 4H MA50 (blue trend-line) has been supporting since November 01 and as long as it continues to do so, the index is more likely to test the 36975 All Time High (Jan 05 2022). Especially since it is currently on a 4H MACD Bullish Cross.
The previous two MACD Bullish Crosses have delivered rises of around +2.70% to the top of the Channel Up. Another +2.70% rise will send the price above 37000 and that is our target. If however the index closes below the 4H MA50, we will take the long's loss and reverse to a short immediately, targeting the bottom of the Channel Up. If the price closes below it, we will re-sell and target Support 1 at 35300, where potentially contact with the 4H MA200 (orange trend-line) can be made for the first time since November 02.
-------------------------------------------------------------------------------
** Please LIKE 👍, FOLLOW ✅, SHARE 🙌 and COMMENT ✍ if you enjoy this idea! Also share your ideas and charts in the comments section below! This is best way to keep it relevant, support us, keep the content here free and allow the idea to reach as many people as possible. **
-------------------------------------------------------------------------------
💸💸💸💸💸💸
👇 👇 👇 👇 👇 👇

DOW I Continued strong development is indicatedWelcome back! Let me know your thoughts in the comments!
** DOW Analysis - Listen to video!
We recommend that you keep this pair on your watchlist and enter when the entry criteria of your strategy is met.
Please support this idea with a LIKE and COMMENT if you find it useful and Click "Follow" on our profile if you'd like these trade ideas delivered straight to your email in the future.
Thanks for your continued support!

DOW JONES Pull-back or Santa rally?It's more than 2 weeks since we looked into Dow Jones (DJI), giving a bullish rebound signal on the 1D MA50 (see chart below) that quickly hit its target:
The price is now significantly above the 0.786 Fibonacci retracement level, which is roughly where the previous bullish wave of March - April took a medium-term pause and pulled-back first to the 1D MA50 (blue trend-line) and then to the 1D MA200 (orange trend-line). The % rise so far though (+9.50%) is almost the same as April's (+9.03%).
With the 1D RSI however printing a sideways sequence on the 70.00 overbought mark, very similar to April's, it is worth attempting now a sell targeting the 1D MA50 and the 0.382 Fibonacci level at 34300. Since however we are very close to the (seasonaly bullish) Christmas period, if Resistance 1 (35700) breaks, we will take the loss on the short and instead buy towards the top of the 12 month Channel Up and target 36300, as part of the so called Santa's rally.
-------------------------------------------------------------------------------
** Please LIKE 👍, FOLLOW ✅, SHARE 🙌 and COMMENT ✍ if you enjoy this idea! Also share your ideas and charts in the comments section below! This is best way to keep it relevant, support us, keep the content here free and allow the idea to reach as many people as possible. **
-------------------------------------------------------------------------------
💸💸💸💸💸💸
👇 👇 👇 👇 👇 👇

DOW JONES Inverse Head and Shoulders signals for a new buyDow Jones (DJI) has completed an Inverse Head and Shoulders (IH&S) pattern and this week's pull-back, caused by a rejection on the 4H MA200 (orange trend-line), may be the last before it starts rising to a new Higher High. We are taking this opportunity to buy for the short-term and target the top of the dashed Channel at 34200. The IH&S can complete its long-term target on the 2.0 Fibonacci level (35000) after it breaks above the Lower Highs trendline.
-------------------------------------------------------------------------------
** Please LIKE 👍, FOLLOW ✅, SHARE 🙌 and COMMENT ✍ if you enjoy this idea! Also share your ideas and charts in the comments section below! This is best way to keep it relevant, support us, keep the content here free and allow the idea to reach as many people as possible. **
-------------------------------------------------------------------------------
💸💸💸💸💸💸
👇 👇 👇 👇 👇 👇

DOW JONES Channel Up Double Bottom. Solid buy entry either way.Dow Jones (DJI) is rising following a vastly oversold 1D RSI reading (reached even 23.60) at the bottom of the (blue) Channel Up. Based on the RSI pattern itself, we can draw comparisons with the December 2022 - March 2023 correction. According to that the 1D RSI has one more Low to make before it bottoms and that bottom will be leg (e). This will justify the emergence of a diverging Channel Up (dotted), where leg (e) will be its Higher Low while also completing a symmetrical -9.30% decline from the top.
Still, the price has dipped well below the 1D MA200 (orange trend-line), which was March's bottom formation, thus either entry is equally probable. As a result it is best to buy on both levels so that a low risk indeed opportunity won't be missed. Our target is 35000, which is the 0.786 Fibonacci retracement level as well as Resistance 1.
-------------------------------------------------------------------------------
** Please LIKE 👍, FOLLOW ✅, SHARE 🙌 and COMMENT ✍ if you enjoy this idea! Also share your ideas and charts in the comments section below! This is best way to keep it relevant, support us, keep the content here free and allow the idea to reach as many people as possible. **
-------------------------------------------------------------------------------
💸💸💸💸💸💸
👇 👇 👇 👇 👇 👇

DOW JONES Approaching a critical Support cluster.The Dow Jones index (DJI) has broken below the long-term Higher Lows trend-line and has transitioned into a Channel Down. The current Lower Lows leg is approaching not just the bottom of the Channel Down but more importantly the 1D MA200 (orange trend-line) and the 1W MA50 (red trend-line). The latter in particular provided a Double Support Bounce on (June 01 and May 25) and hasn't been broken since March 29.
We are waiting for the first 2-day green 1D candle streak in order to buy and target (at least) the 1D MA50 (blue trend-line). Projected contact at 34450 (target). The 1D RSI has hit the 34.80 Support, which provided the bounce on the August 24 bottom.
-------------------------------------------------------------------------------
** Please LIKE 👍, FOLLOW ✅, SHARE 🙌 and COMMENT ✍ if you enjoy this idea! Also share your ideas and charts in the comments section below! **
-------------------------------------------------------------------------------
💸💸💸💸💸💸
👇 👇 👇 👇 👇 👇

DOW JONES Strong bullish leg within a Bullish Megaphone.Dow Jones (DJI) gave us a strong bottom buy signal 8 days ago (see chart below):
On today's idea we look at the 1H time-frame, which offers a buy opportunity for quick 1-2 day profit as the index is on a strong bullish leg within a newly formed Bullish Megaphone. Based on the 1H RSI which turned overbought and the 1H MACD which just formed a Bearish Cross, this sequence resembles the August 28 - 31 fractal and we could be on a similar position as on August 30.
That was the final consolidation before the bullish leg made its peak on Resistance 1 (35100). Due to the Bullish Megaphone, this time it can go a little higher, so today's buy position targets 35150.
-------------------------------------------------------------------------------
** Please LIKE 👍, FOLLOW ✅, SHARE 🙌 and COMMENT ✍ if you enjoy this idea! Also share your ideas and charts in the comments section below! **
-------------------------------------------------------------------------------
💸💸💸💸💸💸
👇 👇 👇 👇 👇 👇

DOW JONES 1st 1W Bullish Cross since 2016. Can we see 42k next?Dow Jones (DJI) is forming this week the first MA50 (blue trend-line) / MA100 (green trend-line) Bullish Cross (when the former crosses above the latter) on the 1W time-frame since September 2016 (assuming January/ February 2021 was flat due to the COVIC flash crash).
This on its own is a major long-term buy signal, especially since the 1W MA50 has been supporting since March. As you can see the 2022 - 2023 price action is very similar to the 2015 - 2016 sequence. Both fractals started on a Bear Cycle under Lower Highs, which bottomed after marginally breaking below the 1W MA200 (orange trend-line). The new Bull Cycle was confirmed after the price broke above the Lower Highs trend-line and turned it into a Support being formerly a Resistance. The 1W MA50/100 Bearish Cross signified the bottom. Notice how even the 1W RSI and 1W MACD fractals are identical with their respective Higher Lows.
It appears that Dow is currently past the initial Channel Down and on the Circle pattern, which in 2016 was the final consolidation before a hyper aggressive rally that topped in January 2018. Before that top it reached the 1.5 and 1.786 Fibonacci extensions.
We treat the current pull-back as the last opportunity to buy this upcoming rally while the price is still that low. Having relatively low expectations, we expect to see at least 42000 (1.5 Fibonacci) by the end of Q1 - start of Q2 2024.
-------------------------------------------------------------------------------
** Please LIKE 👍, FOLLOW ✅, SHARE 🙌 and COMMENT ✍ if you enjoy this idea! Also share your ideas and charts in the comments section below! **
-------------------------------------------------------------------------------
💸💸💸💸💸💸
👇 👇 👇 👇 👇 👇

DOW JONES Last buy opportunity on the 1D MA50.Dow Jones (DJI) got rejected on August 31 on the 4H MA200 (orange trend-line) and that made the price pull-back. We are now close to the 1D MA50 (red trend-line) again, which is where the initial rebound started on August 25, exactly at the bottom (Higher Lows trend-line) of the Channel Up.
This is the final buy opportunity on this pattern, as any closing below it would be a pattern invalidation and the trend would change to bearish on the long-term. Key to this, is the formation of a 4H Golden Cross, which could be only 4-5 days away. The last such formation was on June 09 and as with the one that preceded that, it will be a bullish signal.
We will wait for either a new 1D MA50 test or a completed 4H Golden Cross in order to buy with the lowest risk possible. Target 1 will be 36000 and Target 2 36900 (just below the All Time High).
-------------------------------------------------------------------------------
** Please LIKE 👍, FOLLOW ✅, SHARE 🙌 and COMMENT ✍ if you enjoy this idea! Also share your ideas and charts in the comments section below! **
-------------------------------------------------------------------------------
💸💸💸💸💸💸
👇 👇 👇 👇 👇 👇

DOW JONES sets course for the All Time High in the next 2 monthsDow Jones (DJI) held its 1D MA100 as Support and as projected on our analysis last week (see chart below), it formed a Higher Low on the 5-month Channel Up and rebounded:
We now move to the 1W time-frame where this week's 1W candle is so far the strongest since July 17 and already recovered the 1D MA50 (red trend-line). After completing the standard -4.70% correction to the Channel's bottom, the norm within this pattern is to first post a +6.15% rise and ultimately complete the Higher High with a +9.00%. As a result, our short-term target is 36100 (+6.15%) and by the end of October 36960 (+9.00%), which is the All Time High since January 2022!
-------------------------------------------------------------------------------
** Please LIKE 👍, FOLLOW ✅, SHARE 🙌 and COMMENT ✍ if you enjoy this idea! Also share your ideas and charts in the comments section below! **
-------------------------------------------------------------------------------
💸💸💸💸💸💸
👇 👇 👇 👇 👇 👇

DOW JONES Buy opportunity after strongest correction since May.Dow Jones (DJI) is consolidating under the 1D MA50 (blue trend-line) for the 5th straight day and is doing so near the bottom of the 5-month just above the 1D MA50 (green trend-line). The latter has been intact since June 02, so technically we are at a very strong Support zone. In fact August's decline so far has been the strongest technical correction since May.
The lower buy confirmation will come after the 1D MACD forms a Bullish Cross, but you can also take the break-out buy signal if a 1D candle closes above the 1D MA50 first. In any case, our bullish target is 36300, which would represent a +6.13% rise, the minimum rise % since the Channel Up started on March 15.
If however the 1D candle closes below the 1D MA100, we will take a quick sell and target the 1D MA200 (orange trend-line) at 33800. Upon successful hitting of the target, we will add the 2nd buy position and use it for a longer term target at 36900.
-------------------------------------------------------------------------------
** Please LIKE 👍, FOLLOW ✅, SHARE 🙌 and COMMENT ✍ if you enjoy this idea! Also share your ideas and charts in the comments section below! **
-------------------------------------------------------------------------------
💸💸💸💸💸💸
👇 👇 👇 👇 👇 👇

DOW JONES The Inverse Head & Shoulders no-one is talking about.The Dow Jones (DJI) index remains within its 5 month Channel Up pattern that started in mid March and recently hit its top. What the majority of the market is missing is a stronger pattern on the wider 1W time-frame. This long-term chart shows that an Inverse Head and Shoulders (IH&S) pattern priced its Head (bottom) when the Channel Up started and completed the Right Shoulder on the first week of July.
As a result, the aggressive 3 week rally that followed is a natural consequence of the completion of that pattern, similar to the October - November 2022 rally that led to the start of the IH&S. Such patterns can technically target as high as the 2.0 Fibonacci extension level, which sits just above the 36975 All Time High. As the 1W RSI is bounce on a Pivot level (formerly a Resistance), we have more reasons to continue to be bullish in this market and target first the 35900 Resistance and ultimately the ATH at 36975, potentially all within the boundaries of the Channel Up.
-------------------------------------------------------------------------------
** Please LIKE 👍, FOLLOW ✅, SHARE 🙌 and COMMENT ✍ if you enjoy this idea! Also share your ideas and charts in the comments section below! **
-------------------------------------------------------------------------------
💸💸💸💸💸💸
👇 👇 👇 👇 👇 👇

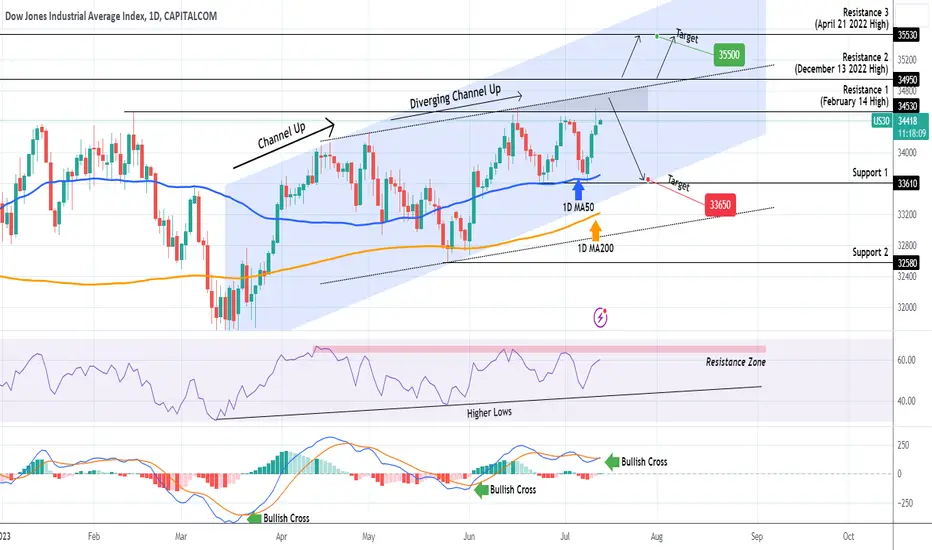
DOW JONES getting closer to Resistance Zone for a technical sellIt's been a while since we looked into Dow Jones (DJI) and made the bottom buy on the Channel Up last Higher Low (chart below):
Right now the index is rising after a rebound on a Double Bottom on the 1D MA50 (blue trend-line). The dominant pattern is a Channel Up and the secondary a Diverging Channel Up (dotted lines) that forms a Higher Highs rejection zone within Resistance 1 (34530) and its top. We will look for a sell on the next candle inside it (ideally with the 1D RSI on its Resistance Zone) and target the bottom of the Channel Up at 33650 near Support 1.
If however the price breaks above Resistance 2 (34950) and the MACD maintains the Bullish Cross it is forming today, we will open a buy and target 33500 (just below Resistance 3).
-------------------------------------------------------------------------------
** Please LIKE 👍, FOLLOW ✅, SHARE 🙌 and COMMENT ✍ if you enjoy this idea! Also share your ideas and charts in the comments section below! **
-------------------------------------------------------------------------------
💸💸💸💸💸💸
👇 👇 👇 👇 👇 👇
DOW JONES Small pull-back possible but bullish long-termOne and a half month ago we gave the most optimal buy entry for Dow Jones (DJI) exactly at the bottom of its 4-month Channel Down:
Right now the index is trading inside a shorter term Channel Up that is technically aiming at the 34900 Resistance, which is the December 13 2022 High, as part of its Higher Highs process. If however the 4H MACD currently completes a Bearish Cross, it is more likely to see one last pull-back below the 4H MA50 (blue trend-line) and near the 0.618 Fibonacci retracement level (33600) before the next rally.
-------------------------------------------------------------------------------
** Please LIKE 👍, FOLLOW ✅, SHARE 🙌 and COMMENT ✍ if you enjoy this idea! Also share your ideas and charts in the comments section below! **
-------------------------------------------------------------------------------
💸💸💸💸💸💸
👇 👇 👇 👇 👇 👇

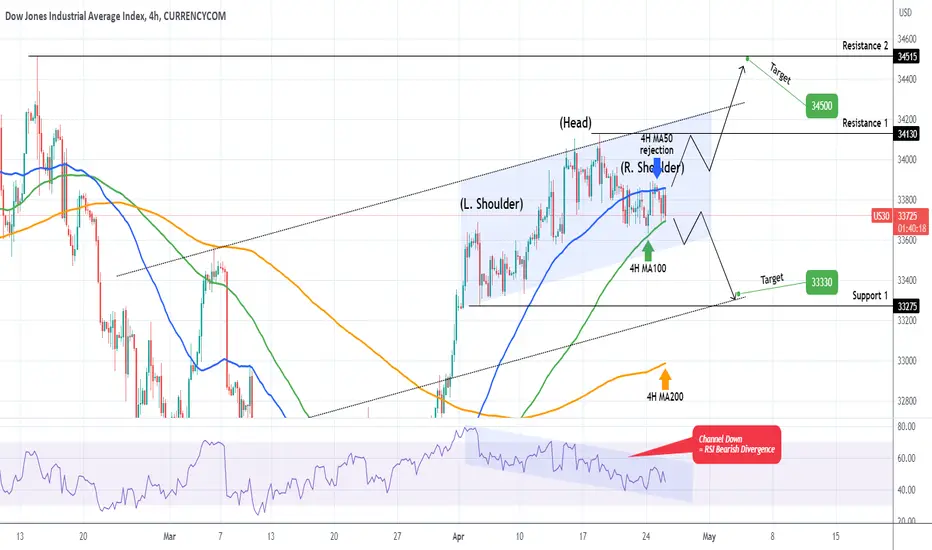
DOW JONES Potential Head & Shoulders and invalidation level.Almost a month ago we gave the most optimal buy entry for Dow Jones (DJI) exactly at the bottom of its 4-month Channel Down:
Right now, we see an emerging Head and Shoulders (H&S) pattern, which is a technical pattern typically formed on market tops. The key now is the 4H MA100 (green trend-line). A closing below it, will most likely accelerate the pull-back towards Support 1, in which case we will target 33330.
A 4H candle close above 4H MA50 (blue trend-line) will be a bullish break-out signal and should invalidate the H&S pattern, targeting first Resistance 1 and Resistance 2 in extension, in which case our Target will be 34500.
Note the the 4H RSI has been inside a Channel Down since April 04, thus a big Bearish Divergence when compared to the price's Channel Up.
-------------------------------------------------------------------------------
** Please LIKE 👍, FOLLOW ✅, SHARE 🙌 and COMMENT ✍ if you enjoy this idea! Also share your ideas and charts in the comments section below! **
-------------------------------------------------------------------------------
💸💸💸💸💸💸
👇 👇 👇 👇 👇 👇
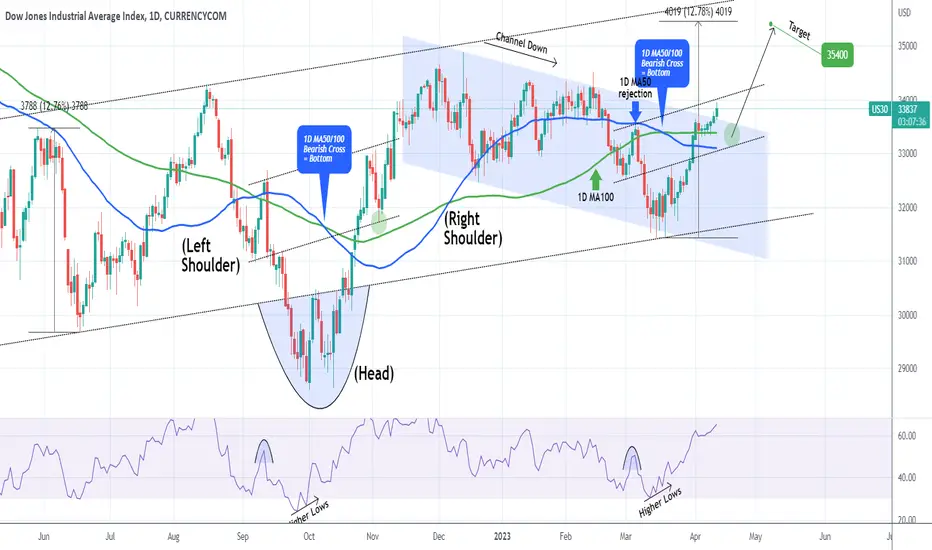
DOW JONES Broke above the Channel Down. Nothing can stop it.Almost a month ago we gave the most optimal buy entry for Dow Jones (DJI) exactly at the bottom of its 4-month Channel Down:
The price has hit our medium-term target and zooming out into the longer term horizon we can see the grand pattern being an Inverse Head and Shoulders (IH&S). This is a bullish reversal formation, in fact it may be characterized as the bottom formation of the 2022 Bear Phase.
The long-term target can be as high as the Shoulders Resistance, the Higher Highs trend-line. If it is inversely symmetrical to June, we can expect a +12.78% rise. This gives us a target for the next 4 weeks at 35400.
Note that if it follows the late October 2022 rally, then it is possible to give one last pull-back within the 1D MA50 (blue trend-line) and 1D MA100 (green trend-line) before our target is materialized.
-------------------------------------------------------------------------------
** Please LIKE 👍, FOLLOW ✅, SHARE 🙌 and COMMENT ✍ if you enjoy this idea! Also share your ideas and charts in the comments section below! **
-------------------------------------------------------------------------------
💸💸💸💸💸💸
👇 👇 👇 👇 👇 👇
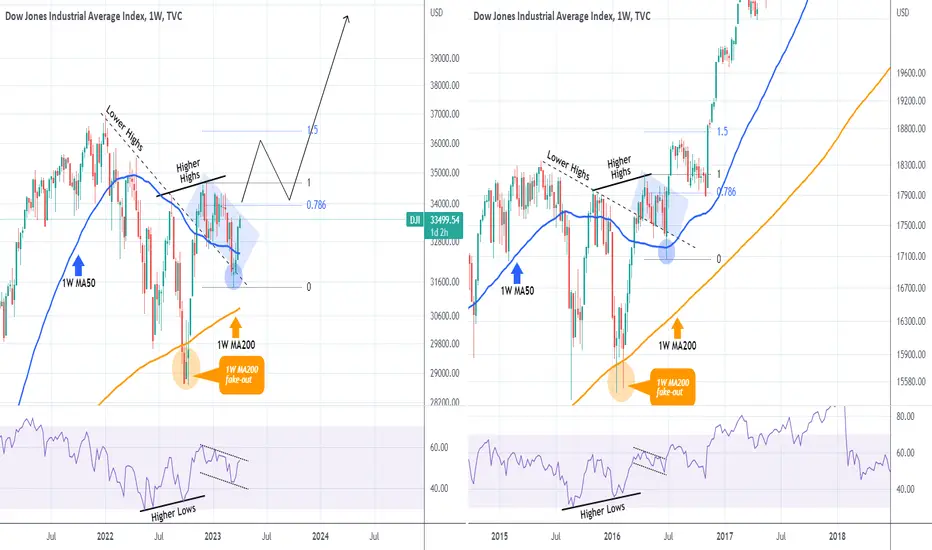
DOW JONES has started a rally that will amaze mostDow Jones is currently on the 3rd straight green 1W (weekly) candle above the 1W MA50 (blue trend-line), testing the top of the 4-month Channel Down. We have previously seen almost the same pattern during the 2015-2016 correction (E.U./ China/ Oil crisis). A fake-out below the 1W MA200 (orange trend-line) initiated a rebound above the correction's Lower Highs trend-line and formed a Channel Down.
This Channel Down in 2016 was nothing but a Bull Flag pattern which after another fake-out, this time below the 1W MA50, it rebounded and almost reached the 1.5 Fibonacci extension with a final pull-back on Fib 0.786 that kick-started a very aggressive rally. Even the 1W RSI patterns match. Do you think that's the blue-print for Dow?
-------------------------------------------------------------------------------
** Please LIKE 👍, FOLLOW ✅, SHARE 🙌 and COMMENT ✍ if you enjoy this idea! Also share your ideas and charts in the comments section below! **
-------------------------------------------------------------------------------
💸💸💸💸💸💸
👇 👇 👇 👇 👇 👇