Bitcoin may Rally Back Towards the 118000 ResistanceHello traders, I want share with you my opinion about Bitcoin. The market for Bitcoin has experienced extreme volatility recently, with a powerful rally to a new all-time high near 126000 being completely erased by a sharp, news-driven decline down to 101000. This dramatic price swing has reset the market structure. Since that low, however, the price of BTC has staged a significant recovery, breaking back above the major 109500 support level and showing strong signs of a bullish reversal. Currently, the asset is in a minor corrective phase after this initial powerful rebound. In my mind, the strong reversal from the lows indicates that the sell-off was overdone and buyers are now re-engaging. I expect that the price will make a small corrective movement down to retest the major support level around 109500. I think a successful defense of this level, which also aligns with the buyer zone, will confirm the recovery is sustainable and will trigger the next major rally. Therefore, I have placed my TP at the 118000 resistance level, targeting the top of the prior consolidation range. Please share this idea with your friends and click Boost 🚀
Disclaimer: As part of ThinkMarkets’ Influencer Program, I am sponsored to share and publish their charts in my analysis.
DROP

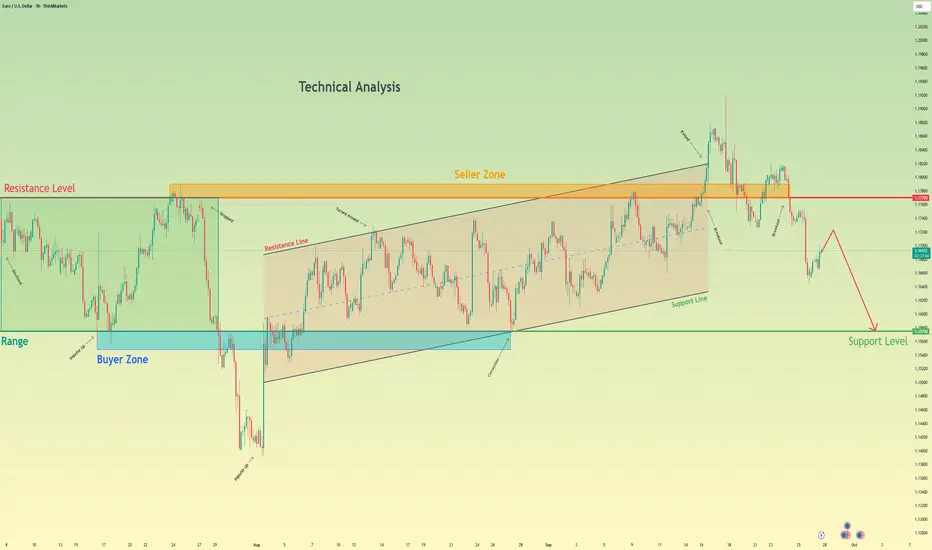
Euro will Fall Towards the 1.1575 Support LevelHello traders, I want share with you my opinion about Euro. The market for the Euro has recently shown a significant sign of weakness, with a failed breakout above the key 1.1770 Resistance Level. After a sustained rally within an upward channel, the price of EURUSD pushed into the 1.1770 - 1.1790 seller zone but failed to find acceptance, quickly reversing back below the broken levels. This 'bull trap' has invalidated the immediate bullish momentum and shifted the short-term market structure to a bearish bias. Currently, after the initial sharp decline from the highs, the asset is in a minor corrective bounce. In my mind, this price action represents a low-momentum pause before the next wave of selling. I expect that this small upward movement will soon be exhausted, and the price will continue its bearish movement downwards. A failure to produce a strong rally from these levels confirms that sellers have regained control. Therefore, I have placed my TP for this trend-continuation scenario at the major 1.1575 support level. This target is a logical objective, as it represents the next significant area of historical support and aligns with the 1.1575 - 1.1548 buyer zone. Please share this idea with your friends and click Boost 🚀
Disclaimer: As part of ThinkMarkets’ Influencer Program, I am sponsored to share and publish their charts in my analysis.
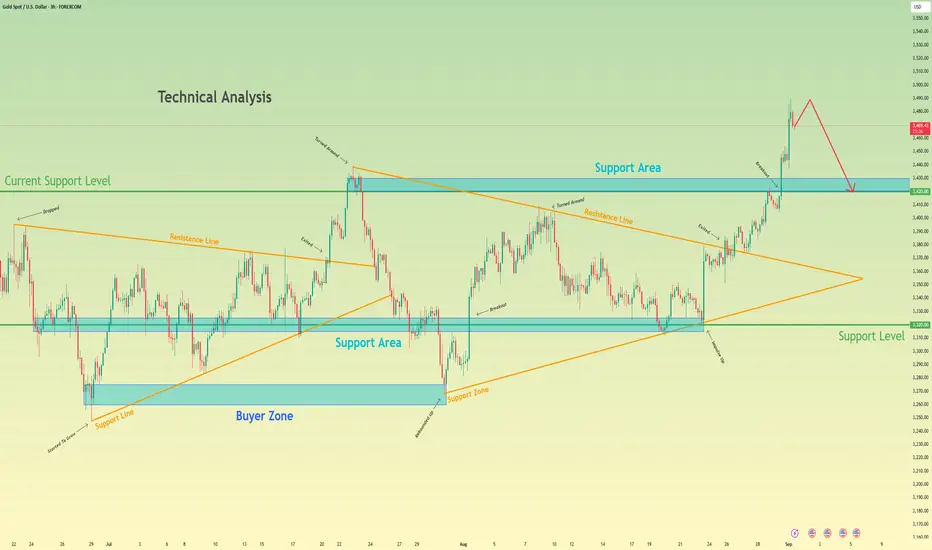
Gold may make correction, after strong upward movementHello traders, I want share with you my opinion about Gold. The prolonged period of consolidation for Gold has decisively resolved to the upside, following a powerful breakout from a multi-week symmetrical wedge. This event signalled a clear shift in market control to buyers, invalidating the prior ranging environment and initiating a new, impulsive bullish phase. The price action for XAU since the breakout has been characterised by a strong, high-momentum rally that has pushed the asset to new highs. Currently, this upward movement appears to be overextended, suggesting that the market may be due for a healthy corrective pull-back. The primary working hypothesis is a short, counter-trend scenario designed to capture this anticipated correction. The expectation is that the current rally will soon find a peak, exhaust itself, and undergo a sharp decline back towards the breakout point. This corrective fall would be a natural part of a healthy uptrend, allowing the market to test the old resistance as new support. Therefore, the TP is logically placed at the 3420 level. This target is highly significant as it corresponds precisely with the current support level and the support area where the breakout originated. Please share this idea with your friends and click Boost 🚀
EURUSD Short: Drop from Supply LevelHello, traders! The price auction for EURUSD has been characterized by a period of consolidation, which has formed a large symmetrical triangle. This pattern of contracting volatility was established by a series of key pivot points, with a pivot point high anchoring the 1.1720 supply area and a pivot point low defining the 1.1575 demand area. These actions have set the stage for the current state of market equilibrium, squeezing the price between the supply line and the demand line.
Currently, the auction is at a critical inflection point. Following a bounce from the ascending demand line, the price has rallied across the pattern and is now directly testing the descending supply line. This area represents a significant confluence of resistance, as it aligns with the horizontal 1.1720 - 1.1740 supply zone, a known territory of seller activity.
The primary scenario anticipates that sellers will successfully defend this resistance confluence and reject the current rally. A confirmed failure to break above the supply line would validate the integrity of the triangle pattern and likely initiate a new downward rotation. This would shift the short-term initiative back to the bears. The take-profit for this rotational play is therefore set at 1.1620, targeting the ascending demand line. Manage your risk!

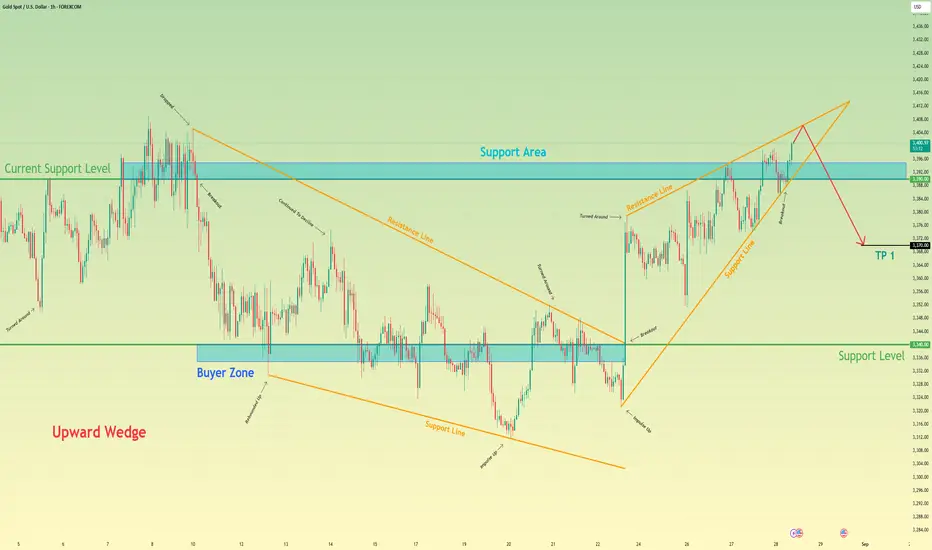
Gold will start to decline and then exit from wedgeHello traders, I want share with you my opinion about Gold. The market dynamic for XAUUSD has seen a significant evolution, transitioning from a corrective falling wedge into a new bullish phase after a powerful breakout from the lows. This upward trend has since matured and taken the shape of a large upward wedge, a pattern that has been guiding the price higher through a series of rebounds and corrections. This formation, while bullish in the short term, often signals potential trend exhaustion as it approaches its apex. Currently, the price action for XAU is at a critical juncture, pushing up against the upper resistance line of this wedge. The primary working hypothesis is a short scenario, which is predicated on the common bearish resolution of a rising wedge pattern. It is anticipated that the asset will be rejected from this resistance line, signalling that buying momentum is waning. A confirmed failure at this peak would likely trigger a sharp reversal, with enough selling pressure to cause a breakdown below the wedge's ascending support line and the current support level of 3390. This structural failure would validate the bearish thesis and initiate a new downward leg. Therefore, the TP is logically set at 3370 points, representing a prudent first objective for the price to achieve following the anticipated breakdown of the wedge structure. Please share this idea with your friends and click Boost 🚀
EURUSD: The Pump Before the DumpHello everyone, here is my breakdown of the current EURUSD setup.
Market Analysis
From a broader perspective, the price has been consolidating within a large symmetrical triangle. This has created a well-defined range between the support zone at 1.1545 and the resistance zone at 1.1760, indicating market balance.
Currently, the price is rallying towards the upper boundary of this triangle after a bounce from its support line. This move is taking price directly into the key resistance area of 1.1740 - 1.1760.
My Scenario & Strategy
My scenario is built on a critical recent signal: the 'fake breakout'. The price pushed above the triangle's resistance but was forcefully rejected from the 1.1740 resistance level, showing strong seller control at the highs.
I expect this current rally to be a second test of that same seller-controlled territory. My anticipation is that the price will again fail to find acceptance above the triangle's resistance line, confirming the bearish pressure.
Therefore, the strategy is to watch for this rejection, as it would validate the short scenario and likely trigger a rotation downwards. The primary target is the 1.1565 level, aligning with the support zone between 1.1565 and 1.1545 area.
That's the setup I'm tracking. Thank you for your attention, and always manage your risk.

XAUUSD Short: Reversal Expected from the Supply ZoneHello, traders! The price auction for XAUUSD has been consolidating for an extended period within a large symmetrical triangle. This pattern was defined by key pivot points, establishing the upper supply line and the lower demand line. This phase of balance saw volatility contract significantly as the market approached the apex of the formation, building energy for a decisive move.
Currently, this state of equilibrium has been resolved with a bullish breakout. XAUUSD has pushed above the descending supply line and has completed a retest, confirming the line as new support. This bullish price action is now driving the auction upwards, directly towards the major horizontal supply zone, which begins at the 3400 level.
The primary scenario anticipates that this breakout is a final exhaustive move into a major resistance area. The rally is expected to fail upon entering the 3400 - 3410 supply zone. A confirmed rejection here would suggest a 'bull trap' has occurred, likely initiating a sharp reversal. The take-profit for this scenario is therefore set at 3340 points, targeting the recent breakout area. Manage your risk!

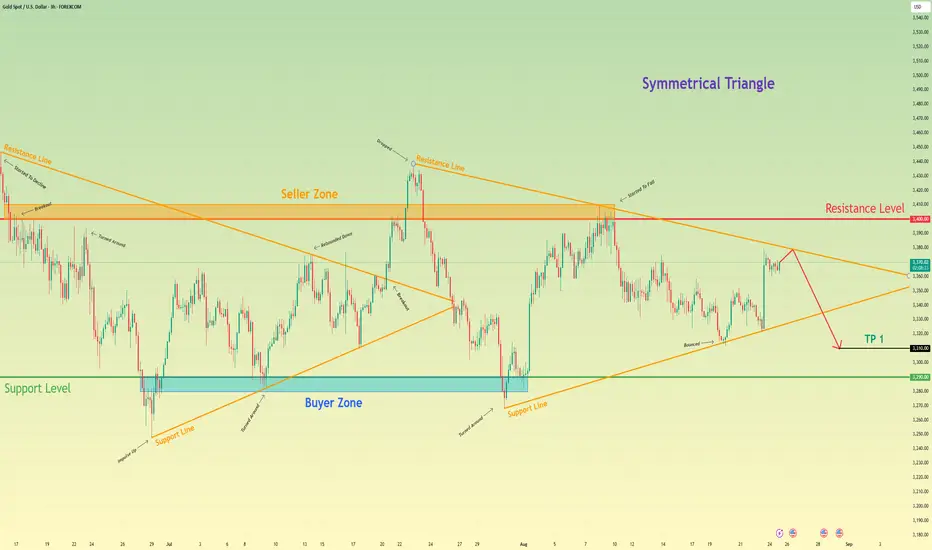
Gold will drop from resistance line of triangle to 3310 pointsHello traders, I want share with you my opinion about Gold. The market for Gold is currently defined by a large symmetrical triangle, a pattern of equilibrium that has formed after a strong rebound from the 3290 buyer zone halted the previous downward trend. This new market structure indicates a period of contracting volatility, with the price action for XAU being methodically squeezed between a descending resistance line and an ascending support line. These boundaries are anchored by the major seller zone around the 3400 resistance level and the aforementioned 3290 buyer zone. At present, the asset is at a critical inflection point, having rallied to test the descending resistance line of this triangle. The primary working hypothesis is a short scenario, based on the expectation that the 3400 seller zone will hold and that sellers will re-emerge to defend this territory. A confirmed rejection from this upper boundary would validate the integrity of the symmetrical triangle and likely initiate another major downward rotation within the pattern. This fall would target the ascending support line and the underlying horizontal support. Therefore, the TP for this rotational play is logically placed at 3310 points. Please share this idea with your friends and click Boost 🚀
Euro can reach resistance line of pennant and then dropHello traders, I want share with you my opinion about Euro. The price of the Euro had been gradually declining, forming a series of lower highs and finding support around the 1.1070 - 1.1025 buyer zone. This pullback created the groundwork for a new structure to form as volatility narrowed and momentum shifted. After reaching a local bottom, the market rebounded and began constructing an upward pennant, a classic consolidation pattern that often precedes continuation or reversal, depending on breakout direction. Within this pennant, price respected both trendlines, each approach to the upper resistance was followed by a rejection, and each touch of the support line triggered a bounce. Now, the Euro is moving closer to the resistance line of the pennant once again. Given the overall structure, proximity to the 1.1415 resistance level, and prior reactions from the seller zone, I think the Euro can reach the top boundary and then continue to decline, potentially breaking below the pattern. That’s why I set my TP at 1.1150 points, targeting a move toward the support level and exit from the pennant. Please share this idea with your friends and click Boost 🚀
Disclaimer: As part of ThinkMarkets’ Influencer Program, I am sponsored to share and publish their charts in my analysis.

Euro can drop from top part of range and fall to support levelHello traders, I want share with you my opinion about Euro. Recently, price continued to grow inside a well-defined upward channel, maintaining a steady structure of higher highs and higher lows. The move started after a clear breakout from the buyer zone, which marked a strong bullish impulse and confirmed support near the 1.0735 level. After this breakout, the price gradually climbed, eventually entering a horizontal range, where it started to consolidate between local support and resistance. The current support level has held firm and now aligns with the lower boundary of the range as well as the support area. At the moment, the Euro is approaching the upper boundary of the range. Given the repeated reactions from this resistance zone, I expect the price to make one more push upward, retesting the top of the range, and then reverse downward toward the lower boundary, with TP1 set at 1.1270, where demand and structure are likely to react again. This short-term setup aligns with the current channel structure, the strength of the support area, and the repeated rejection from the range highs. Please share this idea with your friends and click Boost 🚀

People Used To Get Scared - BTC / USDMorning folks,
Read the chart, it contains all information.
I figured since I didn't update my inverted Adam & Even pattern chart much I'd just create a new one, but check it out, its playing marvelously.
Trade thirsty!

WILL THE S&P 500 COME CRASHING DOWN? TRIPLE RSI DIVERGENCE?!S&P 500 (SPX) Is considered to be one of the primary benchmarks for the U.S economy. Recently it appears to be showing a triple bearish RSI divergence, DMI indicating bearish with ADX above 20, and a bearish MACD on the 1 Month chart. The technical analysis seems to have a highly bearish hypothesis in my opinion. If we give some thought to Ray Dalio's Principles for Dealing with the Changing World Order , some haunting indicators appear to be forming. Could this just be a minor correction? Or is this the beginning of an extended economic downturn?
Disclaimer: Not financial advice.

Bitcoin can exit from triangle and drop to support levelHello traders, I want share with you my opinion about Bitcoin. The chart shows how the price previously made a strong decline, followed by a sharp rebound from the buyer zone between 77800 - 79000 points. This recovery formed a short-term uptrend, which led the price back into the seller zone, where bullish momentum slowed down. After testing resistance, BTC formed a wedge pattern that eventually broke to the downside, causing a new wave of correction. Following this drop, the market rebounded again from support and began forming a triangle pattern. The triangle developed inside the same larger resistance area that had already rejected price action before. The structure of the triangle shows lower highs with clear resistance along the 88500 level, reinforcing bearish pressure. Currently, BTC is trading near the apex of this triangle, and the price just bounced down again from resistance. This reaction suggests that the market is struggling to push higher and could be ready for a breakdown. Based on the triangle structure, the seller zone rejection, and the multiple failed attempts to break higher, I expect BTC to move downward toward the 80000 points, which I consider as TP1. The 79000 - 80000 area also coincides with the next major support and previous accumulation zone. Please share this idea with your friends and click Boost 🚀

Drop BTCUSDTBitcoin currency is falling due to the liquidity floor it has formed.
#btc
#drop
#btcusd

#BERAUSDT Expecting a reversal and price drop📉 SHORT BYBIT:BERAUSDT.P from $5.635
🛡 Stop Loss: $6.380
⏱ 1H Timeframe
✅ Overview:
➡️ BYBIT:BERAUSDT.P is facing strong resistance around $5.635, signaling a potential price reversal.
➡️ The $5.635 - $6.000 area has acted as a liquidity zone before, and if buyers start taking profits, a correction downward is likely.
➡️ The primary target for the decline is $4.145, a level where previous buy activity was observed.
➡️ Volume is starting to decline, indicating a potential shift from buyers to sellers.
⚡ Plan:
📉 Bearish Scenario:
➡️ Enter SHORT from $5.635 if the price fails to hold above resistance.
➡️ Risk management with Stop-Loss at $6.380, above key resistance.
🎯 TP Target:
💎 TP1: $4.145 — strong support and profit-taking zone.
🚀 BYBIT:BERAUSDT.P Expecting a reversal and price drop!
📢 After a strong upward move, BYBIT:BERAUSDT.P is approaching a potential reversal zone. If the price fails to hold above $5.635, a decline towards $4.145 is likely.
📢 However, if buyers manage to push the price above $6.000, the short scenario may be invalidated, leading to further bullish momentum.

DXY Dive Incoming? Watch the Liquidity Zones!From the higher timeframe perspective, DXY is currently hovering within a key monthly Fair Value Gap (FVG), marked in red. This zone serves as a critical point of interest and could dictate the next directional bias for the dollar.
Key Observations:
Current FVG Zone:
-Price is consolidating within the monthly FVG. A close below this zone would provide stronger confirmation of a bearish move targeting lower liquidity levels.
Bearish Bias:
-The recent price action indicates weakness as sellside liquidity (SSL) is beginning to show signs of attraction.
-The presence of significant sellside liquidity targets below, including:
-105.411 (Weekly SSL - Sweep)
-103.370 (Weekly SSL - Next Zone)
-100.215 (Major Daily SSL Zone)
Messy Market Conditions:
-Due to fluctuating macroeconomic factors, including USD news events, we may observe temporary rallies or retracements. However, these are likely to form lower highs before continuing the descent.
Confirmation Levels:
-Bearish Confirmation: A daily or weekly close below the monthly FVG would solidify the bearish case, signaling that sellside liquidity at 105.411 and lower levels are likely next.
-Bullish Risk: If the current FVG holds as support and price pushes higher, we could see an attempt to retest higher zones (e.g., 109.535) before resuming downside momentum.
Conclusion:
The expectation is for DXY to drop towards sellside liquidity levels at 105.411, 103.370, and potentially as low as 100.215. However, traders should await a clean confirmation (such as a close below the monthly FVG) to validate the move.
DYOR (Do Your Own Research) and trade safely amidst potential market volatility!
Let me know if you'd like any refinements!

USDT Dominance Rises: Are ALT Coins at Risk?#USDTDOMINANCE Triangle Breakout Confirmed! 🚨
A potential move toward the 4.75% level could be on the horizon, which may result in a sharp decline for ALT coins.
Avoid leverage trading and proceed with caution!
DYOR, NFA

Nightly $SPX / $SPY Predictions for 12.19.2024🔮
⏰8:30am
Final GDP q/q
Unemployment Claims
#trading #stock #stockmarket #today #daytrading #swingtrading #charting #investing

Bitcoin(BTC): Entering Reaccumulation Phase (DROP???)As we are over-expanding on Bitcoin, we also need to keep in mind that we have a really high chance of seeing the "reaccumulation" phase activate soon.
We are monitoring the charts and waiting for a bigger correction to happen before the next bullish market, so eyes open, everyone!!
Soon, we should see a really good buying opportunity.
Swallow Team

DOW 41k, YOU'RE GONNA WANNA PAY ATTENTION TO THIS PRICE TARGET41k is a massive resistance price target
meaning, it is likely to hit allowing exits at profit.
If it hits there is potential to see it bounce around even as high as 54k in a short term, but ultimately, at some point it will need to retest the lower end price targets.
If it were to do that sooner rather than later, it allows for a more natural growth in the price.
Meaning, there is a lot of potential to see the price melt up from 41k and then keep going.
OR more likely, there is a lot of potential to see a drop, possibly even a steep drop from 41k.
Either way, the downside takes us around 20% and then as high as 40% down from 41k.
I included 9k as a potential target, but I don't think we see baring a nuclear bomb being set off on the moon, but anything is possible.
All in
Mark Cuban, Sold stake in Mavs
Jeff Bezos, Sold Amazon stock
Warren Buffet, Sold Apple
Ryan and Carl, Buying BBBY
Multiple sports teams for sale, sold or being shopped
Massive deals everywhere
If you need any more signs that a top is near, with potential to crash hard allowing for a buy the dip scenario. Here is a small sample of it.

DXY SELL TO BUY XXXUSD Hey Traders,
lets get ready to see the dollar index (DXY) take some step down
simple what are we waiting for on the XXXUSD we are anticipating a BUY from the bottom
price fixing below
EMA's
Conversion line
200ema
is a good sign to sell this and BUY ALL XXXUSD at a right point
thanks for reading,if you want more content like this drop a comment below thanks once again!!!!!!!!!!!!

MASSIVE 33% to 50% DROP IN XRP COMING SEPT. 9th - 15th.I believe there is a massive drop coming for XRP during the week of September 9th through the 15th. Don’t ask how I came up with this prediction; it’s too complex to get into. I don’t know if the drop will be a massive red candle in a single day or if it will be a multi-day process to achieve these lows, but I’m predicting that the minimum price drop will be 33%, and it will most likely range between 33% ($0.3838) and 50% ($0.288) in total, somewhere between September 9th and September 15th (less than two weeks away). And if the price overshoots the low end of the prediction ($0.288), it may even drop as low as .18 cents, but likely won't hold long at the that price before rebounding.
For some, this will be the scariest moment in crypto. For others, it will be the buying opportunity of a lifetime. This most likely will not be limited only to XRP, and will be experienced throughout the overall crypto market.
Key takeaways from this prediction:
- Price will drop below $0.3838 sometime between Sept. 9th through the 15th.
- Price will go as low as $0.288.
- If the $0.288 level is broken, price may go as low as $0.18 cents momentarily (Refer to my chart below).
Keep some cash on the sidelines to purchase physical coins to add to your long-term XRP stack. This buying opportunity may last only minutes or could extend to days; only time will tell.
Let the countdown begin. And yes, I know this is a bold prediction, but I wouldn’t be sharing it if I didn’t believe it was actually going to happen, and yes, I may be wrong.
Good luck!

Bitcoin Could Drop to $51,000! Maybe 43,000!
After a recent 20% decline to $49,000, Bitcoin is currently trading above $57,000, but it might decrease to $51,000. The key support level is $53,500. Bitcoin is again caught in a bearish technical pattern; a closing bullish channel!
There are also rumors of a potential attack by Iran on Israel either tonight or tomorrow, which could drive Bitcoin down to $43,000 and cause another market downturn. However, this might potentially result in a positive divergence in the RSI.
Although there is still optimism about the CME gap in the market, the risks outweigh the optimism significantly.
In the current situation, if you don’t have a high risk tolerance, you might consider reducing some of your investment at this level. If you still have liquidity, you can dollar-cost average (DCA) into altcoins during potential dips.
