Be prepared to fallDue to heavy saturation, the RSI chart has sounded the alarm. A return to the 3200 range is within reach. A heavy drop is coming due to the trading volume.
Dump

SILVER - What Happened and Why Did It Dump So HardTLDR; Because it Ran so Hard.
In a recent Silver Minds post @mojo42391138 asked "what happened to the circuit breakers?" which got me thinking about whether Silver did indeed have mechanisms to try and halt trading in a similar way to stocks when things started to get out of control. So I went off and asked Dr Google.
Below is the result of some searches I did and some of my own thoughts so don't take it as any clever insights on my part. I just thought it was interesting so thought Id share it.
Yesterday was indeed a historic bloodbath for the precious metals market with both silver and gold both dumping. While gold fell significantly, silver lived up to its reputation as "gold on steroids" , plummeting roughly up to 30% (depending on the exchange and contract) after hitting record highs near $120 earlier in the week.
The answer to my question in terms of why did it dump so hard and what happened to the circuit breaker (if any) was yes it does have them, but they function differently than the ones you see on the New York Stock Exchange.
1. Why it felt like there were no breakers
In the stock market (like the S&P 500), a 7% drop of the whole market triggers a mandatory 15-minute "time-out" for the entire market. In the silver market (specifically the COMEX/CME Group), they use Dynamic Circuit Breakers.
How these work: Instead of stopping the whole market for a 7% drop, these breakers look at a rolling 60-minute window . If the price moves +/- 10% within that hour, trading pauses for just 2 minutes to allow liquidity to reset. Nothing! (IMO).
The Result: Because the pauses are so short, the price can continue to "cascade" downward after each brief restart. Yesterday’s move was driven by a "perfect storm" of the dollar strengthening and massive profit-taking, which often happens too fast for a 2-minute pause to stop the bleeding.
2. Why Commodities are treated differently than Stocks
Regulators generally allow commodities to move more freely than stocks for a few reasons:
Global Nature: Unlike Apple or Tesla stock, which primarily trades in the US, silver trades 24/7 in London, Shanghai, and New York. If one exchange (like the COMEX) shuts down for an hour, trading just shifts to another global hub, which can lead to "price gaps" and more chaos when the first exchange reopens.
Price Discovery: Commodities are used by industrial manufacturers (solar, electronics). These buyers need to know the real price to hedge their costs. Artificially freezing the price can prevent people from actually getting the metal they need.
Price Limits vs. Halts: Many commodity exchanges prefer "Price Limits" over halts. For example, some silver contracts have a 10% limit. Once hit, you can still trade, but nobody is allowed to bid lower than that limit for the rest of the day, unless the exchange decides to expand the limits (which they often do during "limit-down" events).
3. What triggered yesterday's "Reality Check"?
The collapse wasn't just random; it was a collision of technical and fundamental factors:
The "Warsh Effect": News of Kevin Warsh being nominated for Fed Chair signaled a "hawkish" shift (higher interest rates), which is kryptonite for silver.
Technical Gravity: Silver had gained over 50% in January alone. It was "overbought" by almost every mathematical standard, making it ripe for a "liquidity flush."
So that all makes sense - especially the globally traded silver not being able to be taken offline, but SLV which a heap of us hold is an ETF traded on the exchange, so I also thought it would be interesting to see how the silver ETFs (eg our SLV) handled the drop compared to the physical metal and why they didn't halt or get a time out.
Again, it turns out that while both crashed, they did so in different ways and under different rules.
Here is how the major silver ETF, SLV, handled the drop compared to the physical market.
1. Did SLV have circuit breakers?
Yes, but they are "Stock Market" breakers. Because SLV trades on the NYSE Arca (an equity exchange), it is subject to the standard Limit Up-Limit Down (LULD) rules of the stock market.
The Mechanism: If the price of SLV moves 5% or 10% within a 5-minute period, the stock exchange pauses trading for 5 minutes.
The Reality: Yesterday, while the physical silver price in London and the COMEX futures were "cascading" with only 2-minute pauses, SLV was hitting these 5-minute equity halts repeatedly. This meant that for several stretches of the morning, you couldn't sell your SLV even as the spot price of silver was continuing to fall.
2. SLV Performance vs. Physical Silver
A major issue yesterday was the tracking error. During extreme crashes, ETFs often "disconnect" from the metal they are supposed to represent.
While physical spot silver saw a violent intraday drop of 13% to 18%, SLV shareholders faced much steeper reported losses ranging from 28% to 40% driven by a wave of panic-selling and forced liquidations on the NYSE.
This discrepancy was exacerbated by liquidity mismatches: while physical silver trades on a global 24/7 basis, SLV was tethered to stock market hours and hit by repeated five-minute LULD (Limit Up-Limit Down) halts that locked investors in while the underlying price continued to crater.
Consequently, while physical coins maintained a "safety premium" of 10% or more at dealers, the paper trust plummeted to a significant discount, proving that in a true silver bloodbath, the "paper game" can't always keep pace with the bars in the vault.
The "Panic Discount": At the height of the crash, SLV shares were actually selling for less than the value of the silver held in the vault. This happens because "paper" investors (who can sell with a click) panic faster than physical bullion holders.
3. The "Paper Trap" Risk
Yesterday also highlighted a growing concern for 2026: Physical Backing. There were reports that the massive volume in SLV was putting pressure on the trust to prove it actually had enough silver in the vaults to cover the new shares. This "counterparty risk" often causes ETFs to drop harder than the metal itself during a crisis.
So - that was all a bunch of stuff I personally didn't know before. That whole disconnect between paper silver and physical silver and the difference in how they get halted created a mess :)
Trick is whether now that it is at such a deep discount and you can see its back pretty close to that more realistic 20 day support, and that wick didn't get through the 50 day, maybe now is a good time to buy if you FOMO'd before...
Who knows, who knows...

Brev/UsdtBINANCE:BREVUSDT.P
**BREV / USDT (Perpetual)**
Overall bias stays **bearish 📉**, with BTC still **unstable ⚠️**, keeping pressure on alts.
🔴 **Key Resistance Levels** at **0.2546 🚫**, then **0.2794 ⛔**, and higher at **0.3051 🧱**
🟢 **Major Support Zone** around **0.1856 – 0.1781 🛡️**, with a deeper level near **0.2035 ⚠️**
📉 Price continues to **respect the descending trendline**, showing weak demand.
🎯 A **short-term bounce** from the support zone could retest **0.2035 → 0.2297**
⚠️ Failure to hold **0.1781** may extend the drop toward lower liquidity areas
⚡ **Quick Take:**
* Trend remains **bearish 📉**
* Price is **reacting at demand 🧊**, but structure not broken
* BTC instability adds **extra risk ⚠️**
* Best to wait for a **clear reclaim or breakdown 🔓**
**Disclaimer:** *For educational purposes only 📚 — not financial advice 💡. Always do your own research and manage risk ⚠️.*

$BTC/USD - Troubled Road AheadBITMEX:XBT
January/2026
-Risk-On Sentiment of High Risk asset.
Liquidity withdrawing from Cryptomarket !
Bitcoin is headed South after breaking down for the weekly bear flag formation post ATH retracment.
Second week of Swing Short position going great, Stop Loss is now set at break-even point (considering to set it in profit).
If a Weekly Double Bottom fails at 80K, down we go to Lower High's structure of wicks just below noted as liquidity,
a support-resistance zone as well the 69K ATH level support for #bitcoin.
That is a TP target of <50% while intending to ride it down to Accumulation Area or 1.618 retracement .
TRADE SAFE
NOTE THAT THIS IS NOT FINANCIAL ADVICE !
PLEASE DO YOUR OWN RESEARCH BEFORE PARTAKING ON ANY TRADING ACTIVITY BASED SOLY UPON THIS IDEA

XRP - ONE LAST DUMP - PICK YOUR BOTTOM (Follow up)Past Warnings !
- Sunday Jan 4th I warned to be cautious if price hit the top of PURPLE channel - It did Jan 5th
- Monday Jan 5th was a total rejection followed by 4 red daily candles
- Monday Jan 12th I mentioned the market had just printed the most bearish weekly candle a market can print
- Monday jan 19th, no post, I let the market develop
TODAY !
- Monday Jan 26: price dipped sunday night and swung back up very slowly and some are already calling it a LIQUIDITY SWEEP !!!!!
I don't think so and here is why based on very simple reasons:
1. Liquidity Sweep are a lot more violent both ways, down and back up
2. After the very bearish GRAVESTONE DOJI weekly candle printed Jan 5-11, and the 2 red weekly candles the following weeks, very difficult to imagine that price is about to LIFT OFF.
3. Charts must look OBVIOUS in retrospect, a REAL Liquidity Sweep is needed
4. No way, Black Rock and Co (Vanguard, Fidelity, Morgan Stanley) will be denied to buy cheap for their ETFs before the pump.
IMO, it will have to end in a massive, violent and deep DUMP followed by a swing back up that will shock the world.
Here is what INCOMING in the weeks ahead !
PICK YOUR BOTTOM
Good Luck !

M - USDT #Update 2Hello everyone ❤️
I hope you are well 😍
💁♂️ The last update we made for the M- USDT cryptocurrency had reached the third target and had fallen close to the fourth target.
After reaching the third target, the price moved up and started falling again. This time, the fourth target was touched and we have experienced a 54% fall so far 🔥🔥🔥🔥
It was not very accurate and did not go as I expected, but the downward trend was well recognized.
💁♂️ It seems that lower targets will also be available
⚠️The analysis may not reach the final target, so at each target, if you make a good profit and see signs of a trend change, you can exit the trade or manage your capital.
⚠️ None of the analysis is a recommendation to buy or sell, but simply my personal opinions on the charts. You can use the charts and choose any that interest you and take a position if you wish.
To support me, I would appreciate it if you boost the analysis and share it with your friends so that I can analyze it with more energy for you, my dears. Thank you all. 💖

RESOLV LAST UPDATE FULLTARGETHello friends 😍
I hope you are well 👌😊
💁♂️ First of all, thank you for clicking the "boost button" to give me a thumbs up. ❤️
💁♂️ Let's go for last update on the RESOLV - USDT cryptocurrency
💁♂️ The RESOLV cryptocurrency also reached its last short-term target and fell 67% in a short time. 🔥
🤔 Did you use this analysis?
😊 Share your comments with me
⚠️The analysis may not reach the final target, so at each target, if you make a good profit and see signs of a trend change, you can exit the trade or manage your capital.
⚠️ None of the analysis is a recommendation to buy or sell, but simply my personal opinions on the charts. You can use the charts and choose any that interest you and take a position if you wish.
To support me, I would appreciate it if you boost the analysis and share it with your friends so that I can analyze it with more energy for you, my dears. Thank you all. 💖

RESOLV UPDATE #2 and TARGET 2 BOOOOOOOM Hello friends 😍
I hope you are well 👌😊
💁♂️ First of all, thank you for clicking the "boost button" to give me a thumbs up. ❤️
💁♂️ Let's go for a new update on the RESOLV - USDT cryptocurrency
💁♂️ The second target was also touched and we were able to take advantage of a very good drop
Up to this moment, the RESOLV cryptocurrency has also rejected the second target with a 60% drop 🔥
🤔 Did you use this analysis?
😊 Share your comments with me
⚠️The analysis may not reach the final target, so at each target, if you make a good profit and see signs of a trend change, you can exit the trade or manage your capital.
⚠️ None of the analysis is a recommendation to buy or sell, but simply my personal opinions on the charts. You can use the charts and choose any that interest you and take a position if you wish.
To support me, I would appreciate it if you boost the analysis and share it with your friends so that I can analyze it with more energy for you, my dears. Thank you all. 💖

ZEC #Update1 BOOOOOOOM !!!Hello everyone 😍
I hope you are well 👌😊
💁♂️ First of all, thank you for clicking the "boost button" to give me a thumbs up. ❤️
🔥 I am back with another great analysis
💁♂️ In the last analysis I gave you of the ZEC - USDT cryptocurrency, we went through the first scenario as predicted and reached the first target very quickly 🔥
The result of this analysis was a 31% drop so far 🔥🔥🔥
🤔 Did you use this analysis?
💁♂️ To improve the analysis process that I am providing, please share your comments with me
❤️ Would you like to support me by donating to post more analysis? ❤️
⚠️The analysis may not reach the final target, so at each target, if you make a good profit and see signs of a trend change, you can exit the trade or manage your capital.
⚠️ None of the analysis is a recommendation to buy or sell, but simply my personal opinions on the charts. You can use the charts and choose any that interest you and take a position if you wish.
To support me, I would appreciate it if you boost the analysis and share it with your friends so that I can analyze it with more energy for you, my dears. Thank you all. 💖

RESOLV BOOOOM !!!Hello everyone 😍
💁♂️ The RESOLV-USDT cryptocurrency reached the first target in less than 4 hours and rejected it, experiencing a 51% drop 👌😎
WOOOOOOOOOOOOW 🔥🔥🔥
👌 Another awesome analysis dedicated to my dear followers
😔 I have a complaint from everyone. By posting all this great analysis and very good targets, you are not boosting the analysis and I am slowly losing my motivation.
Maybe I will not post any more analysis in TradingView 😔
⚠️The analysis may not reach the final target, so at each target, if you make a good profit and see signs of a trend change, you can exit the trade or manage your capital.
⚠️ None of the analysis is a recommendation to buy or sell, but simply my personal opinions on the charts. You can use the charts and choose any that interest you and take a position if you wish.
To support me, I would appreciate it if you boost the analysis and share it with your friends so that I can analyze it with more energy for you, my dears. Thank you all. 💖

BTC BREAKING NEWS OR BREAKING CHARTS?📰 BREAKING NEWS OR BREAKING CHARTS?
TRUMP IMPOSES TARIFFS, CAUSING A BITCOIN BLOODBATH — $20,000 DRAWDOWN IN 2 HOURS!
Bitcoin was sitting comfortably at $121,000, before a sudden macro shock — triggered by newly imposed U.S. tariffs — sent prices spiraling down to $100,000 in a matter of hours.
Bulls were liquidated. Bears rejoiced.
Now, the market stands at a crossroads: will this become a major dump continuation, or the foundation for a secret pump?
Chart Overview & Structure
On the high timeframe, BTC continues to trade within a rising wedge formation, with price now showing a significant wick rejection from the upper boundary. This move suggests a potential shift in market structure — a moment that’s likely to shake inexperienced traders. The chart reveals a clear supply and demand structure:
Supply Zone: $123,452 – $130,000
D emand Zone: $98,826 – $101,400
These zones define the battlefield between bulls and bears. In addition, eight psychological levels dominate the chart — $100K, $105K, $110K, $115K, $120K, $125K, and $130K — each representing potential liquidity clusters and reaction points.
Adding to the complexity, we can see a golden pocket (0.618–0.65 retracement) forming around $106,000, perfectly aligning with prior swing lows and the midpoint of a large Fair Value Gap (FVG) overhead. This zone could serve as a reversal or continuation point depending on whether price can reclaim and hold above the major support trendline.
Technical Insights
The market has now tapped the rising wedge resistance three times, with the last tap forming a wick above $125K, triggering liquidity before the sharp collapse. This aligns with the classical exhaustion behavior of wedges. Moreover, a potential Head and Shoulders structure is beginning to emerge, with the right shoulder aligning near $115K — a confluence area that may attract strong bearish attention.
For now, price is testing the lower support trendline — a crucial pivot area for determining whether BTC continues to break down toward demand or consolidates for recovery. This structure creates a make-or-break zone that will define the next macro leg.
Bullish Scenario
Despite the panic, this could be a classic liquidity flush — a “flush candle” event designed to wipe out leveraged long positions before a larger move upward. If BTC can maintain structure above the major support line and close above $106K–$110K, it opens the door for a relief rally.
A reclaim of $115K would confirm buyer strength.
Sustained momentum could push BTC back into the $120K–$125K range to retest the broken supply zone.
Breaking through $125K would invalidate the bearish wedge, potentially igniting a run toward $130K+ and even new highs in “Pump-tober.”
In this scenario, the deep liquidation event becomes fuel for a massive short squeeze, driving momentum and reigniting bullish sentiment across crypto markets.
Bearish Scenario
On the flip side, if BTC fails to hold above $106K or decisively breaks below the demand zone at $98K, it would confirm a rising wedge breakdown.
Below $100K, momentum could accelerate toward $95K–$92K — the next liquidity pools and volume gaps.
The Head and Shoulders completion would confirm the bearish reversal structure, further strengthening the downside case.
Macro sentiment, fueled by geopolitical and policy fears, could add weight to the bearish outlook.
A rejection from $115K without sustained reclaim would also reinforce the bearish continuation pattern, with every psychological level above turning into resistance.
Summary
Bitcoin is at an inflection point — the $100K–$115K range will define the next macro move.
The recent wick and structure breakdown hint at weakness, but the flush candle and liquidity sweep also suggest that a bullish rebound could be on the horizon.
In short:
Above $115K → Bullish continuation possible.
Below $100K → Bearish expansion likely.
With volatility at its peak, traders should expect massive liquidity hunts, fakeouts, and emotional traps on both sides.
Whether this becomes the start of a macro correction or a secret accumulation phase before a major pump — the next few daily closes will tell the story.

$106K NEXT, THEN $91K - $93KWe need to touch $106K first, then dump immediately below $100K.
People think it will pump again, but it doesn't. The 4-year cycle is real.

SOLANA - SHORT - THE WICK AND THE WHISPERTraders,
This is how I see SOL.
1. The level I care about
For me the key area is 205 to 207. Call it VAH, call it range high, call it supply. It is the place where price got stuffed before and where a lot of trapped memory lives.
What I expect is simple.
Wick it. Slip it. Fade it.
In other words I am looking for SOL to run into that 205 to 207 pocket, spike through it, clean the liquidity resting above those highs, and then fail to hold. That failure after the wick is the trigger for me. That is where I want to be heavy.
If SOL trades above that range high and then instantly falls back inside, that is a swing fail pattern at the high of the range. That is the same story I am hunting on BTC at 117.5k. Liquidity first, conviction second.
2. The downside path
If the wick and slip happens, my downside path is not small. My next meaningful target sits all the way down at 150 to 155. That zone is not just a guess.
It is where the last real demand block sat before we impulsed higher.
It is also where liquidity was never fully re balanced after the violent breakout.
Call it unfinished business. Call it imbalance that still needs to close.
The market eventually comes back to drink from the well it skipped.
3. Now we look under the hood
Price has pushed up into 200 again, yes. But the flow behind the move tells a different story than the candles.
Spot CVD
Spot CVD is bleeding down hard. Real buyers paying cash are not supporting this move. Spot is distributing into strength, not accumulating under it.
Stablecoin margined CVD
Stablecoin perp flow is also down. That means most of the USDT perp side is either taking profit into this move or outright selling into it. They are not chasing it. They are leaning against it.
Coin margined CVD
This is the biggest one. Coin margined CVD is aggressively down. That tells me coin collateral traders are smashing into the bid, basically leaning short into this push.
So ask yourself. If spot is selling, and perp flow is selling, and coin margined flow is selling, then why is SOL still pressing up
4. Open Interest is the answer
Stablecoin OI is grinding up.
Coin margined OI is going vertical.
That means positions are being added at the top, not closed. New size is entering into this level.
When coin margined OI spikes like that while coin margined CVD is negative, the usual read is this. People are opening fresh short exposure using SOL itself as collateral, hitting the bid all the way up, and still not getting the breakdown.
They are trying to fade the move. The move refuses to die. That is short fuel.
This is why SOL can still squeeze into 205 to 207. Shorts are stepping in early, and if you squeeze them one more time you get the wick.
But here is the catch. After the wick and slip, once that last round of shorts is blown and once fresh late longs FOMO in above VAH, there is nothing under price.
Spot buyers did not build a floor.
Perps did not build a floor.
The whole thing is hollow.
That is how you get air pockets.
5. How I am trading this
I am not here to wave a bull flag or scream bear. I am not interested in labels.
I am here to execute around the level.
My plan is to stalk shorts on a failed breakout of that 205 to 207 key. I do not need to nail the exact top tick. I want to see the wick into VAH, and then the rejection back inside the range. That is my trigger to build size.
Will I hold it all the way to 150 No blind loyalty. But that is where I believe the next true re balance sits, and that is the map I am working with.
If SOL breaks through 207, accepts above, and starts building structure above VAH, then this idea is invalid. I step aside. No ego. Survival first.
6. Summary
SOL is approaching a thin ceiling where liquidity sits. I believe we get a final run of that high near 205 to 207, a wick and slip, and then rotation lower. The flow supports that view.
Spot is not bidding.
Perps are selling into the move.
Open Interest is exploding at the highs.
That is the recipe for a squeeze candle into resistance, followed by a rug.
My destination if this plays out is 150 to 155, the next pool of imbalance where the market still owes a visit.
The chart is loud, but the flow is louder.
The candles brag.
The data whispers.
I listen to the whisper.

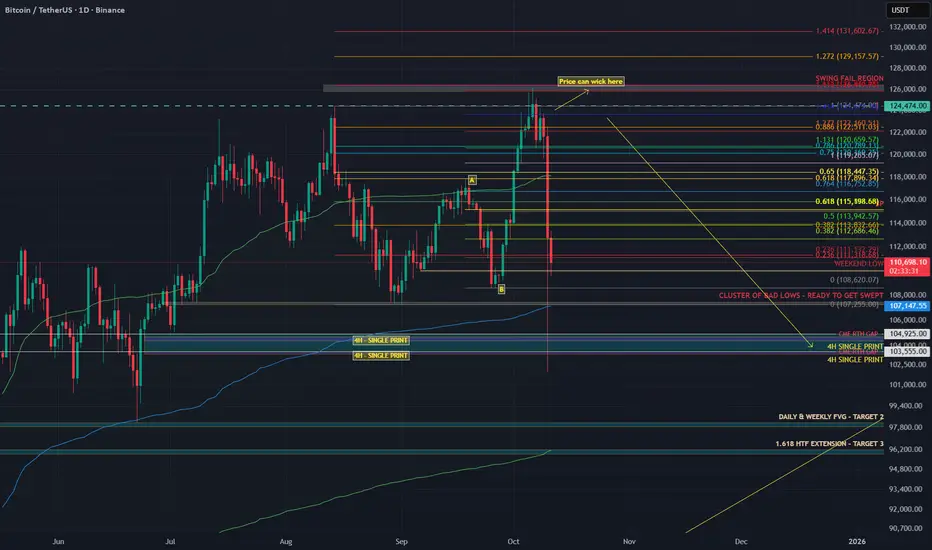
BITCOIN – THE LAST DANCE AT THE BORDER OF DEATHTraders,
I believe Bitcoin is potentially setting up for a swing fail pattern around 117.500.
A swing fail pattern, very simply, is when price runs the previous high, takes out the liquidity sitting above it, and then fails to hold above that level. In other words, it clears the stops, shows strength for a moment, and then turns. It is the market taking a breath before it bites.
Here is how I see it and why I am positioned for shorts, not longs.
1. Structure into 117.500
The zone around 117.000 to 117.500 is, for me, the kill zone.
Why?
There is a clean previous high that has not been taken yet
There is visible imbalance from the last fast drop sitting in that band
We have London morning wick liquidity above us that I believe price still wants to clean
The math and harmonics I am running line up in the same area
When I say the math lines up I am talking about measured extensions and harmonics off the leg that started around 103k to 104k and impulsed higher. My 1.618 extension clusters around 116.7 to 117.5. The 1.272 and 1.414 levels already got respected on the way up. This last one is usually where you get the overextension and the last grab. On top of this, the 1.618 extension confluences with the HTF Golden Pocket.
We also sit right on top of what I call the border of death. Above 117.500 I do not want to see Bitcoin hold. If it does hold and build acceptance up there then this entire idea is invalidated and I will adapt. I am not married to bias. I am married to data.
2. Order flow and participation
Let us talk about what is behind this move, not just what it looks like.
Spot CVD is still depressed compared to the beginning of the run. That means real buyers paying cash are not the ones driving price higher. This is not a classic spot accumulation bid. This is not strong hands owning the level.
Stablecoin margined CVD and coin margined CVD both curled up into the most recent leg. So who is lifting price It is perps. Not investors, not patient buyers, just leverage.
Open Interest is also telling us a story.
Stablecoin margined OI is grinding back up into the highs.
Coin margined OI is starting to climb again.
That means people are adding new exposure on the way up. They are not just covering shorts anymore, they are now chasing longs into the high. This is where positioning gets fragile. The crowd thinks we are going to keep going. I start thinking about harvesting that belief.
The floor under us is not built by conviction. It is built by leverage.
We have seen this before. The desert looks quiet before the sandstorm picks up.
3. What I am expecting
I am expecting a sweep of the high into roughly 117.500.
Clean the liquidity. Fill the imbalance. Tap the last little pocket of inefficiency that is still sitting there. Show strength on the surface.
Then reject.
That rejection is the tell for me. If we push above the high and then snap back below it on force, that confirms the swing fail for me.
From there I am looking for rotation much lower.
4. The target zone if this plays out
If this plays out the way I think it can, I am looking toward 98k.
This is not a random number. That is basically the next meaningful pocket of imbalance below. That is the next unfair area that never got re tested. Price likes to rebalance. The market eventually revisits the places it skipped when it was moving too fast. We call it inefficiency but it is really just unfinished business.
Will it instantly teleport there No. This is a path idea, not a straight line prediction. But 98k is where I think equilibrium lives if this whole run unwinds.
5. Risk management and positioning
Because of this view I have adjusted.
My earlier thesis from October 16 is, in my eyes, no longer valid in its original form. Never say never, but I am not trading that idea anymore.
I have closed all long positions. I am no longer here to squeeze the upside. I am here to stalk shorts.
Does that mean I am instantly full size short here No.
I am not interested in guessing tops. I am interested in letting the market reach for the level I want, and only then taking the trade with data behind it.
If Bitcoin breaks through 117.500 and starts holding acceptance above that level, I will back off this idea. No ego. No stubbornness. I am here to survive. Survival is the only way you ever get to mastery.
6. Summary
I believe Bitcoin is setting up for a classic swing fail pattern at around 117.500. I think price will hunt that liquidity, stop out shorts, convince late longs they are right, and then turn. I think the next meaningful re balance sits much lower, around 98k.
This is not guaranteed. Nothing in trading is guaranteed. Trading is probability, not fantasy.
But right now the flow, the harmonics, the imbalance, the extensions, and the psychology of the crowd all rhyme in the same place.
And when the market whispers in the same tone across different tools, I listen. I am ThetaNomad.

BITCOIN - PUMP BEFORE THE DUMP?Traders,
Last time I talked about arbitrage inefficiencies between spot and perps. I expected a dip first, then a corrective move up. That view still stands — but I also expected a sweep up before the bigger move down.
In my earlier notes I called for a sweep to clean the Sunday low, followed by a move back toward 120–122k with a short squeeze.
That scenario is now in play.
I planned to long near 109.350, after the sweep, and only if the data aligned with my thesis.
What I projected vs what happened
Sweep the Sunday lows, then squeeze up.
Wait for the sweep and only enter if the data confirms around 109.550. Entered 109.550 once multiple signals lined up.
Why I entered at 109.550
Stablecoin-margined CVD
First pass: Stablecoin Margined CVD made a lower low while price made a higher low → hidden bullish divergence. Aggressive sellers were getting absorbed by resting bids.
Second pass: Stablecoin Margined CVD made a higher low while price made a lower low → selling pressure fading, buyers absorbing again.
Coin-margined CVD
Coin Margined CVD kept making lower lows while price refused to follow → another hidden bull div. Shorts were leaning in, but passive buying held firm.
Spot CVD
Lower lows on CVD while price held flat or slightly higher → trapped aggressive sellers, absorbed by steady passive spot buyers.
On Binance Perp Order Flow we could also see a regular bullish divergence into a smaller hidden bull div at the sweep — a clean reversal setup.
Open Interest read
Here’s where many traders miss the nuance. There are two main perp types on Binance and most major exchanges:
Coin-margined contracts: collateralized with the underlying asset (e.g., BTC). Profits and losses are settled in BTC. Stablecoin-margined contracts: collateralized with a stable asset (e.g., USDT or USDC). Profits and losses are settled in dollars.
This matters because the behavior and risk exposure of traders differ between the two:
When coin-margined OI goes down, it usually means BTC-collateral traders are closing positions or getting liquidated. They’re forced to sell BTC to cover margin, which can create short-term downside pressure.
When stablecoin-margined OI goes up at the same time, it often means new traders are entering positions with USDT collateral. That capital rotation usually signals fresh directional bets, often late shorts piling in after a move down.
So when price stops making new lows while stablecoin OI keeps climbing, it’s a clear sign the market is loading up on shorts, but without continuation. That mismatch is short-squeeze fuel. Combine that with the CVD divergences above and it paints a strong case for a move back into overhead liquidity.
Supplementary edge
1H RSI bullish divergence: RSI makes higher lows while price makes lower lows → loss of downside momentum, suggesting sellers are tiring.
USDC.D and USDT.D bearish divergences: Stablecoin dominance charts make higher highs while RSI trends lower → stablecoin demand weakening. When that happens, capital tends to rotate back into BTC and risk assets, reinforcing the long bias.
Broke above daily VWAP
Together, these add extra confluence to the squeeze setup.
Plan, target, invalidation
Target: 122 area (blue box).
At target: watching for rising price with fading delta, sell imbalances near highs, and absorption signals — that’s where I’ll start hunting shorts and let the market cool off. Invalidation: acceptance back below the Sunday sweep low with expanding negative delta and rising OI on the breakdown. That would kill the squeeze thesis.
Summary:
A clean sweep → multi-CVD bullish divergences → absorption → rising OI imbalance → RSI & VWAP confluence. All aligning for a controlled short squeeze toward 122k, before the market potentially resumes its broader corrective path.
Does this mean we 100% go up? No. Markets don’t promise: they whisper. You listen, you align, and you risk what you can afford to be wrong about.

#BTC #BTCUSD #BTCUSDT #BITCOIN #Update #Analysis #Eddy#BTC #BTCUSD #BTCUSDT #BITCOIN #Update #Analysis #Eddy
Warning: Bitcoin and the cryptocurrency market are poised for the next wave of decline. I envision 2 scenarios for Bitcoin, both of which aim to see Bitcoin fall below $90,000. The first scenario, which is a daily block breaker, is more likely. The second scenario will only be activated when Bitcoin consolidates above $109,000, aiming to fill the FVG. Eventually, the second scenario will be activated, and the main decline will begin from the upper supply range that I have identified for you.
I have identified the important supply and demand zones of the higher timeframe for you.
As you can see in the chart, the trend change from bullish to bearish has been confirmed in the decline we had.
This analysis is based on a combination of different styles, including the volume style with the ict style.
Based on your strategy and style, get the necessary confirmations for this analysis to enter the trade.
Don't forget about risk and capital management.
The responsibility for the transaction is yours and I have no responsibility for your failure to comply with your risk and capital management.
💬 Note: This is just a possibility And this analysis, like many other analyses, may be violated. Given the specific circumstances of Bitcoin, it is not possible to say with certainty that this will happen, and this is just a view based on the ICT style and strategy with other analytical styles, including the liquidity style.
Be successful and profitable.
Review the result of my previous analysis on bitcoin :

SOL ; BUY OR SELL ?Hello friends
Given the decline we had, we can see it as an opportunity to buy at lower prices with risk and capital management.
Now we have obtained support levels for you and we have an important resistance that the price must break strongly to make the climb valid for us.
The goals are also clear.
*Trade safely with us*

BITCOIN – WAIT FOR ARBITRAGE TO BALANCE SPOT MARKETSTraders,
What a week it’s been. A lot of people got rekt, and I hope you were on the right side of the move. If not, it’s fine: this is how markets reset. I’ve been getting a lot of questions about what comes next, so here’s my current view.
The Situation
Binance/USDT wicked down to 102,000
Binance/USD wicked to 107,485.59
Coinbase/USD wicked to 107,000
That’s roughly a $5,000 difference, or about 5%, which is huge for major spot markets.
Under normal conditions, spreads between top venues like Coinbase and Binance are usually below 1% (Bitwise, 2019 SEC Study on Real Bitcoin Trading Volume - for the nerds interested ;)).
Why It Matters
Both Binance and Coinbase printed round-number lows (102k and 107k).
Round-number lows are considered “bad lows” because they attract clustered stop-loss orders and create obvious liquidity pools underneath.
Studies on market microstructure (e.g., Osler 2003; Kamps & Klein 2018) confirm that price clustering at round numbers is a real behavioral bias in FX and crypto markets.
Real market bottoms are messy, chaotic, and rarely form at clean, even levels.
These “perfect” lows often get revisited or swept later as the market clears liquidity and finds true balance.
How the Flush Works in Spot Markets
Even though spot markets don’t have leverage liquidations, they still experience stop cascades and panic selling.
When price breaks below a clean low, it triggers stops, sending a surge of sell orders into thin liquidity.
Market makers step in to absorb those orders and rebuild liquidity from a more stable base.
This is what traders call a spot flush — the market removing weak hands and resetting liquidity.
Conceptually, it’s the same as a liquidation flush in futures, just without forced margin calls.
What Arbitrage Does
Arbitrage keeps prices between exchanges in check.
When Bitcoin trades cheaper on Binance than on Coinbase, arbitrage traders buy on Binance and sell on Coinbase.
This pushes the cheap venue’s price up and the expensive one down until they align.
Makarov & Schoar (2020, NBER) showed that cross-exchange price deviations in Bitcoin are temporary and mean-reverting, driven by arbitrage capital restoring equilibrium.
Kaiko research (2021–2023) also found that USD and USDT pairs often decouple during stress events, especially when stablecoin liquidity or banking rails get disrupted, and later realign once volatility settles.
That’s exactly what we’re seeing now: a temporary dislocation that arbitrage will eventually close.
What I Expect
Binance already swept liquidity down to 102k.
Coinbase still has a clean 107k low that hasn’t been tested.
To rebalance both exchanges, I expect Coinbase to trade within 1% of the Binance 102k low, meaning roughly 103k–104k.
That would bring both markets back into alignment and complete a proper spot flush.
This isn’t a guaranteed move, but it’s a logical rebalancing target supported by historical arbitrage behavior.
What Could Happen Before That
We could still see Bitcoin move back toward 118k–120k before a potential drop.
After major liquidation events, markets often retrace sharply as liquidity rebuilds and shorts get squeezed.
A move higher doesn’t invalidate the idea of a later sweep; it could just be part of the natural reset phase before the market finds true equilibrium.
What I’m Watching
The spread between Coinbase/USD and Binance/USDT narrowing from around 5% to about 1%.
Coinbase breaking below 107k and testing the 104–102k zone.
A liquidity sweep followed by a strong reclaim and visible buy volume.
If we move up first, I’ll watch price behavior around 118k–120k for signs of exhaustion.
My Plan (Not Financial Advice)
I’m staying patient and letting the market mechanics reset.
If Coinbase trades into the 103k–102k zone, that’s my “let’s see what’s going on now” trigger.
That doesn’t mean I’ll instantly go long — it means I’ll start watching the data:
Volume and delta (are buyers stepping in?)
Strength of reclaim (is the recovery fast and decisive?)
Order book depth (is liquidity returning?)
What is Open Interest doing?
Do we see absorption? Or maybe a continuation pattern even?
Only if those metrics confirm strength will I consider entering.If not, I’ll stay flat and wait for the next confirmation.
So, TLDR;
Both Binance and Coinbase printed clean, round-number lows that are likely to be swept again. Arbitrage will eventually bring the spot markets back into balance, which should pull Coinbase closer to Binance’s 102k low. We might even see a push toward 120k first as liquidity resets. Either way, patience is key: let arbitrage, liquidity, and order flow do their job before taking any position.
And remember: Patience in trading isn’t about doing nothing, it’s about waiting for the odds to align in your favor. Chasing every move might feed the ego, but patience compounds the account. The market always rewards the trader who can sit still when everyone else is reacting.
Trade safe!

BITCOIN BULLISH MOMENTUM CONTINUATION? 125K Still possible?BTC/USDT 1H – Breakout Setup
Cup & Handle forming right under FVG zone, showing early bullish intent.
Recent tariff crash created the swing low and possible reaccumulation zone.
POC: 121K — strong magnet if price breaks higher.
Key Levels:
🔹 115K → Breakout confirmation level
🔹 120K → Mid FVG / Resistance
🔹 121K → POC target
🔹 125K → Next liquidity zone
🔹 110K / 105K / 100K → Downside supports
Bullish case:
Close above 115K = breakout → target 121K–125K (FVG fill + liquidity grab).
Bearish case:
Fail to hold 115K → drop to 110K → 105K → 100K possible.
Summary:
Cup & Handle under FVG + tariff crash low = potential bullish reversal zone.
Watch 115K — that’s the key trigger for direction.

BITCOIN – THE REAL REASON BEHIND THE FALLWhen I started trading someone told me something I’ll never forget: “If you can predict tomorrow’s newspaper headline, you understand the market.”
He didn’t mean I should chase news. He meant I should read structure so well that I know what kind of headline the market is already writing, before the mass even see it.
And now, looking around online, I see the complete opposite. Everywhere you look, there’s another “confluencer” talking about crypto with big words and zero understanding.
People selling dreams, memberships, and indicators, while they don’t even know what open interest or CVD means.
I’m not here to sell anything. I’m here to help people actually learn how to read data and see through the noise. Because what most of these so-called experts call “analysis” is just emotional guessing wrapped in confidence.
What I called and what happened
Last week I posted my “Big Dump” thesis.
I said Bitcoin would swing fail above the highs, then drop into the 104K region. That is exactly what happened.
Price ran the sweep into 126K, trapped the late buyers, and dumped straight into 104K.
People blamed tariffs. The tariff headline was the spark. The fuel was crypto’s own positioning.
Why the structure was ready to snap
Before the crash, the data told the story clearly.
Stablecoin OI went from 257K to 285K contracts (+10.9%). That is new leveraged exposure.
Coin-margined OI dropped during the breakout, then rose again near the highs. Shorts were fading strength.
Spot CVD stayed flat to slightly negative. Real buyers were missing.
The long/short ratio fell from 2.05 to 1.02 even while price kept climbing.
That’s what distribution looks like. Buyers on leverage pushing price up while stronger hands sell into them. No real spot demand, just futures exposure.
You don’t need a macro event to fall. You only need a reason for those leveraged buyers to stop bidding. Think of it like a crowded elevator. Everyone keeps piling in as it moves up, feeling safe because it hasn’t stopped yet. But the moment one person hesitates, the weight shifts. When the next person panics, the whole thing drops.
That’s what happens when a market is driven by leverage instead of conviction. You don’t need bad news, you just need hesitation.
Look back at similar events.
In May 2021, funding rates were insane, perps overloaded, and spot volume thin. Elon Musk tweeted about Bitcoin’s energy use. That tweet didn’t cause the dump. It just made leveraged longs pause. The bids disappeared and the cascade started.
In August 2023, Evergrande headlines hit. Bitcoin was sitting at resistance with flat spot CVD and rising OI. Equities wobbled, crypto longs hesitated, and the structure collapsed within hours.
In March 2020, when COVID panic hit, Bitcoin had already been stretched thin. Funding was high, leverage was heavy, and liquidity was weak. The virus didn’t break the market, leverage did.
Leverage creates confidence until it doesn’t. Price doesn’t fall because people start selling. It falls because nobody steps in to buy. Headlines decide when the drop starts. Structure decides how far it goes.
Why 104K was my first target
I didn’t pick 104K out of thin air. That level was built on confluence.
1) AVWAP from the April 7 auction
That swing low kicked off with massive volume. When a move starts with that kind of participation, the anchored VWAP becomes a key reference for institutional flow. It represents the average cost of that whole auction, and when extended forward, it acts as a dynamic area where liquidity and algorithms interact.
That blue AVWAP line from April has been running right through the 104K region.
It’s not that price revisited that auction, it’s that the anchored VWAP from that event still marks the fair value area for that entire move.When price traded back down into that region, it met that same volume-weighted anchor, creating a major confluence zone that algos and larger players watch closely.
2) The June 22 breakout left an LVN
A new auction started on June 22 and pushed higher, leaving a Low Volume Node behind.
An LVN is a thin zone on the volume profile where the market moved quickly with little trade.
Markets often revisit these thin areas later to find balance or test unfinished business.
3) HTF Fibonacci cluster
Multiple higher timeframe Fibonacci retracements and extensions overlapped near the same 104K area. When several fib levels align with structure, that’s a strong confluence zone watched by both human traders and algorithms.
The 104K region was where the AVWAP line, LVN, and fib cluster all met. That’s not a random target. It’s a structurally defined area where liquidity concentrates and where markets tend to react sharply. And that’s exactly what happened.
The spark versus the structure
The tariff headline didn’t cause the drop. It triggered it.
The structure was already unstable. Leverage was maxed. Spot demand was flat. Funding was positive and rising. When the tariff news hit, traditional markets pulled back and crypto followed instantly. It wasn’t correlation, it was liquidity contagion.
Traders managing multiple books de-risk across assets when volatility spikes. That creates a gap in liquidity. When the bids vanish, the market falls into the first real pool of resting orders — in this case, the 104K zone.
You saw the same mechanics during the March 2020 crash and the 2021 deleverage. External shocks trigger internal liquidation cascades. That’s why saying “this had nothing to do with crypto is completely wrong.
This had everything to do with crypto. It’s like blaming the thunder for breaking a window when the glass was already cracked. Or saying the iceberg sank the Titanic when the captain was already steering through a sea of warnings.
Crypto was structurally weak. Leverage was stretched, spot demand was gone, and funding was positive. When the headline hit, it didn’t cause the collapse. It just gave the market permission to do what it was already set up to do — unwind.
Crypto is built on leverage.
Perpetual futures dominate volume.
Stablecoin collateral drives exposure.
When external risk events change funding conditions or risk appetite, the crypto market reacts instantly because its structure is fragile by design.
Example:
When yields spike, the dollar strengthens and funding costs rise. Leveraged longs become more expensive to hold, so traders unwind positions.
When equities dump, cross-asset desks reduce risk globally, which pulls liquidity out of crypto perps too.
Intermarket correlation always matters. Macro sets the mood. But the speed and violence of crypto moves always come from leverage inside the system.
How you can spot it next time
Compare Spot CVD vs Stablecoin CVD. If stablecoin CVD rises while spot stays flat or negative, the rally is leverage-driven.
Track Open Interest vs Price. Both rising together usually means exposure is building. Confirm with spot flow.
Watch the Long/Short ratio. If it drops while price rises, shorts are entering and the move may be getting absorbed.
Anchor VWAPs to real pivots like swing lows, breakouts, or liquidation spikes. Those levels attract institutional flow.
Study Volume Profiles. LVNs are thin and often retested. HVNs are balance zones that attract price.
Map HTF fib clusters for confluence. Reactions are stronger when multiple timeframes agree.
Note single prints and thin brackets on TPO or volume profiles. These often act as magnets.
When these factors line up, you don’t need to predict headlines.
You’ll already most likely know which headline will break the market.
TLDR
The rally was leverage-driven: Stablecoin OI up 10.9%, Spot CVD flat, Long/Short ratio down from 2.05 to 1.02
The swing fail at 126K was the final liquidity grab
104K was the target due to AVWAP + LVN + HTF fib cluster
The tariff headline was the spark, not the cause
The crash was caused by leverage and missing spot demand
Crypto didn’t fall because of politics. It fell because the market was already begging for an excuse to reset.
The data showed it clearly weeks before the drop.
If this helped you see the market a little clearer or made you think differently about how price really moves, please leave a like and drop a reaction. It keeps me motivated to keep posting real analysis, not the copy-paste bullshit hype that floods your feed every day.
Check the Order Flow Data from 6 October here: ibb.co
#BTC #BTCUSD #BTCUSDT #BITCOIN #Analysis #Eddy#BTC #BTCUSD #BTCUSDT #BITCOIN #Analysis #Eddy
I have identified the important supply and demand zones of the higher timeframe for you.
This analysis is based on a combination of different styles, including the volume style with the ict style.
Based on your strategy and style, get the necessary confirmations for this analysis to enter the trade.
Don't forget about risk and capital management.
The responsibility for the transaction is yours and I have no responsibility for your failure to comply with your risk and capital management.
💬 Note: This is just a possibility And this analysis, like many other analyses, may be violated. Given the specific circumstances of Bitcoin, it is not possible to say with certainty that this will happen, and this is just a view based on the ICT style and strategy with other analytical styles, including the liquidity style. (( The fall of Bitcoin may not change the trend of altcoins and money will move out of Bitcoin and into altcoins, and we will see altcoins grow. ))
Be successful and profitable.

$LINK – PREPARING FOR A BIG DUMP – SQUEEZE TRAIN LOADING Traders,
I BELIEVE THE CRYPTO MARKET IS SETTING UP FOR A BIG, BIG, BIG DUMP!, NOT JUST LINK!
Last time, we nailed the BIST:LINK short from $24.55 — it hit Target 1 and Target 2 (the two boxes below) pixel perfect.
From $20.00 we expected a retrace back up toward the $23.00 region, before a potential dump to $17.00.
That scenario may now be unfolding.
Let’s break it down:
CVD & Market Participation – Bearish Divergence Building
Aggregated CVD Spot → still relatively flat → tells us there’s no real spot demand or accumulation. Spot buyers are not fueling this push.
Aggregated CVD Futures (Stablecoin-margined) → moving aggressively higher → lots of leveraged traders chasing the move up.
Aggregated CVD Futures (Coin-margined) → also moving aggressively higher → even riskier longs, since collateral is crypto itself (double downside risk if LINK sells off).
👉 Why this is a bearish divergence:
Price is being pushed higher only by aggressive leveraged longs, while spot (the foundation of demand) is not confirming. This creates a fragile rally that can easily unwind into a long squeeze.
Order Flow – Signs of Absorption
On Binance & Bybit perps, we see aggressive buyers stepping in (CVD making higher highs).
But price is not moving higher accordingly.
This is a classic absorption signal: passive limit sellers are absorbing the buying pressure, preparing for reversal.
Market Context – Entering the PRZ ($23–24)
HTF VAL (Value Area Low) at this region.
LTF VAL aligns perfectly here too.
Single Prints (TPO profile) → thinly traded zones where price moved quickly in the past, often acting as magnets and reversal points.
Imbalances stacking at these levels, showing inefficiency that can flip.
AVWAP Confluence → multiple anchored VWAPs cluster in this zone, creating strong resistance.
All of this builds a confluence-heavy Potential Reversal Zone (PRZ) at $23–24.
My Take
We are entering a Reversal Zone packed with:
No real spot demand,
Leveraged longs chasing,
Absorption in order flow,
Strong technical confluence (VALs, TPO singles, Imbalances, AVWAP).
⚠️ This is the perfect fuel for a long squeeze dump back toward $17.00.
Trade safe, manage risk. Adios 🚀🔪

JTO-USDT FULL TARGET BOOOOOOMHello friends 😍
💁♂️ This time let's go to the JTO-USDT cryptocurrency
✅ And again a great analysis and a precise area
💁♂️ We introduced the apple cryptocurrency from the area marked with a red circle and were monitoring
👉 We expected the price to reach the lower purple area
👉 After a little price fluctuation, the price reached the area with a Sharpe movement and crossed that area too
✅The total drop rate from the marked area was about 85%, which was very amazing 🔥🔥🔥
✅The drop rate to the lower purple area was also 60% 🔥🔥🔥
What's better than this? 😍
Yes, this was a great analysis with great results 💖⭐
💁♂️ Has anyone used this analysis?
🤔Let me know your thoughts
⚠️ None of the analysis is a recommendation to buy or sell, but simply my personal opinions on the charts. You can use the charts and choose any that interest you and take a position if you wish.
To support me, I would appreciate it if you boost the analysis and share it with your friends so that I can analyze it with more energy for you, my dears. Thank you all. 💖
