DUSKUSDT Forming Bullish ContinuationDUSKUSDT is forming a clear bullish continuation pattern, a classic bullish wave signal that often indicates an upcoming breakout. The price has been consolidating within a narrowing range, suggesting that selling pressure is weakening while buyers are beginning to regain control. With consistent volume confirming accumulation at lower levels, the setup hints at a potential bullish breakout soon. The projected move could lead to an impressive gain of around 190% to 200% once the price breaks above the wedge resistance.
This bullish continuation pattern is typically seen at the end of downtrends or corrective phases, and it represents a potential shift in market sentiment from bearish to bullish. Traders closely watching DUSKUSDT are noting the strengthening momentum as it nears a breakout zone. The good trading volume adds confidence to this pattern, showing that market participants are positioning early in anticipation of a reversal.
Investors’ growing interest in DUSKUSDT reflects rising confidence in the project’s long-term fundamentals and current technical strength. If the breakout confirms with sustained volume, this could mark the start of a fresh bullish leg. Traders might find this a valuable setup for medium-term gains, especially as the pattern completes and buying momentum accelerates.
✅ Show your support by hitting the like button and
✅ Leaving a comment below! (What is your opinion about this Coin?)
Your feedback and engagement keep me inspired to share more insightful market analysis with you!
Dusk

EULER (EUL/USDT) – Bullish Break Update | High Upside PotentialTimeframe: 4H
Current zone: ~1.50 USDT (macro support)
This coin is a patience coin, with the right time frame it can build uptrend Levels.
The same effect what other increase coins had, this coin start to build, even with the last breakdown to now 1.50 and below.
Positive outlook
EULER is currently trading at a major long-term demand zone, where selling pressure has clearly weakened. After an extended downtrend, price is showing signs of stabilization and accumulation, which often precedes a strong upside expansion.
This zone has historically acted as a launchpad for impulsive moves, and the current structure suggests the market is building energy rather than continuing straight down.
Why a strong breakout is likely
Price is at deep value levels after heavy capitulation
Downside momentum is fading, indicating seller exhaustion
Very thin resistance above, meaning once price breaks, it can move fast
A reclaim of key levels could trigger short covering + fresh long interest
Key confirmation levels
2.80 USDT → First major breakout & trend shift confirmation
4.0 – 4.5 USDT → Supply test, likely fast reaction zone
6.0 USDT → Momentum continuation level
8.0 USDT → Macro breakout target if volume expands
Bullish scenario
If EULER holds above 1.50 and breaks back above 2.80, the probability increases significantly for a high-momentum move toward 4–6 USDT, with a realistic extension toward 8 USDT in a strong market environment.
Summary
EULER is positioned at a high-probability reversal area. While confirmation is still required, the risk-to-reward strongly favors the upside, and a breakout could result in a multi-leg rally.
This is the type of structure where moves happen fast once they start.
🚀 Patience + confirmation = opportunity
⚠️ Always manage risk appropriately

DUSK ANALYSIS (1W)It seems that after forming the 3D structure, the price has entered a corrective ABC pattern or a more complex one.
It appears that wave B has now ended, and the price has entered wave C.
Wave C has a long correction ahead in terms of time, and in terms of price, the best area for the end of wave C is the green zone.
Let’s wait and see what happens.
For risk management, please don't forget stop loss and capital management
When we reach the first target, save some profit and then change the stop to entry
Comment if you have any questions
Thank You

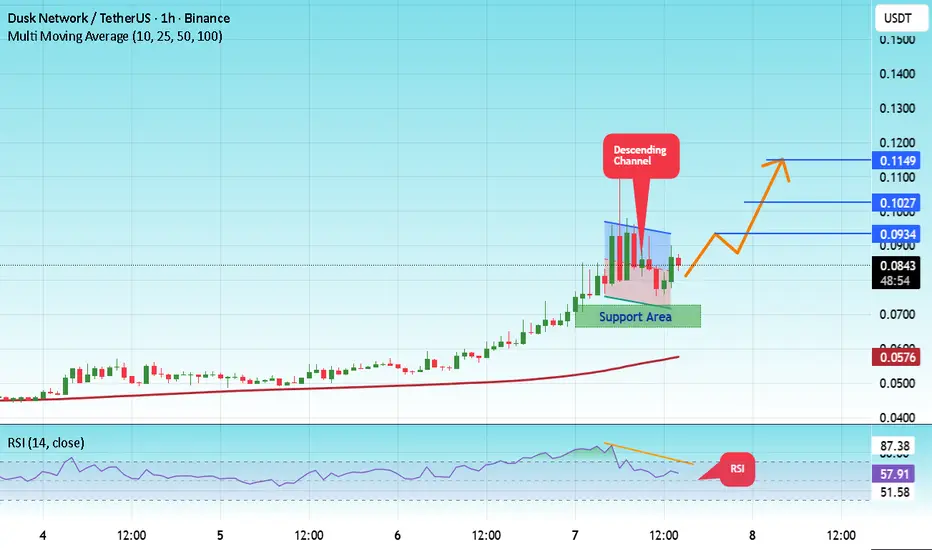
#DUSK/USDT Forming Falling Wedge#DUSK
The price is moving in a descending channel on the 1-hour timeframe and is expected to break out and continue upwards.
We have a trend to stabilize above the 100-period moving average again.
We have a downtrend on the RSI indicator, which supports an upward move if it breaks above it.
We have a key support zone in green that pushed the price higher at 0.0700.
Entry price: 0.0823
First target: 0.0934
Second target: 0.1027
Third target: 0.1150
For risk management, don't forget your stop-loss and capital management.
The stop-loss is below the support zone in green.
Upon reaching the first target, take some profits and then change your stop-loss order to an entry order.
For any questions, please comment.
Thank you.
dusk can give good bullish rally overall in downtrend from long time, but now showing signs of recovery, price is not dropping as it dropped earlier, and testing descending trend line again and again, trendline getting weaker on every test, its does not mean we are bullish on dusk, still need confirmation/breakout, waiting for trend line plus horizontal resistance breakout, after successful breakout it can give more than 2x

DUSK/USDT — Decision Zone: Trendline Break or Rejection?DUSK/USDT on the 5-Day timeframe remains in a medium-to-long-term downtrend structure, characterized by a series of lower highs and lower lows since the peak around the 0.68 area. However, price is currently showing a strong reaction from a historical demand zone and is now testing the primary descending trendline, making this area a critical decision zone for the next major move.
---
Price Structure & Pattern
1. Descending Trendline (Primary Downtrend)
The descending trendline connects lower highs from 2024 to 2026
Price is currently retesting the trendline
This area acts as a major dynamic resistance
2. Demand Zone / Strong Support
Yellow zone: 0.077 – 0.064
This zone represents:
Long-term accumulation area
Multiple price reactions
Confluence with Fibonacci 0.5 – 0.618
Serves as the base structure before a potential reversal
3. Current Structure
Price is forming:
Short-term higher lows
A bullish impulse from the demand zone
This suggests an early reversal attempt, but it is not confirmed without a breakout
---
Key Technical Levels
Resistance:
0.105, 0.130, 0.166, 0.252, 0.307, 0.446, 0.570
Support:
0.077 – 0.064 (yellow zone / primary demand), 0.043, 0.025 (historical low)
---
Bullish Scenario
Bullish scenario is valid if:
Price breaks and closes strongly above the descending trendline
Followed by a successful retest around 0.076 – 0.080 as new support
Bullish Targets (Step-by-Step):
0.105
0.130
0.166
0.252
0.307
Implications:
Trendline breakout = end of distribution phase
Potential transition from bear market to recovery phase
Structure shifts from lower highs to higher highs
---
Bearish Scenario
Bearish scenario if:
Price fails to break the descending trendline
Strong rejection followed by a daily/5D close below 0.064
Downside Targets:
0.043
0.025 (historical low)
Implications:
Failure of the yellow demand zone
Downtrend continuation
Risk of entering a capitulation phase
---
Conclusion
DUSK/USDT is currently positioned at the most critical technical zone in its cycle.
The 0.077 – 0.064 area is the key level to watch.
Trendline breakout → high-probability reversal
Trendline rejection → downtrend continuation
This setup is ideal for swing and positional trading, offering an asymmetric risk–reward profile if a breakout is confirmed.
#DUSK #DUSKUSDT #AltcoinAnalysis #CryptoChart #TechnicalAnalysis #DescendingTrendline #DemandZone #TrendReversal #SwingTrading

DUSKUSDT UPDATE#DUSK
UPDATE
PUMP Technical Setup
Pattern: Falling Wedge Pattern
Current Price: 0.23$
Target Price: 0.48$
Target % Gain: 110.24%
Technical Analysis: PUMP is breaking out of a falling wedge pattern on the 1D chart, indicating bullish potential. The price has recently surged above the resistance trendline, supported by an increase in volume. The setup is validated as the price approaches the key resistance areas.
Time Frame: 1D
Risk Management Tip: Always use proper risk management.

DUSK Buy/Long Signal (4H)Considering the liquidity sweep at the bottom, followed by the formation of a large bearish candle and then its engulfment with the formation of a bullish CH, we can look for buy/long positions on the pullback to the support zones.
We have marked two entry points on the chart, which should be entered using DCA.
The targets are also marked on the chart.
Do not enter the position without capital management and stop setting
Comment if you have any questions
thank you

DUSK - +45%UP! COA COA COA COA COA 🐸 - CRYPTOCAP:DUSK
+45% UP 🔥 - Even in red market phases, my lines are just absurd!!!
All my target hit. TP4 ✅🎯


DUSK: Moonvember Updates#DUSK has completed a historical 1–2 pattern, indicating a bullish outlook for the future ahead. As long as it holds above the $0.04 support level, it shows potential for high targets.

#DUSK/USDT#DUSK
The price is moving within a descending channel on the 1-hour frame, adhering well to it, and is heading for a strong breakout and retest.
We are seeing a bounce from the lower boundary of the descending channel, which is support at 0.0926.
We have a downtrend on the RSI indicator that is about to break and retest, supporting the upward trend.
We are looking for stability above the 100 moving average.
Entry price: 0.1023
First target: 0.0989
Second target: 0.0933
Third target: 0.0910

DUSKUSDT Forming Falling WedgeDUSKUSDT is showing a strong technical setup as it forms a classic falling wedge pattern, a bullish reversal signal that often precedes major upward price movements. The price has been consolidating within this narrowing structure, indicating a gradual slowdown in bearish momentum and increasing accumulation by buyers. With good volume supporting recent candles, market sentiment appears to be shifting in favor of the bulls, suggesting a possible breakout that could drive prices up by 80% to 90% in the coming sessions.
The falling wedge pattern indicates that sellers are losing control as the price compresses closer to the wedge’s apex. Once a breakout occurs above the upper resistance line, it typically triggers a sharp move to the upside, backed by renewed buying interest. DUSK’s volume profile shows consistent activity, reflecting growing confidence among investors who are anticipating a reversal and a fresh bullish wave.
Investor attention around DUSKUSDT has been increasing, as the project continues to show resilience and strong technical positioning. The current market structure offers traders an attractive risk-to-reward ratio, particularly for those looking to capture early momentum from the potential breakout. As accumulation continues, a bullish move could soon unfold, validating the wedge formation and driving a sustained upward trend.
✅ Show your support by hitting the like button and
✅ Leaving a comment below! (What is You opinion about this Coin)
Your feedback and engagement keep me inspired to share more insightful market analysis with you!
DUSKUSDT UPDATE#DUSK
UPDATE
DUSK Technical Setup
Pattern: Bullish falling wedge pattern
Current Price: $0.0678
Target Price: $0.1377
Target % Gain: 110.97%
$DUSK is breaking out of a falling wedge pattern on the 1D timeframe. Current price is $0.0678 with a target near $0.1377, showing about 111% potential upside. The breakout highlights strong bullish momentum with potential for continued upward movement. Always use proper risk management.
Time Frame: 1D
Risk Management Tip: Always use proper risk management.

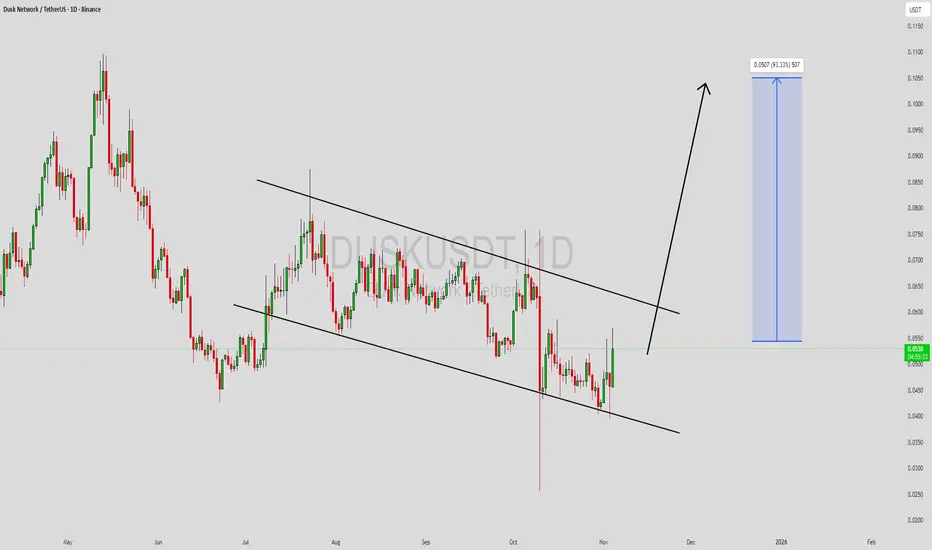
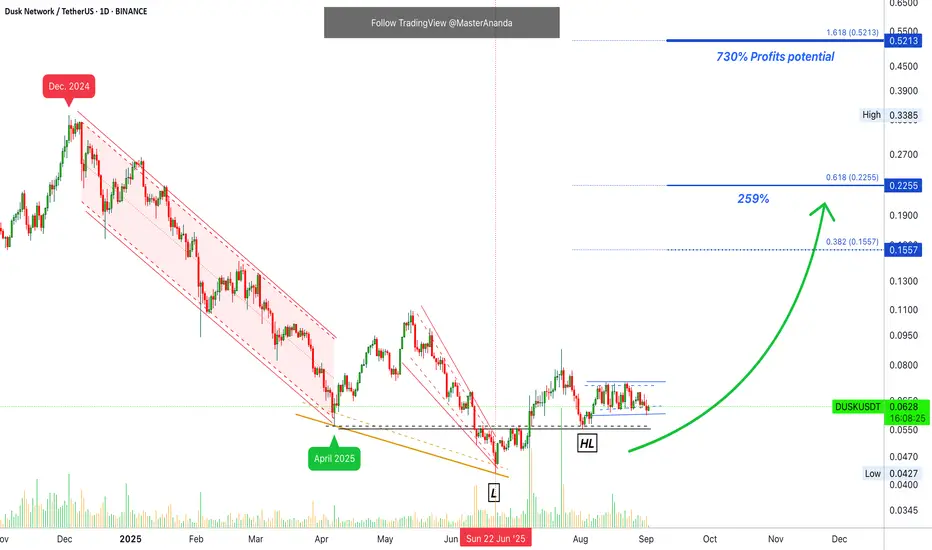
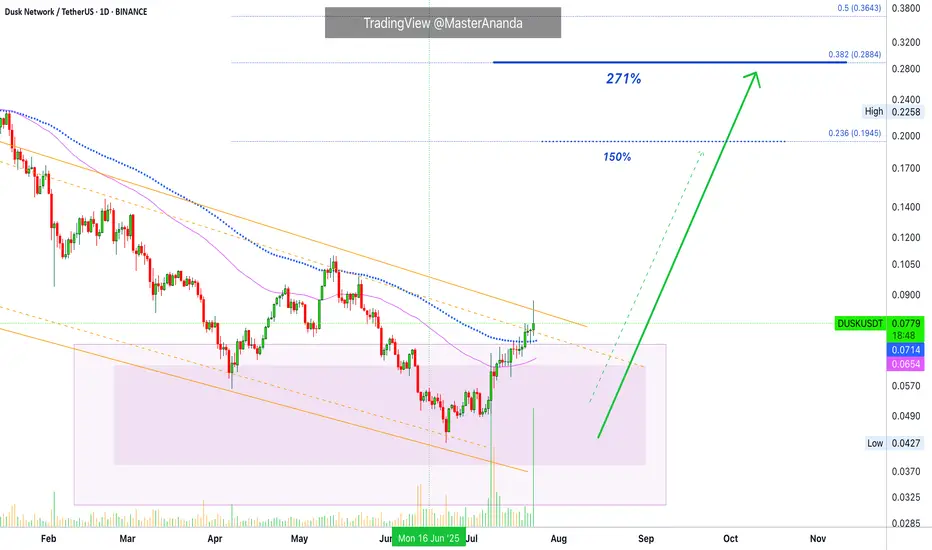
Dusk Network Primed 4 730% Potential Profits · Easy Target 259%DUSK has been sideways after the HL. An entire month of consolidation.
It has been 72 days since the market bottom (22-June).
Recovery followed by sideways;
Sideways will be followed by a strong bullish wave.
DUSK is preparing for a major rise with a mid-term target of 730% potential profits. The pair is so strong right now—strong as in huge potential for growth—that the easy target goes beyond 200% to reach 259%. The price tag for this one is 0.2255, hold strong.
Whatever you are thinking of doing with this pair, make sure to practice patience, it always pays.
This is a classic and long-term project from the small cap. camp. It has been around very long.
With a proven track-record, withstood the test of time, the 2025 bull market will make sure to reward those who took the jump.
It is not easy to buy when there is uncertainty, doubt and fear in the air. It is not easy to buy at bottom prices; but this is the best action you can take. The best action if what you want is huge profits and strong success.
We are ready for the altcoins market bullish wave.
We already waited long enough. Thank you Crypto, but we are ready for some fun.
We become bored when we don't earn.
We want to be entertained... So give us the profits.
Namaste.
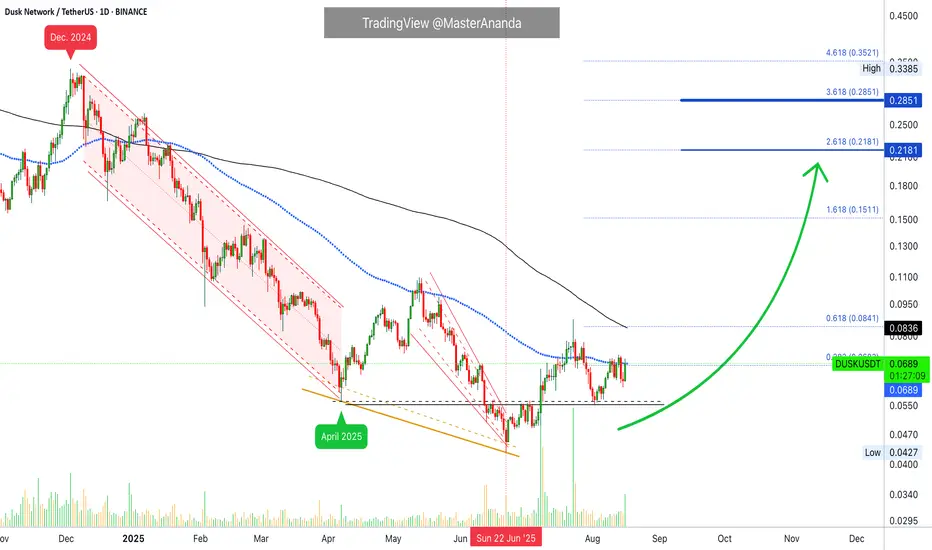
Dusk Network Update · Perfect ChoiceI can tell you exactly what is happening here. I can read this chart for you. I can translate what it says... Let's give it a try!
DUSKUSDT has bullish potential. This trading pair is currently consolidating at bottom prices, trying to move just today above EMA89 (a form of resistance).
We can notice right away how the drop from December 2024 becomes less steep after April 2025. DUSKUSDT goes from a bearish impulse to a reversal pattern.
It is an inverse signal. The fact that prices aren't dropping anymore tells us the market is bullish.
Ok. We have a drop coming from a high in December 2024. This is a strong drop and definitely a bearish impulse. It all changes after 7-April. There is a bounce and the next drop is not a full blown bearish wave but more like a retrace or a stop-loss hunt-event, a shakeout.
The fact that the bearish force is no more—DUSKUSDT is rising and has been rising for months supported by rising volume—indicates that the market is about to turn. Since there is no more downtrend nor lower lows, it reveals the market is about to change.
We are now entering an uptrend and resistance is being challenged today. DUSKUSDT will break up and it will grow for months. Aim high... I see very good targets on the weekly timeframe. The rest is up to you. This is a perfect choice.
Namaste.
Dusk Network Instant 150% · More Possible · Trading ExplainedThis is a complete setup, I shall explain. Trading long-term vs trading short-term and technical analysis.
We are looking at Dusk Network (DUSKUSDT) on the daily timeframe. You know how I always look for the bottom and trend reversal for all major pairs for long-term trade-numbers; but, when focusing on the short-term you want a fully confirmed setup rather than the perfect bottom. Why?
The perfect bottom can lead to months and months of consolidation before a bullish breakout. A fully confirmed chart setup leads to instant growth.
Here DUSKUSDT has really high volume above EMA89. Full green candles and pushing higher. Already rising, you can see how the bullish bias is only intensifying. This type of setup can produce the much sought after sudden 100% jump. Once this happens, collect profits and move on.
So, long-term, buy and hold. Keep waiting until the cycle top.
Short-term, get in and get out.
Namaste.
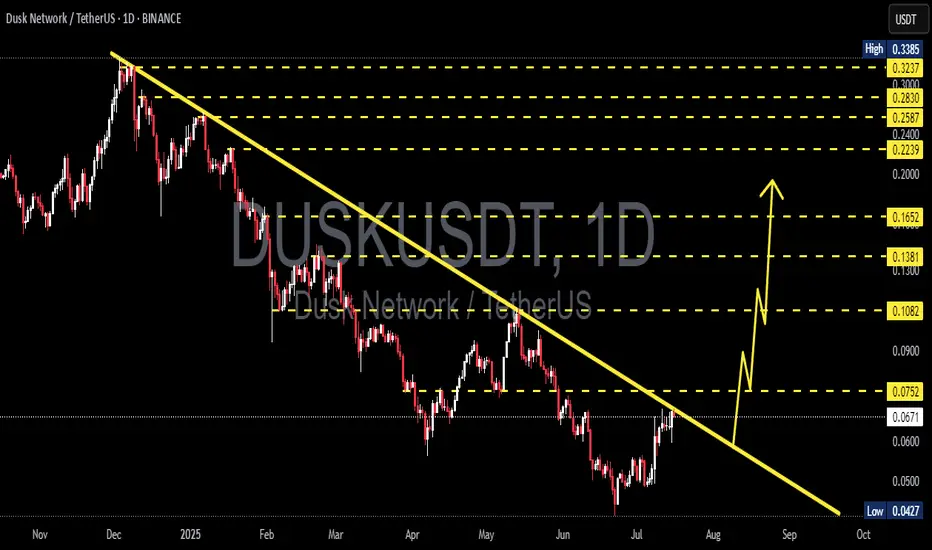
DUSK/USDT Poised for Major Breakout – High Probability Reversal🔍 Technical Overview (Timeframe: 1D – Binance):
DUSK/USDT is currently displaying one of its most crucial technical setups in recent months. The price is retesting a descending trendline that has capped any significant upside since November 2024.
Now, the market is compressing near this trendline resistance while gradually forming higher lows, indicating a potential pressure build-up for a breakout. This may mark the end of the downtrend and the beginning of a strong bullish reversal if confirmed.
📐 Pattern Structure: Descending Trendline Breakout
This long-term descending resistance has been tested multiple times, gaining validity.
Price is consolidating right below it, while volume shows signs of a slow uptick.
The overall structure resembles a Falling Wedge pattern – often a bullish reversal pattern once the upper boundary breaks.
🟢 Bullish Scenario – Potential 200%+ Rally if Breakout Confirmed
If the price successfully breaks and closes above $0.0752, a significant upward movement may unfold. The potential resistance targets based on historical price reactions and Fibonacci zones are:
Target Resistance Level
TP1 $0.0752 – Breakout Validation
TP2 $0.1082 – Previous Horizontal Resistance
TP3 $0.1381 – Strong Supply Zone
TP4 $0.1652 – Mid-Fib Zone
TP5 $0.2239 – High-Interest Level
TP6 $0.2830 – Extension Target
TP7 $0.3385 – November 2024 High
💡 Extra Catalyst: If BTC stabilizes or enters a consolidation phase, altcoins like DUSK may outperform during a potential mini altseason.
🔴 Bearish Scenario – Rejection at Resistance
If DUSK fails to break the trendline and faces rejection around $0.0672–$0.0752:
The price could retrace back to the minor support zone around $0.0500.
A drop below that would target the macro support at $0.0427, which represents the lowest point of this downtrend.
A close below $0.0427 would likely confirm bearish continuation.
💎 Bullish Setups Backed by Key Technicals:
1. Multi-touch Trendline Resistance – A valid and respected resistance line now at risk of breaking.
2. Sideways Accumulation Structure – Flat price action over several months, likely a sign of re-accumulation.
3. Altcoin Momentum Potential – Market environment increasingly favorable for altcoin rebounds.
4. Gradual Volume Build-up – Suggests quiet buyer interest before a potential surge.
🎯 Trading Strategy:
Buy Entry Confirmation: Daily candle close above $0.0752 with increasing volume.
Stop Loss: Below $0.0620, or more conservatively below $0.0500.
Take Profits: Partial exits at each target zone listed above.
✅ Conclusion:
DUSK is approaching a high-impact technical inflection point. A confirmed breakout of the long-standing descending trendline could open the doors to a multi-leg bullish rally. For swing and position traders, this is a high-probability setup worth close attention. The risk-reward profile is favorable if the breakout is supported by volume.
#DUSKUSDT #CryptoBreakout #AltcoinReversal #TechnicalAnalysis #CryptoTrading #DescendingTrendline #BullishSetup #SwingTradeOpportunity #AltcoinWatch
DUSKUSDT Breaks Out & Flips Trend. Strong Uptrend Ahead!BINANCE:DUSKUSDT has finally broken out of a key resistance zone that had previously kept the price suppressed. After a long period of lower lows and bearish price action, we’re now seeing a confirmed reversal as $DUSK forms higher highs and trades confidently above the 50 EMA on the 4H chart.
This shift in structure from lower lows to higher highs is a clear indication of growing bullish momentum. The breakout has also come with a notable increase in volume, further confirming strength behind the move. Holding above the 50 EMA is a strong sign that the bulls are in control, and we could be in the early stages of a major trend shift.
As long as $DUSK holds above the breakout level and continues respecting key moving averages, we expect a strong uptrend to follow. Short-term pullbacks may offer great entries before the next leg higher
BINANCE:DUSKUSDT Currently trading at $0.067
Buy level : Above $0.064
Stop loss : Below $0.054
Target 1: $0.0735
Target 2: $0.084
Target 3 : $0.11
Max leverage 5x
Always keep stop loss
Follow Our Tradingview Account for More Technical Analysis Updates, | Like, Share and Comment Your thoughts

Dusk Network Major Buy Opportunity, 2020 Bull Market Revisited Today Dusk Network produced the highest buy volume since early February, a pretty good signal. On the weekly timeframe, the action is happening at extreme prices, the "opportunity buy-zone."
DUSKUSDT moved below all support from 2022, 2023 and 2024. The action is happening now at the exact same baseline levels from November 2020, before the last bull market.
» From its Oct. 2020 low (0.0359) DUSK grew 3,171%.
» From its Mar. 2020 low (0.0106) DUSK grew 10,978%.
The current low happened June 2025 at 0.0427. The bearish action preceding this date can be equated to what happened before March 2020. There is always strong bearish action preceding a major bull market.
The last bull market lasted 658 days, from bottom to top. From March 2020 until late December 2021. It is hard how to say how long the next bull market will last but a similar duration would lead to April 2027 being a major date.
A bull market can happen within 6 months, just as it can take years for the entire process to unravel. Since market conditions are so different now with all the innovation, adoption and expansion, we will have to wait and see.
The fact that we have the lowest prices in almost 5 years is also an interesting fact. All weak hands have been removed and this opens up maximum growth potential in the coming years.
I think we will have an extended bull market because it is already July 2025 and we have only very early signals, which means that it will take at least 4-8 weeks before full marketwide bullish action becomes the norm, August-September 2025. Activating 2026 minimum for new cycle tops.
Conclusion
Dusk Network is trading at bottom prices, a great opportunity to accumulate; buy and hold. The future is bright for this coin.
Namaste.

DUSK ShortLike & Follow me for more details
DUSK Short,
BTC will break upward trend soon.
Will reach 103k

DUSKUSDT | Buyers Are Stepping In, But Not There YetI’ve had my eye on DUSKUSDT and this is the first serious resistance it’s facing. Buyers are becoming active , and that’s a good sign, but it’s not enough yet .
We need to see more strength, ideally a clean breakout above the red zone followed by a retest , before considering any long setups.
“I will not insist on my short idea. If the levels suddenly break upwards and do not give a downward break in the low time frame, I will not evaluate it. If they break upwards with volume and give a retest, I will look long.”
Most traders react to the first signs. I wait for confirmation. That’s the difference.
📌I keep my charts clean and simple because I believe clarity leads to better decisions.
📌My approach is built on years of experience and a solid track record. I don’t claim to know it all but I’m confident in my ability to spot high-probability setups.
📌If you would like to learn how to use the heatmap, cumulative volume delta and volume footprint techniques that I use below to determine very accurate demand regions, you can send me a private message. I help anyone who wants it completely free of charge.
🔑I have a long list of my proven technique below:
🎯 ZENUSDT.P: Patience & Profitability | %230 Reaction from the Sniper Entry
🐶 DOGEUSDT.P: Next Move
🎨 RENDERUSDT.P: Opportunity of the Month
💎 ETHUSDT.P: Where to Retrace
🟢 BNBUSDT.P: Potential Surge
📊 BTC Dominance: Reaction Zone
🌊 WAVESUSDT.P: Demand Zone Potential
🟣 UNIUSDT.P: Long-Term Trade
🔵 XRPUSDT.P: Entry Zones
🔗 LINKUSDT.P: Follow The River
📈 BTCUSDT.P: Two Key Demand Zones
🟩 POLUSDT: Bullish Momentum
🌟 PENDLEUSDT.P: Where Opportunity Meets Precision
🔥 BTCUSDT.P: Liquidation of Highly Leveraged Longs
🌊 SOLUSDT.P: SOL's Dip - Your Opportunity
🐸 1000PEPEUSDT.P: Prime Bounce Zone Unlocked
🚀 ETHUSDT.P: Set to Explode - Don't Miss This Game Changer
🤖 IQUSDT: Smart Plan
⚡️ PONDUSDT: A Trade Not Taken Is Better Than a Losing One
💼 STMXUSDT: 2 Buying Areas
🐢 TURBOUSDT: Buy Zones and Buyer Presence
🌍 ICPUSDT.P: Massive Upside Potential | Check the Trade Update For Seeing Results
🟠 IDEXUSDT: Spot Buy Area | %26 Profit if You Trade with MSB
📌 USUALUSDT: Buyers Are Active + %70 Profit in Total
🌟 FORTHUSDT: Sniper Entry +%26 Reaction
🐳 QKCUSDT: Sniper Entry +%57 Reaction
📊 BTC.D: Retest of Key Area Highly Likely
📊 XNOUSDT %80 Reaction with a Simple Blue Box!
📊 BELUSDT Amazing %120 Reaction!
📊 Simple Red Box, Extraordinary Results
I stopped adding to the list because it's kinda tiring to add 5-10 charts in every move but you can check my profile and see that it goes on..

DUSKUSDT 1W Analysis DUSK ~ 1W Analysis
#DUSK Buy gradually from here if you still have confidence in this coin with a short term target of at least 20%+
