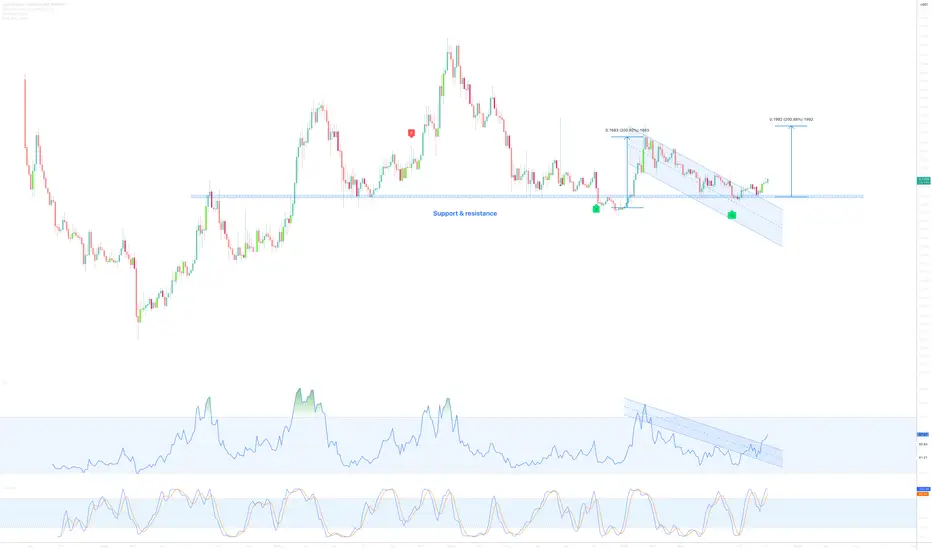
DUSK ANALYSISBelow the price is the liquidity pool. The pool is expected to be swept soon.
We have a bearish CH on the chart, which indicates an internal pullback.
It is expected that we will move from the supply side to the demand side.
Closing a daily candle above the invalidtion level will violate the analysi


Dusk Network - 200% waiting to be collectedOn the above 4-day chart price action has corrected 70% since the year began. A number of reasons now exist to be long, including:
1) Price action and RSI resistance breakouts.
2) Regular bullish divergence. All but one oscillator continues to print positive divergence with price action.
3) Look
DUSKUSDTDUSK has a triple bottom at a higher time frame demand zone.
It's also about to get a bullish MACD Cross on the Daily.
Dusk has clearly bottomed and this is a great entry for what will be one of the top performing $RWA.

Dusk ShortDusk after testing near support line break the support. Once it start dumping we will see the dusk near 0.18 in near future.

DUSKUSDT Short Setup!DUSKUSDT Technical analysis update
The price of DUSK has touched its trend support line multiple times. If the price breaks below the support line on the 4-hour chart, we can confirm a trend change.
Short Level: Below 0.292 (Waif for the breakout confirmation in 4H chart)
Stop Loss: 0.343
Regar

DUSKUSDT.1DIn this technical analysis of the DUSK/USDT daily chart, we note significant price movements and technical indicators that suggest potential upcoming trends.
Key Observations:
Current Price and Daily Change:
The chart indicates a current price of $0.2938 for DUSK/USDT, with a significant daily dec

DUSK chart, last standObviously there is a giga bid wall just below price. Blackrock narrative, working product, mainnet etc...
if it holds and btc goes for it's own highs expect a rapid mark up.

DUSKUSDT IDEAHey traders hope you are enjoying our analysis. Now we are here again with a new trading opportunity. We will discuss today about DUSK
DUSK Finally Hits Our Target +40% Profit Done ✅
Congratulations 🎉🎉🎉

See all ideas
Frequently Asked Questions
The current price of Dusk Network / TetherUS (DUSK) is 0.2348 USDT — it has fallen 0.51% in the past 24 hours. Try placing this info into the context by checking out what coins are also gaining and losing at the moment and seeing DUSK price chart.
Dusk Network / TetherUS price has fallen by 16.02% over the last week, its month performance shows a 21.84% decrease, and as for the last year, Dusk Network / TetherUS has increased by 84.30%. See more dynamics on DUSK price chart.
Keep track of coins' changes with our Crypto heatmap.
Keep track of coins' changes with our Crypto heatmap.
Dusk Network / TetherUS (DUSK) reached its highest price on Dec 29, 2021 — it amounted to 1.1743 USDT. Find more insights on the DUSK price chart.
See the list of crypto gainers and choose what best fits your strategy.
See the list of crypto gainers and choose what best fits your strategy.
Dusk Network / TetherUS (DUSK) reached the lowest price of 0.0106 USDT on Mar 13, 2020. View more Dusk Network / TetherUS dynamics on the price chart.
See the list of crypto losers to find unexpected opportunities.
See the list of crypto losers to find unexpected opportunities.
The safest choice when buying DUSK is to go to a well-known crypto exchange. Some of the popular names are Binance, Coinbase, Kraken. But you'll have to find a reliable broker and create an account first. You can trade DUSK right from TradingView charts — just choose a broker and connect to your account.
Crypto markets are famous for their volatility, so one should study all the available stats before adding crypto assets to their portfolio. Very often it's technical analysis that comes in handy. We prepared technical ratings for Dusk Network / TetherUS (DUSK): today its technical analysis shows the sell signal, and according to the 1 week rating DUSK shows the sell signal. And you'd better dig deeper and study 1 month rating too — it's neutral. Find inspiration in Dusk Network / TetherUS trading ideas and keep track of what's moving crypto markets with our crypto news feed.
Dusk Network / TetherUS (DUSK) is just as reliable as any other crypto asset — this corner of the world market is highly volatile. Today, for instance, Dusk Network / TetherUS is estimated as 0.90% volatile. The only thing it means is that you must prepare and examine all available information before making a decision. And if you're not sure about Dusk Network / TetherUS, you can find more inspiration in our curated watchlists.
You can discuss Dusk Network / TetherUS (DUSK) with other users in our public chats, Minds or in the comments to Ideas.