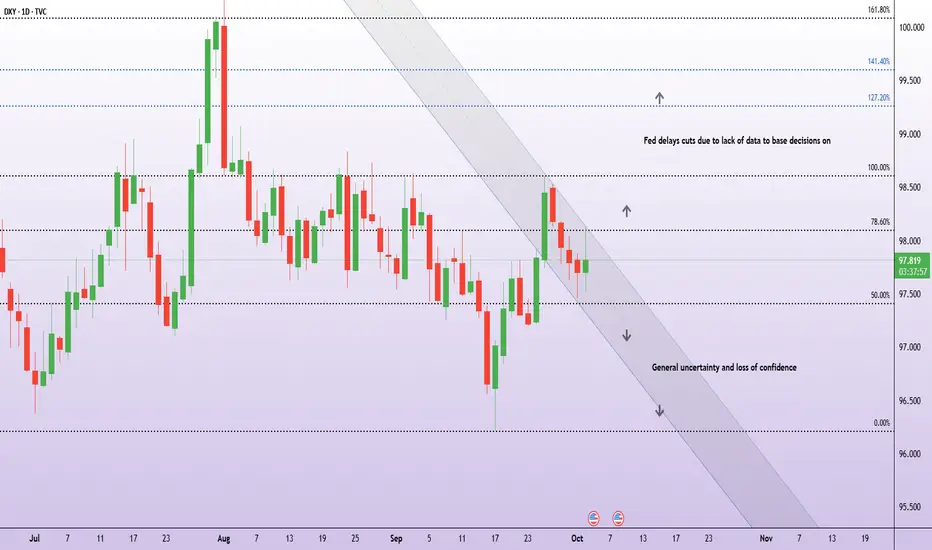
US10Y & DXY downward trend continues. US10Y 4% triggers DXY 96.TVC:US10Y has been in a downward trend despite of US Fed holding the rates stable. In this blog space I have been following the downward sloping channel since Jan 2025. Since our May 2 prediction of a 4% in %US10Y we are very much on that glide path to lower low.
TVC:US10Y making new lows. 4% upcoming. 3.5% target low. for TVC:US10Y by RabishankarBiswal — TradingView
And then we add TVC:DXY into the mix which is also making lower lows and lower highs. I had a near term target of 96 on TVC:DXY and 90 by year end. This seems unreasonable now. I must change my outlook, when the charts change.
As we see, whenever TVC:DXY touches the lower bound of the downward slopping channel it tends to rebound to the mid-point of the channel. If it does so, then we might see a 100 on TVC:DXY Before we plunge down to 96 or lower.
Hence, I revise my prediction to be bullish on TVC:DXY , but that will have no impact on TVC:US10Y which is headed lower due to Fed cutting cycle and probably higher TVC:DXY dampening inflation.
Verdict: Revise our prediction: Short term bullish on OPOFINANCE:DXY. Long term bearish. Key levels: TVC:DXY to 100 first then 96. US10Y remains bearish with 4% by Dec 2025.
DXY

Gold | Oil | Dollar | Silver | Natural Gas Price ForecastGold | Oil | Dollar | Silver | Natural Gas Price Forecast
COMEX:GC1! COMEX:SI1! AMEX:BOIL AMEX:KOLD

DXYDXY is going sideways, we meed more sideways movement this week before going up.
Disclosure: We are part of Trade Nation's Influencer program and receive a monthly fee for using their TradingView charts in our analysis.

DXY nfp again breaking the support?Hello traders, this is a complete multiple timeframe analysis of this pair. We see could find significant trading opportunities as per analysis upon price action confirmation we may take this trade. Smash the like button if you find value in this analysis and drop a comment if you have any questions or let me know which pair to cover in my next analysis.

DXY Strategy Unlocked — Will Bulls Control the Next Swing?⚡ US Dollar Index (DXY) Swing/Day Trade Setup ⚡
💹 Asset: DXY (US Dollar Index)
📈 Plan: Bullish — Pending Order Strategy
📊 US Dollar Index (DXY) Real-Time Data
Daily Change: +0.55 (+0.56%)
Day's Range: 97.62 – 98.60
52-Week Range: 96.38 – 110.18
🔔 Trade Setup (Thief Plan)
Breakout Entry: 98.800 ⚡ (Set TradingView alarm to catch the move in real time)
Stop Loss: “Thief SL” @ 24,000.0 (only after breakout confirmation).
📝 Adjust your SL based on your strategy & risk appetite, Ladies & Gentlemen (Thief OG’s).
Target: Resistance/overbought zone at 100.20
🎩 Escape target: 100.000 (take profits before market flips).
😰 Fear & Greed Sentiment
Index Level: 64 (Greed)
Market Mood: Moderately greedy, driven by:
📉 Net new 52-week highs vs. lows (bullish)
📊 VIX near averages (neutral)
🛡️ Bonds underperforming stocks (risk-on)
📈 Junk bond demand narrowing spreads (greed signal)
🌍 Fundamental & Macro Score
Fed Rate Cut Probability: 90% (Sept 18 FOMC, 25 bps cut expected)
Key Drivers:
✅ Labor Data: NFP (Sept 5) is crucial for direction.
⚠️ Trade Policy: Court ruled Trump tariffs illegal (appeal pending).
⬇️ Consumer Confidence: Michigan Index at 3-month low (58.2).
⬆️ ISM Manufacturing: Ahead of release, possible USD support.
Safe-Haven Demand: Geopolitical tensions supporting USD.
🐂 Overall Market Outlook Score
Bullish (Long): 60%
Bearish (Short): 40%
Bias: Short-term bullish as long as 97.60 holds.
USD rebound + bond yield strength + equity weakness backing USD.
⚠️ Risk: Break below 97.60 → next target 96.55 (bearish).
💡 Key Takeaways
🎯 NFP Report (Sept 5) = decisive catalyst.
⚖️ Fed debates + trade policy = medium-term uncertainty.
📉 Breakout above 98.80 is the key to bullish continuation.
🔍 Related Markets to Watch
FX:EURUSD
FX:GBPUSD
FX:USDJPY
OANDA:XAUUSD
CAPITALCOM:US30
✨ “If you find value in my analysis, a 👍 and 🚀 boost is much appreciated — it helps me share more setups with the community!”
#DXY #USD #DollarIndex #Forex #DayTrading #SwingTrading #BreakoutStrategy #ThiefTrader #TradingSetup

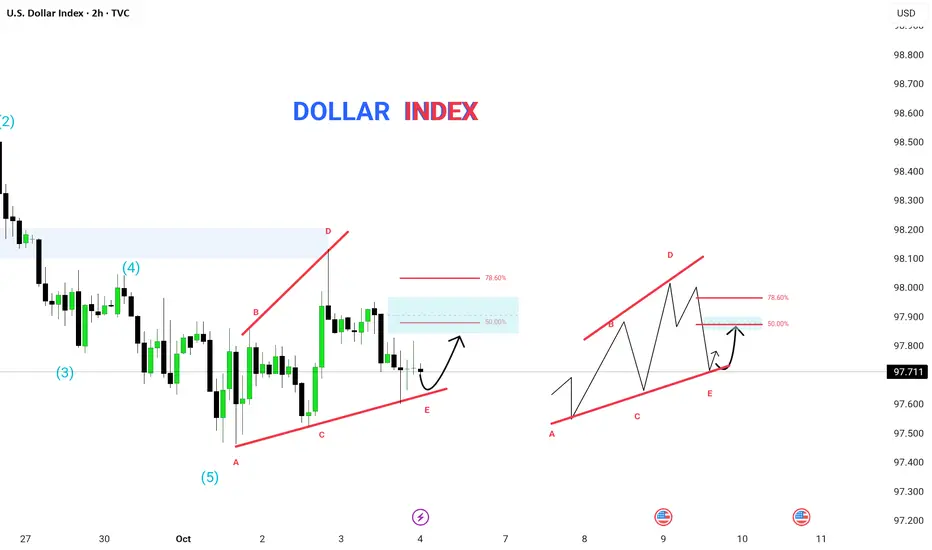
DOLLAR INDEX (DXY) – Elliott Wave & Wedge Pattern Analysis | The US Dollar Index (2H timeframe) is currently developing a corrective wedge structure (A–B–C–D–E) following a completed 5-wave bearish impulse. The current price action suggests a potential bullish correction from the E-point.
🔹 Technical Structure Breakdown:
The previous bearish leg completed a Wave (5), marking the end of an impulse cycle.
Price is now consolidating within a rising wedge pattern, forming the A–B–C–D–E structure.
The E-point is acting as a near-term support, aligning with the ascending wedge base.
Retracement targets:
50.0% → short-term correction level
78.6% → ideal reversal zone before continuation
📊 Key Levels to Watch:
Support Zone: 97.600 – 97.500
Resistance Zone: 97.900 – 98.100
Fib Targets: 50% and 78.6% retracement of the recent swing
⚡ Analyst View:
The E-point bounce could lead to a short-term bullish corrective move toward the 50–78.6% Fibonacci levels before resuming the next bearish leg as part of a broader downtrend.
Traders should monitor reaction at the wedge top for possible rejection and reversal confirmation.
🧠 Pattern: Rising Wedge inside corrective phase
🕓 Timeframe: 2H
💰 Instrument: US Dollar Index (DXY)
🎯 Bias: Short-term bullish correction → medium-term bearish continuation
EUR/USD – Wedge Pattern AnalysisThe EUR/USD (1H timeframe) is currently completing a descending wedge structure (A–B–C–D–E), showing signs of exhaustion after forming a new higher high near 1.17599.
🔹 Market Structure Overview:
The price broke above the previous descending wedge but faced resistance near 1.17599, forming a potential reversal zone.
A corrective leg is expected toward 1.17213, aligning with short-term liquidity before the next impulsive move.
The projected ABCDE structure suggests a final touch at E, followed by a possible bullish breakout from the wedge.
📊 Technical Insights:
Pattern: Descending Wedge (bullish continuation setup)
Resistance zone: 1.17500 – 1.17600
Support zone: 1.17200 – 1.17050
Confirmation level: Break and close above 1.17600
⚡ Trading Plan:
Wait for a confirmed retest of 1.17200–1.17100 region before re-entering long positions.
Aggressive buyers can monitor lower timeframe momentum near point E for early confirmation.
🧠 Timeframe: 1H
💰 Pair: EUR/USD
🎯 Bias: Bullish continuation after wedge completion

EURUSD, Euro another "black swan" making? 1/Oct/25Euro not US a new coming "black swan"? As EURUSD long term chart show it's now at "very" critical resistance" zone "Slaughtered" by US or France/UK seeking IMF bailout?

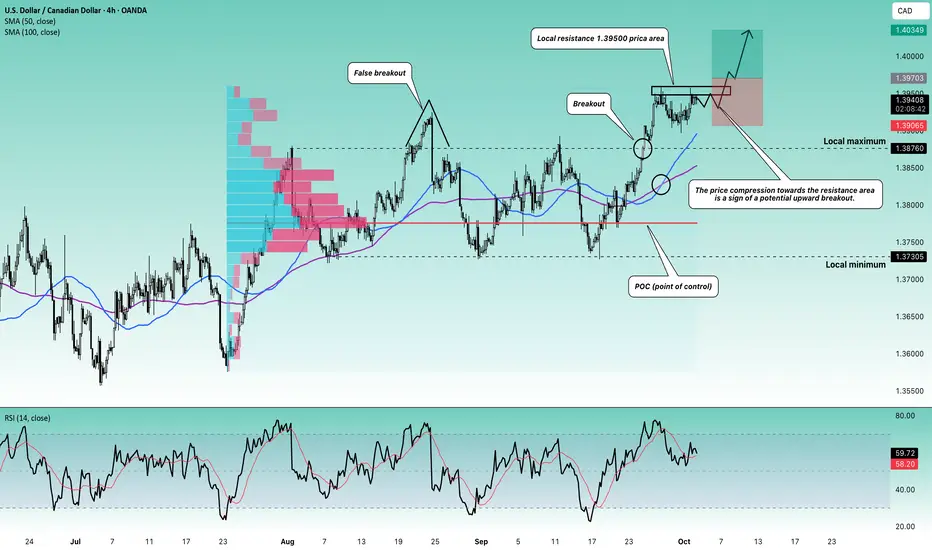
Stop!Loss|Market View: USDCAD🙌 Stop!Loss team welcomes you❗️
In this post, we're going to talk about the near-term outlook for the USDCAD currency pair☝️
Potential trade setup:
🔔Entry level: 1.39703
💰TP: 1.40349
⛔️SL: 1.39065
"Market View" - a brief analysis of trading instruments, covering the most important aspects of the FOREX market.
👇 In the comments 👇 you can type the trading instrument you'd like to analyze, and we'll talk about it in our next posts.
💬 Description: The price compression toward the 1.39500 resistance area indicates a potential upside breakout. Given the recent breakout of the 1.37305 - 1.38760 accumulation, a more significant upward movement to 1.4, 1.41, and then 1.43 is also expected. A conservative entry would be best looked for after the price immediately closes above 1.39500.
Thanks for your support 🚀
Profits for all ✅
❗️ Updates on this idea can be found below 👇
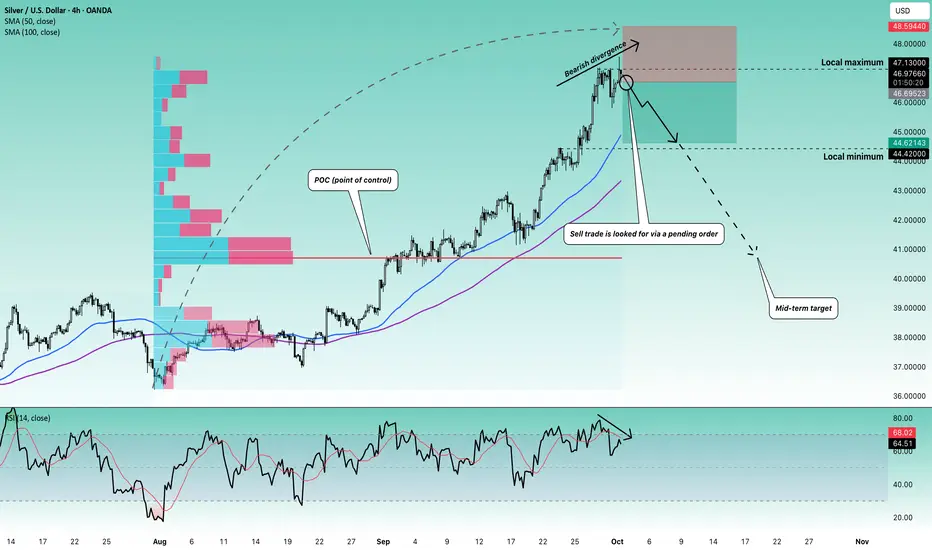
Stop!Loss|Market View: SILVER🙌 Stop!Loss team welcomes you❗️
In this post, we're going to talk about the near-term outlook for SILVER ☝️
Potential trade setup:
🔔Entry level: 46.69523
💰TP: 44.62143
⛔️SL: 48.59440
"Market View" - a brief analysis of trading instruments, covering the most important aspects of the FOREX market.
👇 In the comments 👇 you can type the trading instrument you'd like to analyze, and we'll talk about it in our next posts.
💬 Description: The buying culmination is also approaching its final phase in silver. Currently, silver has formed a bearish divergence, suggesting a downward technical reversal. The medium- and long-term priorities are more confident for sellers, but short-term factors also seem to indicate selling.
Thanks for your support 🚀
Profits for all ✅
❗️ Updates on this idea can be found below 👇
Stop!Loss|Market View: GBPUSD🙌 Stop!Loss team welcomes you❗️
In this post, we're going to talk about the near-term outlook for the GBPUSD currency pair☝️
Potential trade setup:
🔔Entry level: 1.34096
💰TP: 1.32908
⛔️SL: 1.35270
"Market View" - a brief analysis of trading instruments, covering the most important aspects of the FOREX market.
👇 In the comments 👇 you can type the trading instrument you'd like to analyze, and we'll talk about it in our next posts.
💬 Description: As with the euro, sell priority is looked for in the pound. A potential short-term entry near the 1.34000 area is being monitored. A pending order is used for a more conservative entry, and the best option is to wait for the price to close below this area and then look for a sell trade.
Thanks for your support 🚀
Profits for all ✅
❗️ Updates on this idea can be found below 👇

What data releases are at risk from the shutdown? The US dollar came under renewed pressure this week as the federal government entered its first shutdown in nearly seven years.
The shutdown, expected to last at least three days, means traders should not expect the September nonfarm payrolls (NFP) report this week. This key release, often one of the most closely watched on the calendar (by traders and the Federal Reserve), will now be delayed until government operations resume.
Other reports likely to be delayed or canceled include:
Wednesday, 8 October: FOMC Minutes
Wednesday, 15 October: Core and headline CPI inflation
Thursday, 16 October: Producer Price Index (PPI)
Thursday, 16 October: Retail sales
Friday, 17 October: Housing starts
U.S. Dollar Index (DXY) OutlookThe U.S. Dollar Index (DXY) is currently in a major corrective structure after topping out in 2022. On the monthly chart, price action suggests we are in the final stages of a Wave II correction, with a potential bottom forming around key Fibonacci retracement levels.
The correction appears to be forming a WXY/ABC structure, with wave c in progress.
Price is currently within the 0.618 – 0.786 retracement zone of the prior impulse.
The long term ascending channel from 2008 lows remains intact, with support aligning around this Fib cluster.
A bullish reaction from this zone could trigger the beginning of Wave III, which historically is strong and impulsive.
Invalidation: Sustained break below 87.00 would weaken the bullish count
Targets:
1 = 132.91
2 = 141.88
If this count holds, DXY could be setting up for a multi-year bullish cycle, suggesting that the dollar may regain strength in the coming years, impacting major USD pairs across the board.
Disclaimer:
This analysis is for informational and educational purposes only and does not constitute financial advice. Markets are dynamic and unpredictable.

EUR/USD | Euro Faces Pressure – Key Supply Zone at 1.1736–1.1762By analyzing the EUR/USD chart on the 2-hour timeframe, we can see that the price is currently trading around 1.172. I expect to see more downside movement soon.
The key supply zone is between 1.17360–1.17620, and if the price retests this area, we should watch closely for reactions. The possible downside targets are 1.17120, 1.1707, 1.16880, and 1.16720.
Please support me with your likes and comments to motivate me to share more analysis with you and share your opinion about the possible trend of this chart with me !
Best Regards , Arman Shaban

Will Case A or Case B Play Out?"📉 The chart highlights a potential selling zone between 1.17670 – 1.18053, where sellers could dominate.
🔮 Two Scenarios Ahead:
Case A:
⬆️ Price extends higher, completing a 5-wave structure before meeting strong resistance.
💥 A reversal from the top zone could trigger a strong sell-off.
Case B:
⏳ Price faces an earlier rejection near current levels after a short corrective move.
🐻 Sellers step in sooner, pushing price toward the demand zone below.
⚖️ Question to you:
👉 Which scenario feels more likely — the wave completion & reversal (Case A) or the immediate rejection (Case B)?
✍️ Drop your analysis, trade plan, and seller zone insights in the comments ⬇️

Stop!Loss|Market View: USDJPY🙌 Stop!Loss team welcomes you❗️
In this post, we're going to talk about the near-term outlook for the USDJPY currency pair☝️
Potential trade setup:
🔔Entry level: 148.918
💰TP: 151.289
⛔️SL: 147.342
"Market View" - a brief analysis of trading instruments, covering the most important aspects of the FOREX market.
👇 In the comments 👇 you can type the trading instrument you'd like to analyze, and we'll talk about it in our next posts.
💬 Description: The price has returned to the previously formed accumulation below the 149 level. Despite this, buy prioraty is saved. The market context continues to indicate that buyers are more likely to be strong than sellers. Two buying scenarios are being looked for (see chart). The primary scenario is a potential trade on a breakout of the 149 area, while the alternative scenario is the formation of another false breakout of the lower accumulation border at 146.300 - 149.
Thanks for your support 🚀
Profits for all ✅
❗️ Updates on this idea can be found below 👇

EUR/USD - U.S Government Shutdown ? 📊 Setup:
EUR/USD has successfully broken out of the descending channel on the H1 timeframe. Price is holding above the breakout level, supported by the Ichimoku cloud and a nearby demand zone. With potential U.S. government shutdown news weighing on the dollar, EUR/USD shows strong upside potential.
📈 Trade Plan:
Buy Zone: 1.1710 – 1.1730 (support zone & breakout retest)
1st Resistance Target: 1.1837
2nd Resistance Target: 1.1891
Bias: Bullish as long as price holds above support zone and channel breakout.
✅ Support Factors:
Clear Channel Breakout on H1
Confluence with Ichimoku bullish bias
Fundamental support: Possible U.S. government shutdown → weaker USD outlook
Strong demand zone cushioning downside
#EURUSD #Forex #Trading #TechnicalAnalysis #PriceAction #ForexSignals #FXTrading #Euro #USD #Breakout #TradingView
⚠️ Disclaimer:
This analysis is for educational purposes only and not financial advice. Always do your own research and manage risk before trading.
💬 Support the Analysis:
If this setup adds value, don’t forget to Like 👍, Comment 💬, and Follow ✅ for more timely updates.

US DOLLAR LIQUIDITY GAMES🇺🇸 US Dollar Range Politics – Liquidity Before Clarity
The dollar isn’t trending — it’s negotiating.
📊 Current Setup
U.S. Dollar Index (DXY): 98.322 → testing the value area high
Range Floor: 96.747 → the value area low
Structure: Bearish range, with liquidity being hunted before any true direction emerges.
🏛️ Macro Backdrop
Tariffs are reshaping global flows.
Fiscal gridlock + shutdown risk clouds investor confidence.
Inflation + Fed policy signals remain mixed.
Every headline feels like an amendment to a bill no one fully understands.
The result: the dollar drifts sideways in a liquidity-seeking phase. Traders should expect chop inside the box until a decisive catalyst (data, Fed action, or policy shift) provides clarity.
🌍 Cross Pair Impact
This stalemate spills into the majors:
EURUSD & GBPUSD → reflecting the same sideways ranges and fake-outs.
USDJPY → volatility compressed, waiting for dollar direction.
Crosses are trading in sympathy — liquidity hunts on both ends, with no clean trend until DXY escapes its range.
🧭 Takeaway: The dollar is boxed in by politics and policy. Patience rules here: trade the range, wait for the breakout.

XAU/USD | Gold Rally Continues – Can It Push Toward $4K?By analyzing the gold chart on the 1-hour timeframe, we can see that after reaching the $3,784 supply zone, the price faced selling pressure and corrected down to $3,754. But with the start of the new week, gold continued its rally, hitting a new high at $3,831.
As I mentioned in previous analyses, gold isn’t far from the $4,000 mark . With the current momentum and no structural change in the market, we should assume the bullish trend will continue. The next upside targets are $3,840, $3,860, and $3,880 .
Key demand zones are $3,804–$3,806, $3,799–$3,801, and $3,784–$3,791.
Related analysis :
Please support me with your likes and comments to motivate me to share more analysis with you and share your opinion about the possible trend of this chart with me !
Best Regards , Arman Shaban

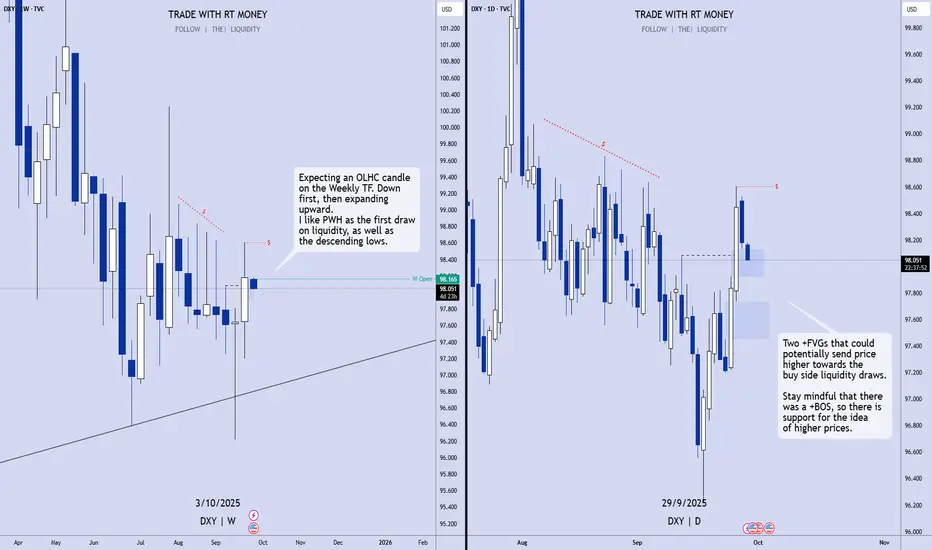
US Dollar Index: Bullish! Buy The Dip!Expecting price to retrace into the +FVGs below. Look on the 1H for a CISD when price comes into contact with either of the two poi's. Once a directional change is confirmed, buy it.
Enjoy!
May profits be upon you.
Leave any questions or comments in the comment section.
I appreciate any feedback from my viewers!
Disclaimer:
I do not provide personal investment advice and I am not a qualified licensed investment advisor.
All information found here, including any ideas, opinions, views, predictions, forecasts, commentaries, suggestions, expressed or implied herein, are for informational, entertainment or educational purposes only and should not be construed as personal investment advice. While the information provided is believed to be accurate, it may include errors or inaccuracies.
I will not and cannot be held liable for any actions you take as a result of anything you read here.
Conduct your own due diligence, or consult a licensed financial advisor or broker before making any and all investment decisions. Any investments, trades, speculations, or decisions made on the basis of any information found on this channel, expressed or implied herein, are committed at your own risk, financial or otherwise.
Stop!Loss|Market View: GOLD🙌 STOP!Loss team welcomes you❗️
In this post, we're going to talk about the near-term outlook for GOLD ☝️
Potential trade setup:
🔔Entry level: 3811.880
💰TP: 3654.765
⛔️SL: 3915.820
"Market View" - a brief analysis of trading instruments, covering the most important aspects of the FOREX market.
👇 In the comments 👇 you can type the trading instrument you'd like to analyze, and we'll talk about it in our next posts.
💬 Description: Sell priority is looking for gold, and there are two scenarios (see chart). Technically, we're witnessing a buying culmination, and a downward reversal is likely coming soon. The main target is seen near the POC, specifically the 3654 level. In the longer term, deeper targets are likely to be looked for.
Thanks for your support 🚀
Profits for all ✅
❗️ Updates on this idea can be found below 👇

Bearish drop off?The US Dollar Index (DXY) is rising towards the pivot which acts as a pullback resistance that aligns with the 50% Fibonacci retracement and could drop to the 1st support.
Pivot: 98.12
1st Support: 97.23
1st Resistance: 98.77
Disclaimer:
The above opinions given constitute general market commentary, and do not constitute the opinion or advice of IC Markets or any form of personal or investment advice.
Any opinions, news, research, analyses, prices, other information, or links to third-party sites contained on this website are provided on an "as-is" basis, are intended only to be informative, is not an advice nor a recommendation, nor research, or a record of our trading prices, or an offer of, or solicitation for a transaction in any financial instrument and thus should not be treated as such. The information provided does not involve any specific investment objectives, financial situation and needs of any specific person who may receive it. Please be aware, that past performance is not a reliable indicator of future performance and/or results. Past Performance or Forward-looking scenarios based upon the reasonable beliefs of the third-party provider are not a guarantee of future performance. Actual results may differ materially from those anticipated in forward-looking or past performance statements. IC Markets makes no representation or warranty and assumes no liability as to the accuracy or completeness of the information provided, nor any loss arising from any investment based on a recommendation, forecast or any information supplied by any third-party.

Macro Data can keep Gold Pushing! Key Levels:
Daily High (DH): 3899.5
Monthly High (MH): 3899.5
Daily Low (DL): 3820.4
Weekly High (WH): 3824.6
Weekly Low (WL): 3717.7
📊 Technical Outlook
Price is currently trading near 3890, holding strong after yesterday’s impulsive bullish move. If we see a clean break back above yesterday’s high, continuation toward DH / MH 3899.5 looks highly probable. The recent structure continues to support bullish pressure with higher highs and shallow retracements.
🌍 Macro Watch
All eyes are on the U.S. Government shutdown threat tonight at midnight.
If Congress fails to reach an agreement, volatility in safe-haven assets like gold could spike.
A shutdown scenario would likely support continued bullish pressure on gold as risk sentiment shifts.
🎯 Trade Idea
Watching for a reclaim and hold above yesterday’s high → confirmation for bullish continuation.
Short-term target: 3899.5 (DH / MH) liquidity.
Failure to hold above could open a retrace back toward 3820–3824 support zone (DL / WH).
✅ Summary
Bias remains bullish as long as price holds near/above yesterday’s high. Macro uncertainty (government shutdown) could act as a catalyst, so staying nimble and risk-aware is key.
⚡️What do you think — does gold have enough momentum to clear 3899.5, or will macro risk force a deeper retrace first?
