DXY — FRGNT FUN COUPON FRIDAY DAILY CHART FORECAST📅 Q1 | D9 | W1 | Y26
📊 DXY — FRGNT FUN COUPON FRIDAY DAILY CHART FORECAST
🔍 Analysis Approach
I’m applying a developed version of Smart Money Concepts, with a structured focus on:
• Identifying Key Points of Interest (POIs) on Higher Time Frames (HTFs) 🕰️
• Using those POIs to define a clear and controlled trading range 📐
• Refining those zones on Lower Time Frames (LTFs) 🔎
• Waiting for a Break of Structure (BoS) as confirmation ✅
This process keeps me precise, disciplined, and aligned with market narrative, rather than reacting emotionally or chasing price.
💡 My Motto
“Capital management, discipline, and consistency in your trading edge.”
A positive risk-to-reward ratio, combined with a high-probability execution model, is the backbone of any sustainable trading plan 📈🔐
⚠️ On Losses
Losses are part of the mathematical reality of trading 🎲
They don’t define you — they are necessary, expected, and managed.
We acknowledge them, learn, and move forward 📊➡️
🙏 I appreciate you taking the time to review my Daily Forecast.
Further context and supporting material can be found in the Links section.
Stay sharp 🧠
Stay consistent 🎯
Protect your capital 🔐
— FRGNT 🚀📈
TVC:DXY
Dxyanalysis

DXYPrice is testing a 1D FVG and forming a 4H OB as confirmation for downside continuation, while also having tested a bearish 1W OB. At this point, I am waiting for one of the scenarios to play out.

US Dollar Index Outlook | Trend Strength vs Key Resistance💰 DXY (US DOLLAR INDEX) - SWING TRADE OPPORTUNITY 📊
Bullish Momentum Play with WEIGHTED MA Breakout Confirmation
🎯 MARKET CONTEXT
Current Price: 98.53 | Trend: Consolidation Zone (97.00 - 100.00 Range)
Status: Preparing for breakout above Monday highs at 98.85 🚀
After the worst annual performance since 2017 (-9.3% in 2025), the DXY is regaining momentum in early 2026. Bulls are establishing strong demand at critical support levels with both 50-hour and 200-hour moving averages acting as backstops. The technical setup suggests a potential run toward the 99.30-99.50 resistance zone on breakout confirmation.
📈 TECHNICAL SETUP - LAYERING STRATEGY (Thief Entry Method)
Entry Strategy: Multiple Limit Order Layers 🎰
Using the Smart Layering Technique for optimal risk-adjusted positioning:
Layer 1 Entry @ 98.40 💰 Support Zone Entry (33% Position Size)
This is your first buy trigger at the lower support consolidation zone. Activate your first limit buy here to catch early momentum before the main move. This layer catches sellers panicking at support levels. Strong psychological anchor for building position.
Layer 2 Entry @ 98.50 📊 HULL MA Pull-Back Zone (33% Position Size)
Your second layer activates at the HULL moving average pullback confirmation point. This is where momentum traders get shaken out—perfect opportunity to add. Average your cost higher while securing better entry confirmation. This level shows institutional interest.
Layer 3 Entry @ 98.60 🚀 Accumulation Zone (34% Position Size)
Your final layer triggers at the upper consolidation band where accumulation is strongest. By this point, you've built 100% of your position with an average cost significantly lower than a single market order. This creates psychological momentum as you're "buying strength" into the breakout zone.
Pro Tip: You can adjust layer spacing based on volatility. Wider layers = patience for perfect fills. Tighter layers = aggressive accumulation for faster positioning. This method reduces average entry cost while managing drawdowns effectively. Smart traders stack positions like this instead of FOMO market buying. 🎯
Stop Loss (SL): 98.20 🛑
Hard stop at the 4-hour support consolidation level. This represents a breach of the lower Rectangle boundary.
⚠️ Disclaimer: This is MY suggested SL. You maintain complete control over your risk management. Scale your position size accordingly to your personal risk tolerance. Only risk what you can afford to lose completely. This is NOT financial advice—trade at your own risk.
Target Zone (TP): 99.30 - 99.50 🎊
Primary Resistance Level where overbought conditions + trapped short sellers create a natural profit-taking zone. This level aligns with Monday's highs (98.85) and extends toward the 99.30 psychological level.
⚠️ Disclaimer: This is my projected resistance zone based on technical analysis. Market conditions change rapidly. Take partial profits at 99.30 and trail your stop on remaining position. You decide your exit strategy—this is guidance, not a guarantee.
🔗 RELATED PAIRS TO WATCH (Correlation Analysis)
1️⃣ EUR/USD (FX: FX:EURUSD ) 📉
Correlation: NEGATIVE (inverse to DXY)
Current Level: ~1.1716 | Watch: 1.3520-1.3560 range
Key Driver: Euro manufacturing weakness (Dec: 9-month low) supports USD strength
Action: If DXY breaks 99.30, expect EUR/USD to test 1.15 support levels
2️⃣ GBP/USD (FX: FX:GBPUSD ) 💷
Correlation: NEGATIVE (inverse to DXY)
Current Level: ~1.3445 | 2026 Forecast: 1.36-1.40 range expected
Key Driver: BOE cutting rates more gradually than Fed = GBP resilience likely
Action: Sterling strength could limit DXY upside; watch for BOE communications
3️⃣ USD/JPY (FX: FX:USDJPY ) 🇯🇵
Correlation: POSITIVE (moves WITH DXY)
Current Level: ~156.65 | 10-Month Low: 157.89 (Nov 2025)
Key Driver: BOJ Intervention Risk + Rate Hike Expectations
Action: BOJ still holds limited rate hike probability until July—JPY weakness supports USD strength
4️⃣ DXY vs USD/CAD (FX: OANDA:USDCAD ) 🇨🇦
Correlation: MIXED (commodity-sensitive)
Watch Level: Canadian economic data + BoC policy divergence
Key Driver: CAD weakness when risk-off sentiment dominates
Action: Oil prices + BoC dovish stance = support for USD/CAD upside
📰 FUNDAMENTAL & MACRO DRIVERS (Live as of Jan 8, 2026)
🚨 SHORT-TERM CATALYSTS (This Week/Next Week)
✅ US Employment Data (Jobs Report - Jan 10)
Latest: -105K jobs (WORSE than +64K expected)
Impact: Signals economic weakness BUT triggers "safety trade" into USD
Watch: If jobs continue weak → confirms Fed rate cuts → longer-term DXY weakness
Action: Initial dip likely, then reversal higher on safe-haven demand
✅ Fed Rate Cut Expectations - CRITICAL
Market Pricing: 2 x 25bp cuts in 2026 (vs Fed's 1 cut projection)
Fed Communication Risk: Multiple Fed officials saying more dovish stance needed
Richmond Fed President Barkin: Monetary policy requires "finely tuned judgments"
Impact: Rate cut expectations = DXY headwind long-term, but near-term bounces likely
✅ ISM Manufacturing PMI (Already Released)
Dec Data: Sharpest contraction since 2024 | Services PMI also revised lower
Impact: Economic slowdown narrative = negative for USD long-term
But: Safe-haven demand provides near-term support
✅ Geopolitical Risk - Venezuela Situation
Recent: US military action in Venezuela sparked brief safe-haven rally
Current: Concerns eased; initially pushed DXY to 98.80, faded back to 98.50
Watch: Any escalation = temporary USD strength; normalization = weakness
📊 MID-TERM DRIVERS (Next 1-3 Months)
🔴 Federal Reserve Independence Concerns
Timeline: Fed Chair selection happening THIS MONTH (Trump announcement)
Market Fear: New Chair (May 2026) may prioritize rate cuts over inflation control
DXY Impact: Significant structural selling pressure if dovish chair appointed
Watch: Trump's nominee announcement = potential volatility catalyst
🔴 US Inflation Data (CPI Reports)
Status: Core inflation sticky; any surprise UP = DXY support
Risk: If inflation surprises DOWN = accelerates rate cut timeline = DXY weakness
Watch: Jan 15 & Feb 12 CPI releases
💚 US Fiscal Policy Uncertainty
Wildcard: Trade policy, tariffs, government spending debates
Scenario 1: Tariffs trigger inflation → Fed stays hawkish → DXY stronger
Scenario 2: Fiscal stimulus accelerates early 2026 → inflation risk → mixed effects
🌍 INTERNATIONAL FACTORS
🇪🇺 Eurozone Economic Weakness
Factory Activity: 9-month low in December
Support: Lower inflation readings in Germany/France (good news for ECB)
DXY Impact: Euro weakness = relative USD strength support ✅
🇯🇵 Bank of Japan (BOJ) Policy
Current: BOJ raised rates 2x in 2025 but YEN still underperformed
Forward View: Markets pricing <50% chance of BOJ hike until July 2026
DXY Impact: Yen weakness = carry trade pressure = mild USD strength
💡 2026 DXY SCENARIO ANALYSIS
BASE CASE: "V-Shaped" Year
H1 2026: DXY expected to decline toward 94.00 as Fed cuts rates
H2 2026: Rebound above 99.00 as fiscal stimulus drives inflation + yields higher
Current Position (98.53): Setting up for H1 weakness, but near-term bounces likely
BULL CASE (Our Setup) 🚀
Thesis: Consolidation breaks above 99.30 → tests 100.00
Catalyst: Labor data weakness + geopolitical safety bid extension
Resistance: 99.30-99.50, then 100.00 psychological level
Risk: Only viable if jobs report doesn't accelerate rate cut expectations
BEAR CASE 📉
Thesis: Fed cuts rates aggressively → DXY collapses toward 94.00
Catalyst: New dovish Fed Chair + prolonged economic weakness
Support: 97.50-97.00 rectangle lows become prime targets
Timeline: Likely unfolding H1 2026
⚡ KEY TAKEAWAYS FOR TRADERS
1️⃣ Entry: Use the 3-layer method at 98.40 / 98.50 / 98.60—cost-averages your fills
2️⃣ Risk: Hard stop at 98.20; size accordingly to your account
3️⃣ Reward: Target 99.30-99.50 for near-term swing (100-150 pips potential)
4️⃣ Watch: Jobs report (Jan 10) = weekly game-changer | Fed chair news (late Jan) = structural pivot
5️⃣ Correlations: Monitor EUR/USD, GBP/USD, USD/JPY for confirmation of DXY momentum
⚠️ TRADING DISCLAIMER
🚨 This is NOT financial advice. I am NOT a licensed financial advisor or analyst. This setup represents my personal technical + macro analysis framework. Markets are unpredictable. All trades carry RISK OF TOTAL LOSS. You are responsible for:
✅ Your own position sizing
✅ Your own stop loss placement
✅ Your own profit target selection
✅ Conducting independent research before entry
Trade responsibly. Risk what you can afford to lose completely. Accept losses gracefully. Consistency beats perfection. 🎯
Last Updated: January 8, 2026
DXY Real-Time Price: 98.57 | 52-Week Range: 96.22 - 110.18
Good luck, traders! May your entries be clean and your exits cleaner. 💼📈

DXY 📉 TVC:DXY (US Dollar Index) Technical Analysis (4H Timeframe)
The overall trend for the Dollar Index is currently bearish, as the price action is trading below a downward-sloping EMA 200 (black line) and consistently forming lower highs and lower lows 📉. The momentum remains weak, with large bearish candles dominating previous impulsive moves. Currently, the price is in a corrective phase, attempting to test the EMA 50 (red line) and the broken structural zone at 98.680 USD. The EMA 50 is trending below the EMA 200, confirming the bearish pressure in the medium term. If the price fails to break back above the current resistance level with strong candle bodies, we expect a continuation of the downtrend toward the next liquidity targets 📉.
🔑 Key Levels to Watch:
Major Resistance Zone: 99.250 USD (Previous Peak & Grey Box) 🚩
Immediate Pivot Resistance: 98.680 USD (Current Test Area) 💡
First Downside Target: 98.150 USD (Recent Support / Grey Box) 🎯
Secondary Support Level: 97.770 USD (Solid Black Line) ⚡
Primary Demand Origin: 97.300 USD (Major Grey Box) 🛡️
Long-term Resistance: 100.344 USD – 100.800 USD 🏗️

DXY — FRGNT DAILY CHART FORECAST Q1 | D7 | W1 | Y26📅 Q1 | D7 | W1 | Y26
📊 DXY — FRGNT DAILY CHART FORECAST
🔍 Analysis Approach
I’m applying a developed version of Smart Money Concepts, with a structured focus on:
• Identifying Key Points of Interest (POIs) on Higher Time Frames (HTFs) 🕰️
• Using those POIs to define a clear and controlled trading range 📐
• Refining those zones on Lower Time Frames (LTFs) 🔎
• Waiting for a Break of Structure (BoS) as confirmation ✅
This process keeps me precise, disciplined, and aligned with market narrative, rather than reacting emotionally or chasing price.
💡 My Motto
“Capital management, discipline, and consistency in your trading edge.”
A positive risk-to-reward ratio, combined with a high-probability execution model, is the backbone of any sustainable trading plan 📈🔐
⚠️ On Losses
Losses are part of the mathematical reality of trading 🎲
They don’t define you — they are necessary, expected, and managed.
We acknowledge them, learn, and move forward 📊➡️
🙏 I appreciate you taking the time to review my Daily Forecast.
Further context and supporting material can be found in the Links section.
Stay sharp 🧠
Stay consistent 🎯
Protect your capital 🔐
— FRGNT 🚀📈
TVC:DXY

DXYU.S Dollar Index
- Order Block
- Fair Value Gap
- Completed " 12345 " Impulsive Waves and " A " Corrective waves
- Fibonacci Level - 50.00% / 61.80%
- Demand Zone

Bullish reversal?US Dollar index (DXY) has bounced off the pivot, which acts as an overlap support that aligns with the 61.8% Fibonacci retracement and could rise to the 1st resistance, which acts as a multi-swing high resistance.
Pivot: 97.74
1st Support: 96.37
1st Resistance: 100.30
Disclaimer:
The opinions given above constitute general market commentary and do not constitute the opinion or advice of IC Markets or any form of personal or investment advice.
Any opinions, news, research, analyses, prices, other information, or links to third-party sites contained on this website are provided on an "as-is" basis, are intended to be informative only, and are not advice, a recommendation, research, a record of our trading prices, an offer of, or solicitation for, a transaction in any financial instrument and thus should not be treated as such. The information provided does not involve any specific investment objectives, financial situation, or needs of any specific person who may receive it. Please be aware that past performance is not a reliable indicator of future performance and/or results. Past performance or forward-looking scenarios based upon the reasonable beliefs of the third-party provider are not a guarantee of future performance. Actual results may differ materially from those anticipated in forward-looking or past performance statements. IC Markets makes no representation or warranty and assumes no liability as to the accuracy or completeness of the information provided, nor any loss arising from any investment based on a recommendation, forecast, or any information supplied by any third party

DXY: Short-Term Stabilisation With a Potential Shift in MomentumThe U.S. Dollar Index continues to consolidate after recent volatility, with price action suggesting a phase of short-term stabilisation. Momentum appears mixed, indicating the market is assessing the next directional move rather than committing aggressively in either direction. This type of structure often reflects a pause in sentiment, where participants await fresh catalysts before driving expansion.
Disclosure: We are part of Trade Nation's Influencer program and receive a monthly fee for using their TradingView charts in our analysis.

DXY Looks BullishDXY Looks Bullish
DXY looking bullish which means we should be booking profits on every pump in stocks, crypto and metals in 2026. Atleast this is what my TA says.
Would love to hear thoughts here.

DXY analysis for the weekMy outlook for DXY is for price to continue dropping after the recent mitigation of a supply zone, which has already supported the bullish move we’ve seen on EU. I’m expecting further downside from here.
If price does push higher, there is a clean supply zone above that I’ll be watching closely, as I believe it could present another strong opportunity for the dollar to roll over and continue lower.
Confluences for This Bias:
• Price has recently mitigated a strong supply zone
• Overall structure remains bearish
• Liquidity resting below that price may look to target
• Price is within a valid dealing range
P.S. If price breaks above the current high, I wouldn’t be surprised to see a short-term bullish push before any further downside.

Dollar Index Respects Trend Support — Buyers in Control💵 DXY DOLLAR INDEX | Swing Trade Setup 📊
Strategic Bullish Recovery with Multi-Layer Entry Strategy
📈 CURRENT MARKET STATUS
Current Price: 98.02 - 98.36 USD 📍 | Bias: BULLISH SWING TRADE 🟢 | Timeframe: 4H-Daily Swing Trade ⏰ | Market Condition: Pullback to Support Zone 💪
🎯 TECHNICAL SETUP
Plan: Bullish breakout from triangular moving average pullback with strong support confirmation from the 97.50-97.90 demand zone. 📉➡️📈
📍 MULTI-LAYER ENTRY STRATEGY (Thief Strategy)
Using Limit Order Layering - Scale-In Approach for Risk Management
Utilize multiple buy limit orders to reduce entry risk and maximize fill probability:
🔵 Layer 1 @ 97.60 📍 - 30% Position Size - Initial Entry at Strong Support ✅
🔵 Layer 2 @ 97.70 📍 - 30% Position Size - Secondary Level Confirmation ✅
🔵 Layer 3 @ 97.80 📍 - 25% Position Size - Tertiary Entry Momentum Build 📈
🔵 Layer 4 @ 97.90 📍 - 15% Position Size - Final Layer Aggressive Entry 🚀
✅ Pro Tip: Adjust layer prices based on your risk tolerance and account size. Scalable entry reduces overall trade risk and improves entry quality significantly. 💡
🛑 STOP LOSS
🔴 Hard SL @ 97.50 📍 - Below demand zone for protection 🛡️
📊 Risk: -50 pips maximum per trade 📉
⚠️ NOTE: Stop loss placement is your personal risk decision. Dear Ladies & Gentleman (Thief OG's) - Manage your own risk parameters accordingly. This is YOUR choice, YOUR responsibility, YOUR profit or loss. 🎯
🎁 PROFIT TARGETS
🟢 Target 1 (Easy Win) @ 98.30 📍 - +50 pips 💰 - Take 25% profit and lock in gains immediately ✅
🟢 Target 2 (Main Target) @ 98.60 📍 - +80 pips 💵 - Take 40% profit at moving average resistance zone 📊
🟢 Target 3 (Extended) @ 98.80 📍 - +100 pips 🤑 - Trailing stop on remaining 35% position for momentum capture 🚀
🟢 Target 4 (Aggressive) @ 99.00+ 📍 - +130+ pips 🎊 - Let your winners run with intelligent trailing stops for maximum profit 📈
⚠️ NOTE: High voltage electric gate acts as STRONG RESISTANCE + overbought zone detected at 98.50-98.70. This is a potential market TRAP zone - please take profits responsibly and don't get greedy. Final TP is YOUR personal choice based on YOUR strategy and risk appetite. 🎲
💡 TECHNICAL ANALYSIS BREAKDOWN
Bullish Confluence Factors ✅:
✅ Strong support from 97.50-97.90 demand zone (Historical reaction area proven) 📍
✅ Triangular moving average confirmation (Key technical indicator) 📊
✅ Pullback from overbought conditions (Healthy correction setup) 🔄
✅ Potential base formation pattern (Accumulation zone visible) 🏗️
⚡ 52-week range: 96.22 - 110.18 (Plenty of room for upside movement) 📈
Risk Factors to Monitor ⚠️:
⚠️ Overbought signals at 98.50-98.70 (Strong resistance overhead) 🚧
⚠️ Market trap potential (Price rejection very possible) 🪤
⚠️ Thin year-end trading volumes (Additional volatility risk) 📉
🌍 RELATED PAIRS TO WATCH (Dollar Correlation Analysis)
HIGH NEGATIVE CORRELATION 🔴 (Inverse to DXY - If DXY up, these go down):
🔗 EUR/USD - Correlation: -0.95 ⚡ (STRONGEST HEDGE PAIR) - EUR is 57.6% of DXY weight, watch for BrexitNews & ECB statements 📢
🔗 Gold (XAUUSD) - Correlation: -0.90 ⚡ (Safe-haven inverse) - Precious metals rise when USD weakens, strong economic indicator 💛
🔗 Crude Oil (XTIUSD) - Correlation: -0.75 ⚡ (Commodity proxy) - Weaker dollar = higher oil prices, OPEC decisions matter 🛢️
🔗 Silver (XAGUSD) - Correlation: -0.88 ⚡ (Precious metals) - Follows gold closely but with more volatility, watch industrial demand 🏭
🔗 Bitcoin (BTCUSD) - Correlation: -0.65 ⚡ (Crypto hedge) - Dollar weakness = crypto strength, watch Fed policy closely 🪙
OTHER MAJOR PAIRS 📊 (Direct constituents of DXY Index):
🔗 USD/JPY - DXY Weight: 13.6% 📊 - Currently 156.44 - Watch BOJ (Bank of Japan) statements + Yen carry trades 🇯🇵
🔗 GBP/USD - DXY Weight: 11.9% 📊 - Brexit dynamics remain + BoE policy movements important 🇬🇧
🔗 USD/CAD - DXY Weight: 9.1% 📊 - Oil-sensitive pair, commodity correlations + BoC rate decisions 🇨🇦
🔗 USD/SEK - DXY Weight: 4.2% 📊 - Nordic economy barometer + Riksbank policy 🇸🇪
🔗 USD/CHF - DXY Weight: 3.6% 📊 - Safe-haven currency pair, SNB decisions matter 🇨🇭
📰 FUNDAMENTAL FACTORS & ECONOMIC DRIVERS
🔴 HIGH IMPACT CATALYSTS (Coming Up)
📌 FOMC Minutes Release ⏰ - CRITICAL for USD direction 🚨 - Expected guidance on 2026 rate cuts (2 cuts currently priced in by markets) 📉 - Dovish bias would support DXY weakness, hawkish would support strength 📊
📌 Fed Chair Announcement (Early January 2026) - Trump administration to announce Powell's successor 👔 - Market uncertainty = potential big USD volatility swings 💥 - Could change entire policy expectations for 2026 🎯
📌 US Non-Farm Payroll (NFP) (First Friday of Each Month) 👥 - Strong employment data = Bullish for USD 📈 - Weak employment data = Bearish for USD 📉 - Previous trend showing mixed signals, watch closely 🔍
📌 US CPI Release (Mid-month Inflation Data) 📊 - Inflation currently at 2.7% (Dec 18, 2025 data) 📍 - Below Fed target of 3%, supports rate-cut narrative 🎯 - This weakens USD support structure 📉
📌 US Pending Home Sales 🏠 - Already jumped +3.3% in November = Bullish economic indicator ✅ - Consumer strength supports USD flows 💪
🟠 MACRO HEADWINDS PRESSURING DXY (Current Environment)
💨 2025 Dollar Decline - Already down -9.6% year-to-date (worst year since 2017!) 📉 - This is a major structural weakness signal for USD
💨 Trump Tariff Uncertainty - Aggressive tariff policies creating significant dollar weakness 📉 - Protectionism narrative reduces USD safe-haven demand 🚫
💨 Fed Independence Concerns - Political pressure on Federal Reserve reduces hawkish USD support 📢 - Powell successor uncertainty adds volatility 🎲
💨 Rate Differential Narrowing - Other central banks holding rates higher relative to US expectations 📊 - Makes USD less attractive on yield basis 💰
💨 Fiscal Deficit Concerns - US government spending pressures mounting 🏛️ - Structural USD weakness risk for 2026 ⚠️
🟢 BULLISH DXY FACTORS (Supporting Our Trade)
💪 Stronger GDP - Q3 GDP data came in strong, showing economic resilience 📈 - Manufacturing sector showing signs of recovery 🏭
💪 Labor Market Resilience - Despite recent volatility, employment remains relatively stable 👥 - Fewer major job losses than expected 📊
💪 Safe-Haven Demand - Geopolitical tensions support USD flows into safe assets 🛡️ - Middle East conflicts, Russia-Ukraine ongoing ⚠️
💪 Real Yield Attractiveness - US 10Y Treasury yield at 4.13% is attractive vs. peer nations 💰 - Investors seeking better returns flowing to USD 📈
💪 Month-End Flows - Potential technical bounces from dollar repositioning happening now 📊 - Year-end rebalancing creates support zones 🎯
📊 HISTORICAL CONTEXT & KEY LEVELS
🔵 96.22 - 52-week LOW (October 2025) - Major support zone 📍
🔵 97.50-97.90 - DEMAND ZONE (Our current trade setup area) ✅ - Strong historical reaction level 📊
🔵 98.30-98.70 - RESISTANCE ZONE (Strong overbought area with trap potential) 🚧 - Take profits here, don't be greedy 💡
🔵 99.00 - Psychological round number resistance 📍 - Major price target for aggressive traders 🎯
🔵 110.18 - 52-week HIGH (February 2025 event-driven spike) - Distant target for extended bull 🚀
🎲 RISK MANAGEMENT CHECKLIST (Must Do)
✅ Only risk 1-2% of your account per single trade 💰 - Never go all-in, always protect capital 🛡️
✅ Use stop loss without ANY exceptions 🛑 - No emotional decisions, pre-set your exit 📍
✅ Scale into positions with limit orders 📊 - Don't chase market price, let price come to you 🎯
✅ Monitor FOMC announcements closely 📢 - Set alerts for important economic releases 🔔
✅ Watch geopolitical news (Fed, Trump statements) 📰 - Breaking news can reverse markets instantly ⚡
✅ Take profits at resistance levels 💹 - Lock in gains, don't let winners turn into losers 📈
✅ Don't add to losing positions 🚫 - Patience is key, better opportunities always come 🎯
✅ Keep detailed records of all entries/exits 📝 - Track your performance and improve continuously 📊
⚡ TRADE PLAN SUMMARY
🎯 Setup: Swing trade LONG on DXY from demand zone 97.50-97.90 📍
🎯 Entry Method: 4-layer limit order strategy (Scale-in approach recommended) 📊
🎯 Stop Loss: Hard stop at 97.50 (No exceptions, no moving it) 🛑
🎯 Profit Targets: 98.30 (T1) → 98.60 (T2) → 98.80 (T3) → 99.00+ (T4) 🎁
🎯 Risk/Reward Ratio: Approximately 1:1.6 to 1:2.6 depending on which layer you enter 💹
🎯 Timeframe: 4H-Daily swing trade (3-7 trading days typical duration) ⏰
🎯 Conviction Level: MEDIUM-HIGH (Technical confluence + demand zone + economic setup) 📈
🟢 PROBABILITY EDGE SUMMARY
This setup combines multiple confluence factors for higher probability:
📊 Technical Setup - EMA pullback + demand zone confirmation
🏗️ Structural Setup - Triangular pattern + base formation
😊 Sentiment Setup - Oversold conditions creating bounce opportunity
📈 Fundamental Setup - Rate expectations + economic data supporting
Estimated Win Rate: 55-60% (Based on confluence factors, not guaranteed) 📈
Risk/Reward Ratio: Minimum 1:2.0 target recommendation 💰
Best Trading Sessions: New York + London overlap (9am-12pm EST) ⏰
💬 FINAL THOUGHTS FOR TRADERS
Dear Ladies & Gentleman (Thief OG's) 🎩 - This is a carefully crafted setup based on real market data and technical confluence. However, markets are always unpredictable. Your discipline in following your trading plan matters MORE than being right 100% of the time.
Trade responsibly. Manage your risk. Take your profits. Protect your capital. 💪
The best traders aren't the ones who win every trade - they're the ones who survive and profit over time through disciplined risk management and emotional control. 🎯
Good luck traders! May your profits flow like the currency you're trading! 📈💰
Remember: Your broker, your rules. Your strategy, your risk. Adjust all levels to match YOUR trading plan perfectly. ✅

DXY Looks BullishDXY Looks Bullish
DXY looks bullish so all risky assets will take correction in coming days/weeks IMO.

US Dollar Index (DXY): Outlook for 2025–2026US Dollar Index (DXY): Outlook for 2025–2026
The year 2025 delivered significant volatility spikes for the US Dollar Index (DXY).
A prime example is the April shock linked to the so-called “Liberation Day tariffs”, which marked the most powerful blow to the US dollar on an annual basis. The introduction by Trump of new aggressive tariffs (including a universal 10% tariff) was perceived by the market not as protectionism, but as a threat of a global trade war and economic isolation. As a result, DXY plunged by approximately 2% in a single day and continued to decline over the following months.
Equally important was the shift in the Federal Reserve’s policy stance and the launch of an interest rate cutting cycle. During the first half of 2025, the policy rate was held at 4.5%, but starting in September it was reduced three times, reaching 3.75%.
What Could Happen to DXY in 2026?
In May, the Federal Reserve is likely to appoint a new Chair who would be more aligned with Trump’s preference for accommodative monetary policy. As a result, market participants are pricing in further rate cuts towards approximately 3.00%, while the European Central Bank and the Bank of England may act more cautiously. This divergence in central bank policies is unfavourable for the US dollar.
Analysts at Morgan Stanley, ING and MUFG are expressing bearish forecasts for 2026. In their view, the 2025 low is likely to be broken.
In the final days of 2025, the US Dollar Index (DXY) continues to trend lower (marked in red), with the following technical signals in focus:
→ attempts to break above the August high resemble two bull traps;
→ in December, the 98.78 level shifted from support to resistance.
Taking the above into account, we could assume that the current descending channel will remain a key guiding structure at the beginning of 2026.
This article represents the opinion of the Companies operating under the FXOpen brand only. It is not to be construed as an offer, solicitation, or recommendation with respect to products and services provided by the Companies operating under the FXOpen brand, nor is it to be considered financial advice.

DXYU.S Dollar Index
- Bearish Channel as an corrective pattern in Short Time Frame
- Break of Structure
- RSI - Divergence
- Completed " 123 " Impulsive Waves
- Demand Zone

DXY Bullish Continuation Inside Ascending ChannelThe U.S. Dollar Index is trading within a clear ascending channel showing a sustained bullish structure after forming a strong low near 97.87. Price respected the lower trendline and printed multiple CHoCH and BOS signals confirming a shift from bearish to bullish momentum. Currently DXY is consolidating around 98.62–98.65 holding above the key 0.382–0.5 Fibonacci retracement zone which acts as a strong demand area.
The recent pullback looks corrective targeting liquidity before continuation. As long as price holds above 98.20–98.30 the bias remains bullish with upside targets toward the weak high near 99.00–99.20 aligned with the -0.382 and -0.618 Fibonacci levels. A clean breakout above this zone could accelerate further upside while a breakdown below channel support would weaken the bullish outlook.
Note
Please risk management in trading is a Key so use your money accordingly. If you like the idea then please like and boost. Thank you and Good Luck!

DXY at a Turning PointThe U.S. Dollar Index is showing signs of near-term stabilisation after an extended move, with price beginning to structure itself more constructively on the 4H timeframe. Momentum is gradually shifting, suggesting the market is reassessing dollar strength as traders position ahead of upcoming macro catalysts. While volatility remains part of the landscape, the current behaviour highlights a potential phase of recalibration rather than continuation in a straight line.
Disclosure: We are part of Trade Nation's Influencer program and receive a monthly fee for using their TradingView charts in our analysis.

DXY Trade Set Up Dec 17 2025Price has pushed higher and is now testing a 4h FVG which i will expect a continuation higher into BSL and daily FVG before a reversal back down


MY OUTLOOK ON DXY 2025 We are range-bound in 2025. Caught some of the swings, looking for further downside to make a triple bottom. Don't know what 2026 holds, but I'm in serious anticipation of a trend reversal.

The US Dollar Index (DXY) Rebounds from a Two-Month LowThe US Dollar Index (DXY) Rebounds from a Two-Month Low
A week ago, we:
→ updated a system of two trend channels;
→ identified signs of selling pressure dominance;
→ outlined a scenario in which price could slide towards the lower boundary of the blue channel, potentially acting as key support.
As the arrow on the chart shows, this scenario largely played out:
→ The US dollar index fell to a two-month low yesterday. The decline was driven by economic news, including weak US housing data. Both housing starts and building permits came in below expectations, reinforcing the view that the US economy is losing momentum.
→ Today, the DXY is rebounding sharply amid sterling weakness, after UK consumer price index (CPI) data revealed a sharp slowdown in inflation to 3.2%, versus a 3.5% forecast.
From a technical perspective, the price action points to a fairly aggressive bullish reversal from the lower boundary of the ascending channel. In particular:
→ the brief dip below the key October low appears to be a bear trap, showing characteristics of a Liquidity Grab in Smart Money Concept terminology;
→ several indicators (including the RSI) are likely to display signs of bullish divergence between lows A and B.
Taking all of the above into account, there are grounds to suggest that the US dollar may regain attractiveness towards year-end. It cannot be ruled out that the DXY will recover towards the median of the red channel and potentially move on to test its upper boundary.
This article represents the opinion of the Companies operating under the FXOpen brand only. It is not to be construed as an offer, solicitation, or recommendation with respect to products and services provided by the Companies operating under the FXOpen brand, nor is it to be considered financial advice.

DXY Trade Set Up Dec 16 2025Price has swept SSL and has low range liquidity above which i will expect to be swept before a continuation lower

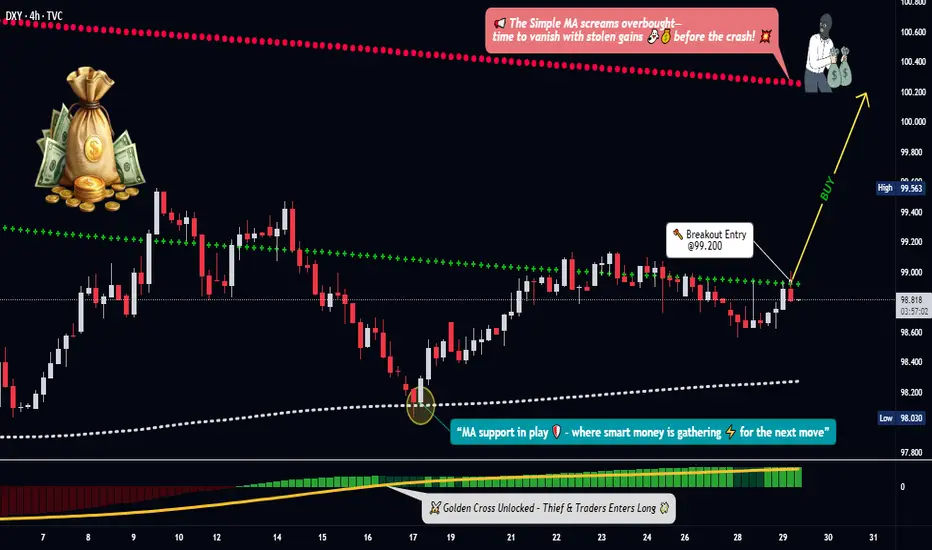
DXY Breakout Map — Is the Dollar Index Ready for a Power Move?🎯 DXY BULLISH BREAKOUT: The "Limit Order Layup" Strategy 🚀
Hey Thief OGs! 👋 The King Dollar 👑 is getting ready for a potential rally, and we've got the map 🗺️ to navigate it. This is a swing/day trade plan focusing on a classic technical setup with a tactical entry twist.
📈 The Overall Plan (Bias): BULLISH 🐂
The strategy waits for a bullish confirmation using a Simple Moving Average (SMA) pullback 🔙 followed by a MACD golden cross ✨. We're buying the dip, expecting a continuation upward 📊.
⚡ The Thief's Entry Tactic (The "Layering Method") 🎁
The key is patience and precision. We don't chase the price.
✅ Wait for the Trigger: Confirm a daily close ABOVE 99.200.
🎯 Deploy Limit Orders: After the breakout, set multiple buy limit orders at key support levels to get a good average entry price.
Suggested Layers: 🟢 98.400, 🟢 98.600, 🟢 98.800, 🟢 99.000
💡 Pro Tip: You can adjust the number of layers and levels based on your own risk appetite!
🛡️ Risk Management (The Escape Plan) 🚨
Stop Loss (SL): A hard stop is placed at 98.200. This level is the line in the sand – if price breaks below here, our thesis is likely invalid ❌.
⚠️ Note: Dear Ladies & Gentleman (Thief OGs), I do not recommend you set only my SL. It is your own choice. You can make money, then take money at your own risk.
🎯 Profit Targets (The Getaway) 💰
Take Profit (TP): We are targeting 100.200. This zone aligns with where the Moving Average may act as strong resistance, and the market could become overbought. When the trap is set, we escape with profits! 🏃♂️💨
⚠️ Note: Dear Ladies & Gentleman (Thief OGs), I am not recommending you set only my TP. It is your own choice. You can make money, then take money at your own risk.
🔍 Related Pairs to Watch & Key Correlations 🌐
The DXY doesn't move in a vacuum. Keep an eye on these:
EUR/USD ( FX:EURUSD ): 👑 The inverse king. A rising DXY typically means a falling EUR/USD 📉.
GBP/USD ( FX:GBPUSD ): Similar to the Euro, a strong dollar often pressures Cable downward 📉.
Gold ( OANDA:XAUUSD ): 🪙 Gold is priced in USD. A stronger dollar can make gold more expensive for other currencies, often putting downward pressure on it 📉.
USD/JPY ( FX:USDJPY ): A strong dollar trend usually powers USD/JPY higher 📈.
Key Point: If our DXY bullish idea is correct, you should generally see EUR/USD and GBP/USD weakening 📉, and USD/JPY strengthening 📈.
✨ “If you find value in my analysis, a 👍 and 🚀 boost is much appreciated — it helps me share more setups with the community!”
#DXY #TradingSetup #SwingTrading #Forex #DollarIndex #TradingStrategy #MACD #TechnicalAnalysis #LimitOrder
DXY: Is the Market Preparing the Next Dollar Move?The U.S. Dollar Index continues to trade within a corrective structure, showing signs of short-term exhaustion after the recent downside move. Momentum has slowed, and price action suggests the market may be transitioning into a rebalancing phase before the next directional decision.
This type of behavior often reflects positioning adjustments rather than trend continuation, making the coming sessions critical for confirmation. A brief recovery followed by renewed pressure would remain consistent with the broader corrective outlook, while failure to stabilize could accelerate volatility across FX, indices, and risk assets.
**Disclosure:** We are part of Trade Nation's Influencer program and receive a monthly fee for using their TradingView charts in our analysis.
