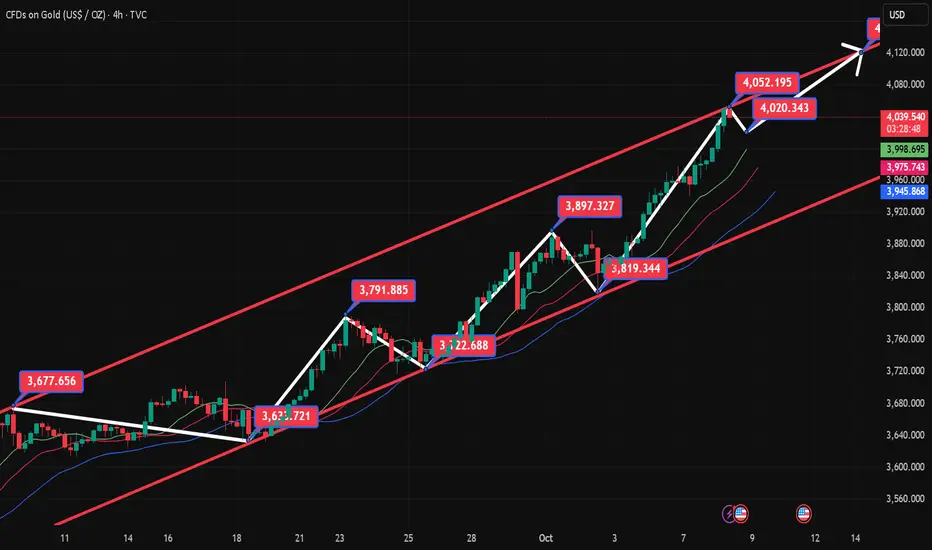
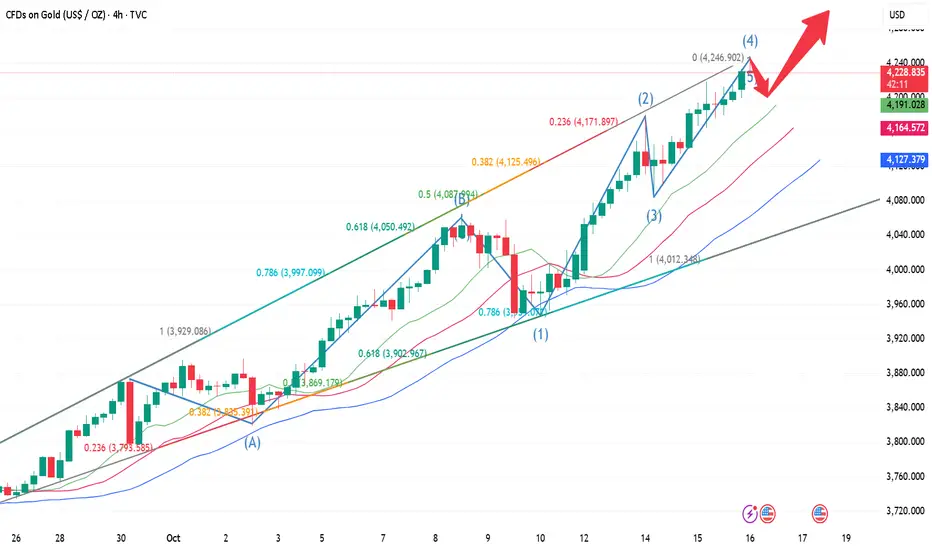
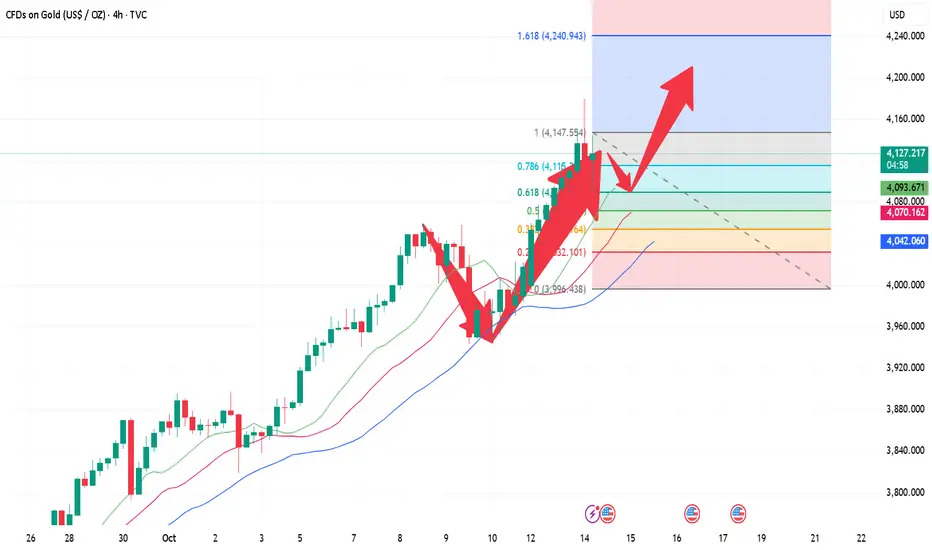
10.19 Gold Monday short-term analysis guide!Gold closed near 4247 on Friday. Following five consecutive daily gains, the market closed with a bearish candlestick pattern. Technical analysis suggests that gold prices are poised for a period of volatile correction. Without news stimulus, gold is expected to fluctuate within a range. Given the pullback from Friday's large bearish candlestick, Monday's focus should be on whether the decline can be sustained. If this trend isn't sustained, bulls are poised to launch a counterattack. Otherwise, gold is poised to enter a range of rebound resistance.
From the 4-hour market trend, short-term resistance is currently at 4280-4293, with a focus on 4315-23. Support is at 4185-4193. If bulls fail to achieve a sustained breakout, a period of volatile correction is imminent. Trading strategies should prioritize range-bound trading. In the middle, adopt a cautious approach, cautiously follow orders, and patiently wait for key entry points.
Dxyanalysis

10.17 Gold Short-Term Operation Technical Guide!!!Recently, as the expectation of the Federal Reserve's interest rate cut has become more and more intense, and there is an expectation of an increase, the loose atmosphere, coupled with the expectation of inflation and the impact of the economic and trade turmoil, gold has once again become the darling of the market. Every day, it witnesses new highs in history, and the trend has become more and more crazy. There is no top in sight, and it is also impossible to say when a dive will come. Today, the Asian session hit a high near 4378 and then fell back quickly to touch around 4278, a range of US$100, and then quickly rebounded to above 4370 again. Subsequently, the European session jumped back and forth. Today, Friday, we need to be wary of the possible profit-taking trend in the market. In terms of operation, the rebound depends on shorting at 4360/70, and pay attention to the gains and losses of 4300. If it falls below 4300, we will see adjustments. Otherwise, we will continue to see bullish fluctuations if it falls back.
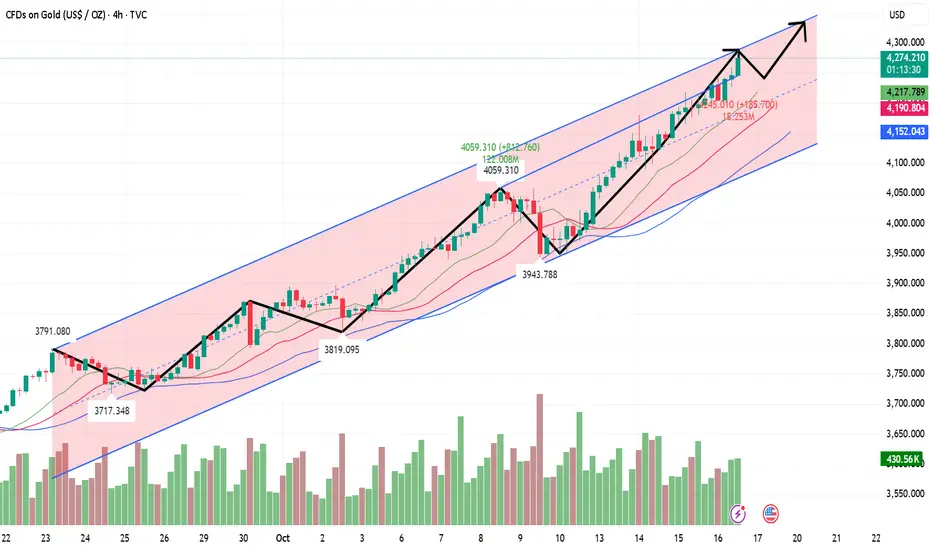
10.17 Gold bulls rose sharply and are about to enter the 4400 erLooking at the 4-hour market trend, the short-term support at 4290-4300 is currently under consideration, with a focus on 4270. The bulls are rising strongly and there is no end in sight. Trading strategies should focus on buying on pullbacks. For intermediate positions, be cautious in following orders and patiently wait for key entry points. I will provide detailed trading strategies during the trading session, so please pay attention.

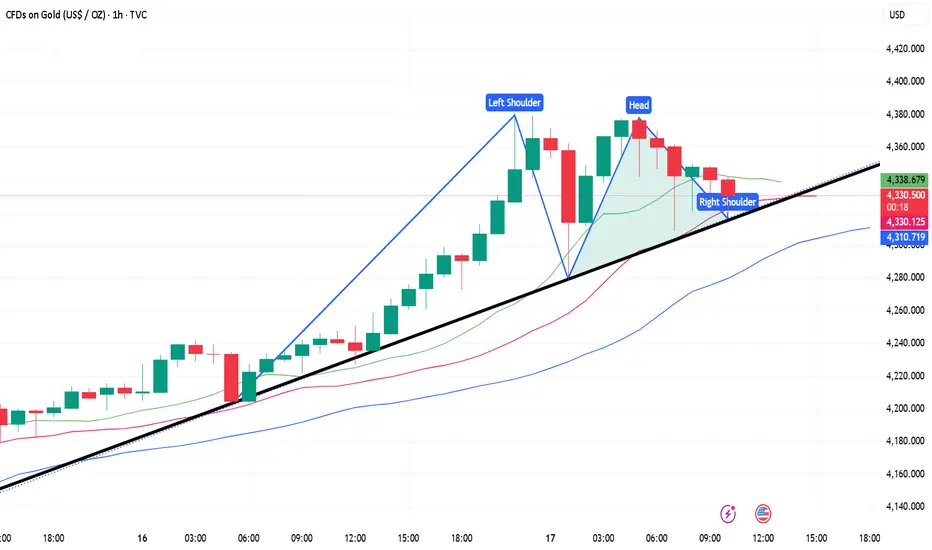
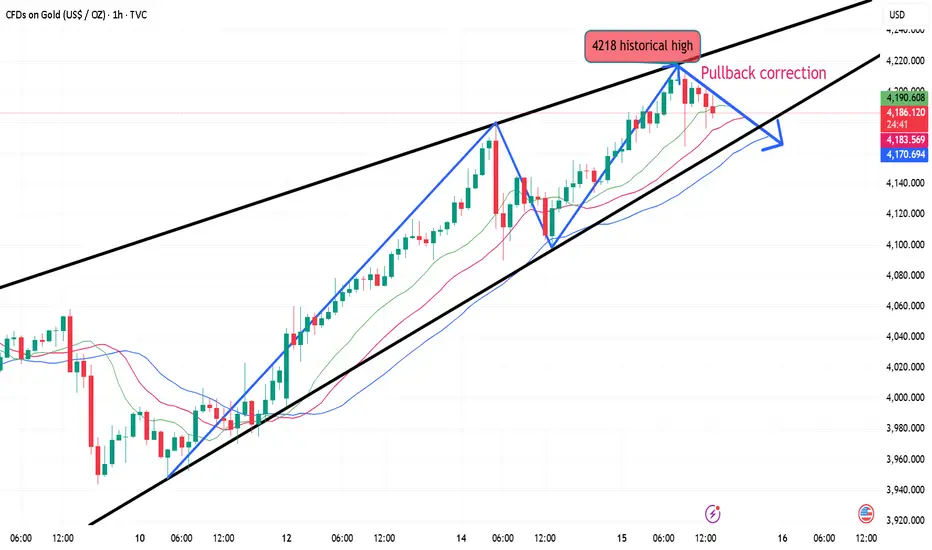
The Golden Triangle is coming to an end, beware of profit takingGold Hourly Chart: The overnight close was relatively high, and today's Asian session continued its upward trend. The European session saw a sharp drop below the upper channel line at 4242. This trend resistance line is the same one that held pressure at 4218 in yesterday's European session. The market then closed with a large, plump, bearish candlestick pattern at 2:00 PM, reaching the target of 4210. Since it was a large bearish candlestick pattern, not a long lower shadow candlestick pattern, a rebound confirming the 5-day moving average at 4230-34 is sufficient, so a further downward push is warranted.
The European session saw consecutive positive days, testing the bottom and rallying to a new all-time high. However, caution is advised in the US session. On the one hand, the 4250 level is a resistance point in the channel, and on the other hand, it is nearing the end of an ascending converging triangle, leaving little room for further movement and a potential reversal. Therefore, support remains at the middle line at 4230. Only a significant break below this level would trigger a potential for a significant short-term correction. Resistance is at 4265. Be cautious about blindly chasing rallies below this level. Consider the gains and losses at both levels and wait for signals.
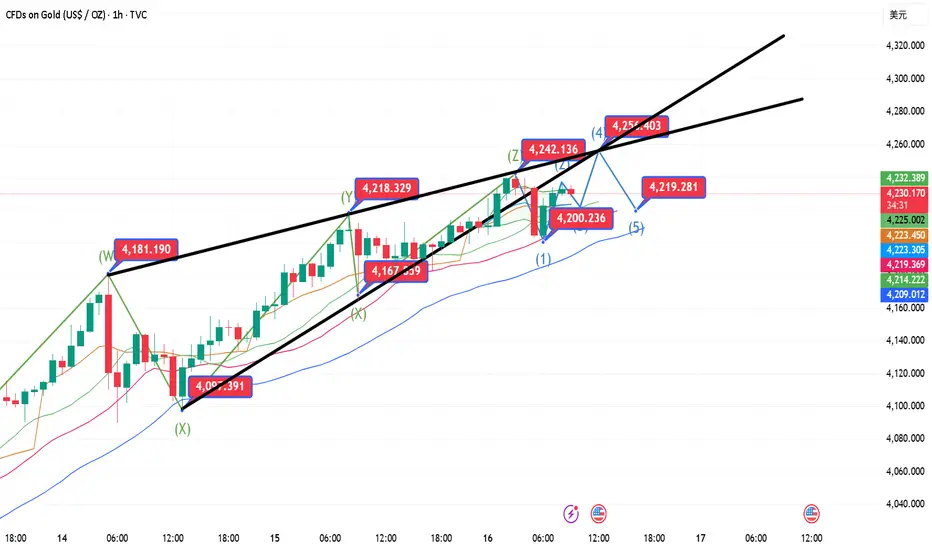
10.16 Gold Short-Term Operation Guide!!!Three key points to watch today:
1. Position. Today's target is the 4200 area (previously, it started at 4000, then 4090, and yesterday was 4140).
The 4200 mark is today's early trading low. Using this as a dividing line, we're looking to sweep the $40 range above and below. A breakout will open up further opportunities.
2. Channel. The lower band of the channel overlaps with yesterday's low at 4140, while the upper band currently overlaps at 4220-4225.
Today's Asian session saw continued gains, breaking through the small channel range and extending gains by approximately $20 to 4242. However, after the breakout, the price fell back to 4203, retesting the previous high. If the market falls back into the channel, the support and resistance levels will shift again to the 4220-4225 area.
If it successfully holds above the support level, look for the 4200 area. If it breaks below, look for the 4180 and 4165 areas, with the 4145-4140 area exceeding the range.
Similarly, if it breaks above 4240, and the profit margin is halved according to the principle of equal distance, the next resistance level will be the 4270-4290 area.
3. Although the current result is an upward trend, the process has been characterized by significant ups and downs, with each initial move ranging from approximately $60 to $80.
So, regardless of whether you are long or short, regardless of the direction, at this moment, timing is more important than direction. Once confirmed, To determine a trigger, the first consideration is at least $60-80. Within this range, stick to one direction. If it's right, reap the rewards; if it's wrong, exit. Regardless of whether you're long or short, don't dwell on it.
The current market trend is extremely chaotic. In this chaotic situation, perseverance is more important than choice.
In summary, for gold today, Thursday, focus on the 4200 mark as a spatial boundary. From this boundary, we can see a range of $40 above and below.
Two key resistance levels: the upper limit of the 4220-4225 channel and the equally spaced upper limit of the profit margin at 4240-4242.
Using these two levels as resistance, we can see downward pressure on the price, looking for the 4200 area.
If it falls below 4200, Two key support levels are moving downward:
First, 4180, a support point that was repeatedly consolidated in the US market last night. Second, 4165-4160, the bottom of yesterday's sharp drop in the European market.
Of course, if the price does fall to the second support level, it will be easy to find the lower limit of the small channel at 4140, which is also yesterday's low.
Based on this idea, the European market price met expectations. Under pressure from 4242, a decline to 4203 helped to profit from the short position. The rebound continued, but the price slightly exceeded the range.
If the price exceeds the range, then the second confirmed high of 4242-4245 area is still a short position, with a stop loss at 4253 and a target of 4220-4200. If it falls below, look for 4180 and 4165.
10.16 Gold maintains the upward trend in the Asian session!!!From a multi-period analysis perspective, first observe the monthly chart's rhythm. From a long-term perspective, 3130 represents a watershed in the long-term trend. Above this level, consider a long-term bullish approach. From a weekly perspective, the current bull-bear watershed is 3585. Above this level, consider a medium-term bullish approach. From a daily perspective, focus on the 3997 support area for now. Above this level, consider a short-term bullish approach. From a four-hour perspective, which we've consistently emphasized, support currently lies at 4175. Above this level, consider a short-term bullish approach. On an hourly basis, prices are also currently bullish, but short-term divergence is occurring. Therefore, be mindful of short-term bullish risks in the event of further upward movement. Meanwhile, today's early trading session saw another surge in gains, with the early morning low serving as a watershed for the day. Above this level, consider a short-term bullish approach. Focus on the 4235-4266 area as an upward move.
Gold's Asian session low of 4199.73 marks the intraday watershed. Above this level, bullish momentum is expected to continue. (Also, a divergence is occurring in the hourly chart, so be aware of the risks associated with a short-term rally.)
10.15 Gold continues to rise, beware of a pullbackGold 4-hour chart level: Asian session directly pulled up strongly. The overnight closing itself was not at a relatively high level, and it was still 40 meters away from the previous high. After a short squeeze and strong pull, it did not stop until the European session reached the upper track of the yellow channel 4218 in the figure, and then there was a sharp drop, with the lowest point at 4165. The high point of this wave of suppression was predicted in place (4215 was prompted in advance to pay attention to the resistance pressure), but the low of 4165 was only touched for a few seconds, so only 4180-4190 can be chosen; Judging from the current trend, the US session tends to see a strong consolidation at a high level. The resistance is still the derivative of the upper track of the yellow channel, which will move up to 4220-25. The support is the middle track 4170, which is also the retracement point of the previous red channel line; after approaching both sides, we will look for pressure or support signals to try to make a shock;
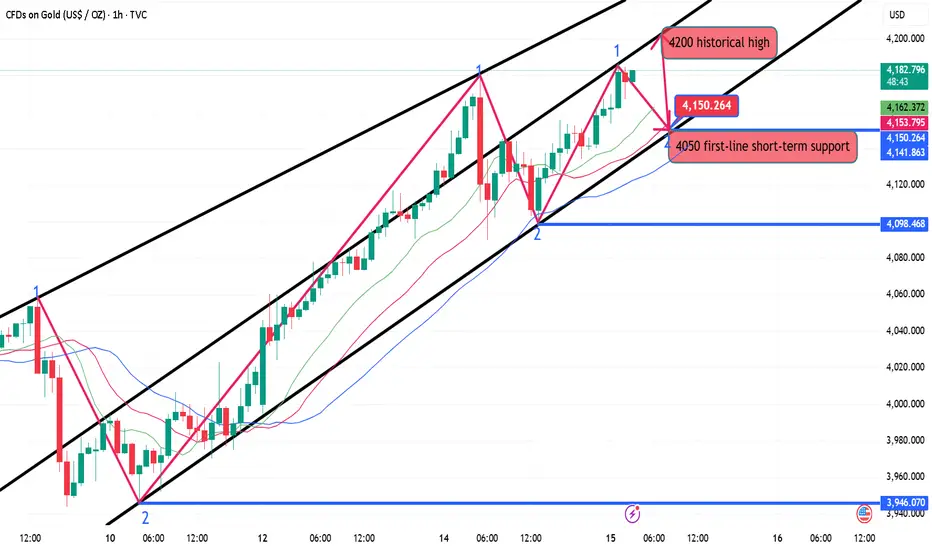
10.15 Gold breaks high again, looking for retracement to continuAfter a significant bearish candlestick pattern, the gold price's hourly chart immediately took off with a bullish candlestick pattern in the Asian session, signaling a rebound from a bottoming out. The large bullish candlestick pattern at the bottom solidified the base, and the moving average took off again, also trending almost vertically upward. The candlestick pattern remained above the moving average throughout, demonstrating the unstoppable bullish momentum. The upper limit remains at 4200.
Intraday short-term trading strategy:
BUY: 4150 Stop-loss: 4142
Top 1: 4185
Top 2: 4200
10.14Gold bulls continue to exert their strength!!!Gold is currently stabilizing after a broad range-bound consolidation on the 4-hour chart. It experienced an unexpected intraday plunge, but the momentum has been minimal. A rapid intraday rise followed by a sustained decline could present an opportunity for a short position. The price has rebounded after retracing to previous support levels, and the K-line charts are still trading above the short-term moving average, suggesting a relatively strong trend in the short term. There are currently no significant technical patterns on the hourly chart. On the smaller timeframes, pressure is building on the short-term moving average, maintaining a weak trend. There may be some room for correction in the short term. Focus on the support level around 4005 in the short term.
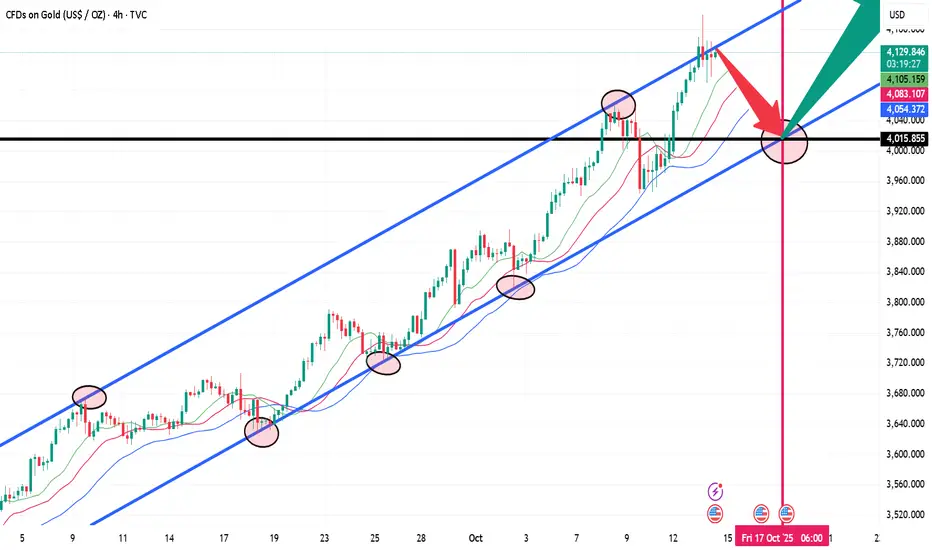
10.14 Tariffs and interest rate cut expectations resonate!Judging from the current 4-hour chart:
4100 is essentially the current hurdle for gold.
It's also the most important support level today.
Gold opened today in the 4100-4110 range. Although it recently retreated to around 4090, the real-world price still closed above 4110.
If we analyze the trend from last week's low of 3950 to the current 4180 level, we can see that the 618 support level is precisely around 4090.
4090 also happens to be the low point of the recent retracement.
According to wave theory, if the retracement does not exceed 618, new highs are inevitable. If it breaks through 4180 again, the next target may be around 4230.
DXY index Near Resistance – Will Powell Trigger the Next Move?To kick off this week, let's take a quick look at the upcoming key indexes in the economic calendar before diving into the DXY analysis ( TVC:DXY ).
On Tuesday, we have Fed Chair Powell speaking, which could stir some excitement in the DXY index and ripple through correlated financial markets . Then, on Thursday , we have a bunch of key indexes like Core PPI, Core Retail Sales, PPI, and Unemployment Claims coming out. These releases could spark some volatility as well.
So, before we jump into the DXY analysis , I wanted to give you a heads-up on this week’s events
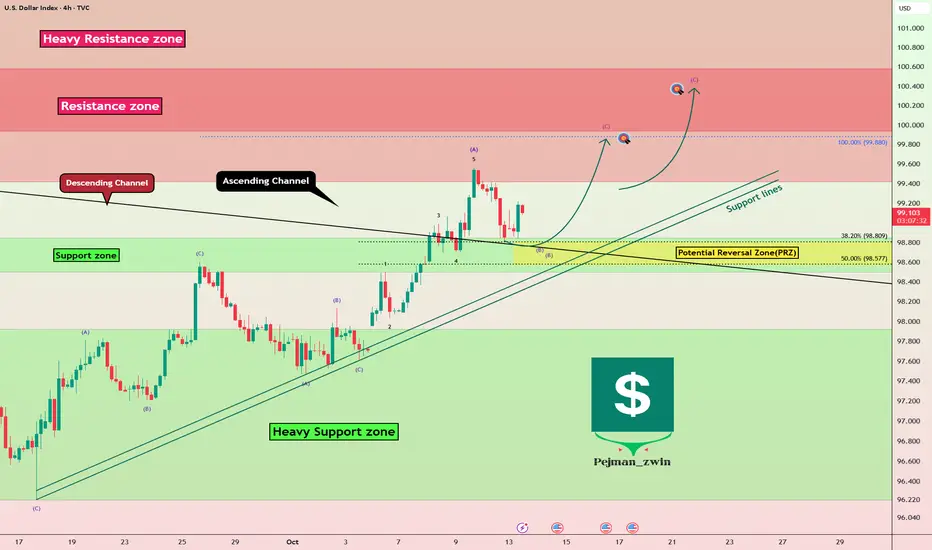
From a technical analysis standpoint , the DXY index is currently moving near a Heavy Resistance zone($101.30-$99.42) . At the same time, it has managed to break above the upper line of its descending channel and is now in a pullback phase to retest that broken line.
In terms of Elliott Wave theory , it seems that the DXY is completing wave B of a zigzag corrective(ABC/5-3-5) .
I expect that wave B will finish around the Potential Reversal Zone(PRZ) , and we might see the DXY index approach that Resistance zone($100.58-$99.93) before Powell’s speech tomorrow .
First Target: $99.770
Second Target: $100.06
Stop Loss(SL): $98.28
Please respect each other's ideas and express them politely if you agree or disagree.
U.S. Dollar Index Analysis (DXYUSD), 4-Hour Time Frame.
Be sure to follow the updated ideas.
Do not forget to put a Stop loss for your positions (For every position you want to open).
Please follow your strategy and updates; this is just my Idea, and I will gladly see your ideas in this post.
Please do not forget the ✅' like '✅ button 🙏😊 & Share it with your friends; thanks, and Trade safe.
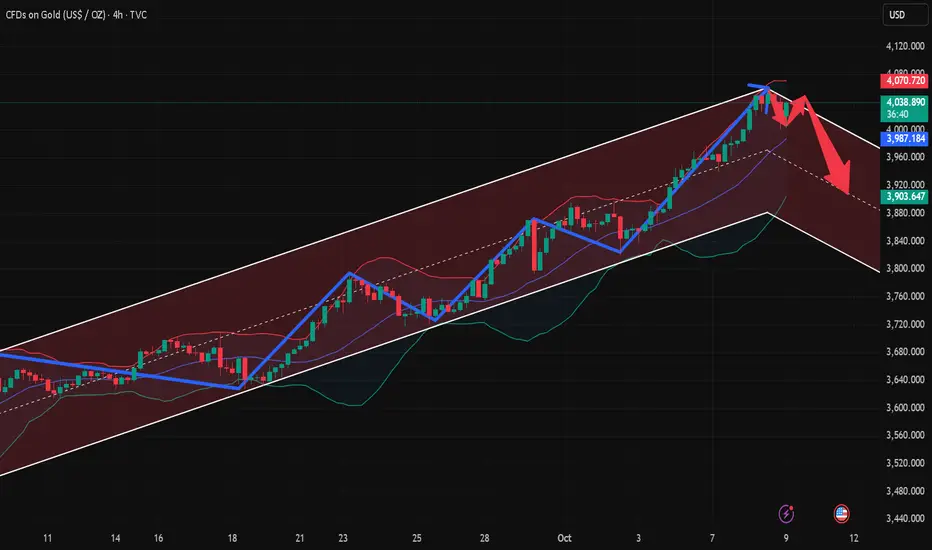
Gold breaks out to new all-time high!!!After breaking through the previous resistance band on the 4-hour chart, gold's candlestick chart continues to maintain a strong upward trend along the short-term moving average. There are still no signs of a peak in the short term, so focus on the support band around 4080. Currently, a purely technical correction in gold is unlikely to lead to a significant decline. The most likely scenario is a sudden sell-off or a rapid surge and then a decline to release bullish pressure, which may lead to some decent short-selling opportunities. On the hourly chart, the candlestick chart maintains a slight upward trend along the short-term moving average. Intraday pullbacks do not provide much room for improvement. Watch for short-term corrections in the closing market. Consider long positions around 3080-1.
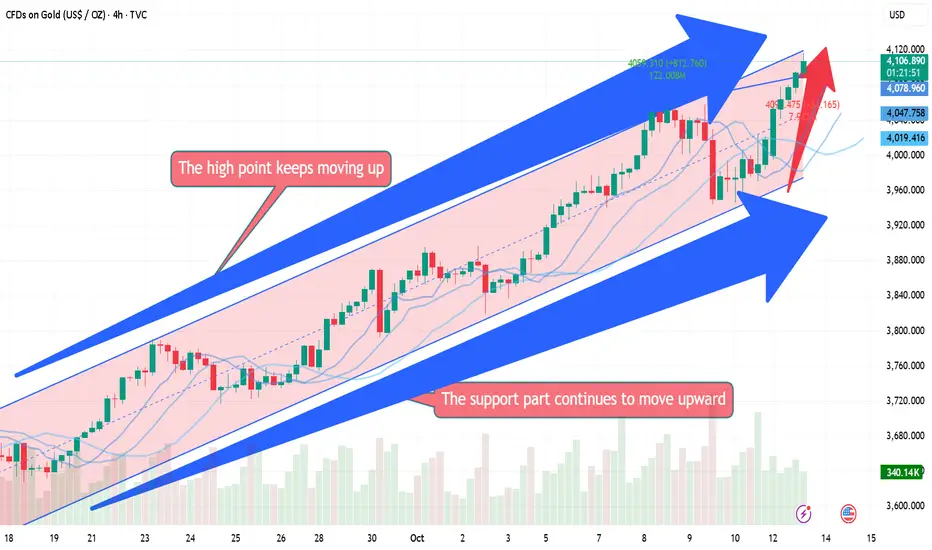
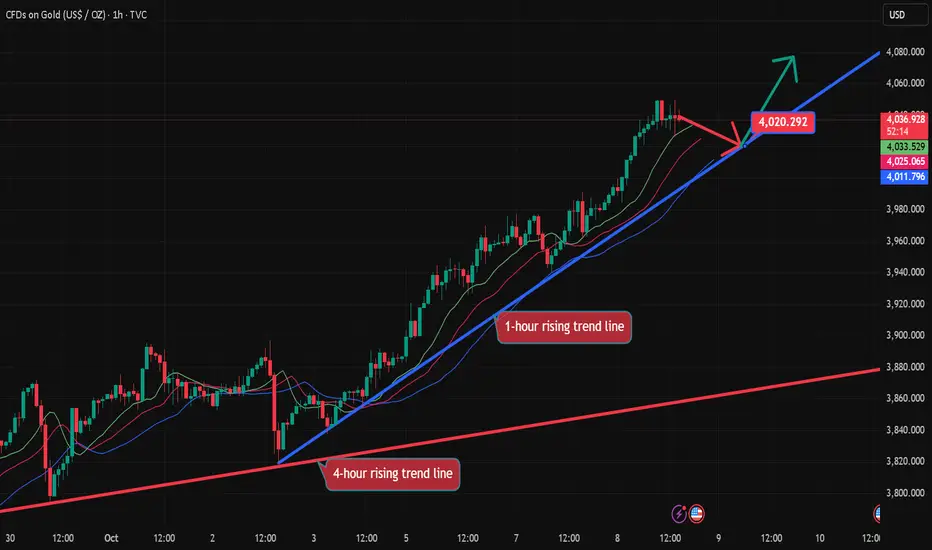
Monday's US gold market focus on short-term adjustmentsOn Friday, we emphasized the importance of the daily close. Gold's late-day rally on Friday disrupted the previous downward trend following the engulfing high. Instead, it continues to fluctuate along its short-term moving average, maintaining a relatively strong trend on the daily chart. On the 4-hour chart, gold has broken through the previous resistance band, and the K-line continues to maintain a relatively stable upward trend along the short-term moving average. In the short term, watch for a second upward pull after a pullback. On the hourly chart, after a series of small upward movements, the price is currently fluctuating in a narrow range at a high level. The current divergence in the short-term chart suggests that there may be room for adjustment in the short term. Keep an eye on this short-term correction.

DXYU.S Dollar Index
- Bullish Channel as an corrective pattern in Short Time Frame
- Break of Structure
- Completed " 12345 " Impulsive Waves and " A " Corrective Waves
- RSI - Divergence
- Order Block

DXYDXY has given us push up last week, now it needs correction or impulse down.
Disclosure: We are part of Trade Nation's Influencer program and receive a monthly fee for using their TradingView charts in our analysis.

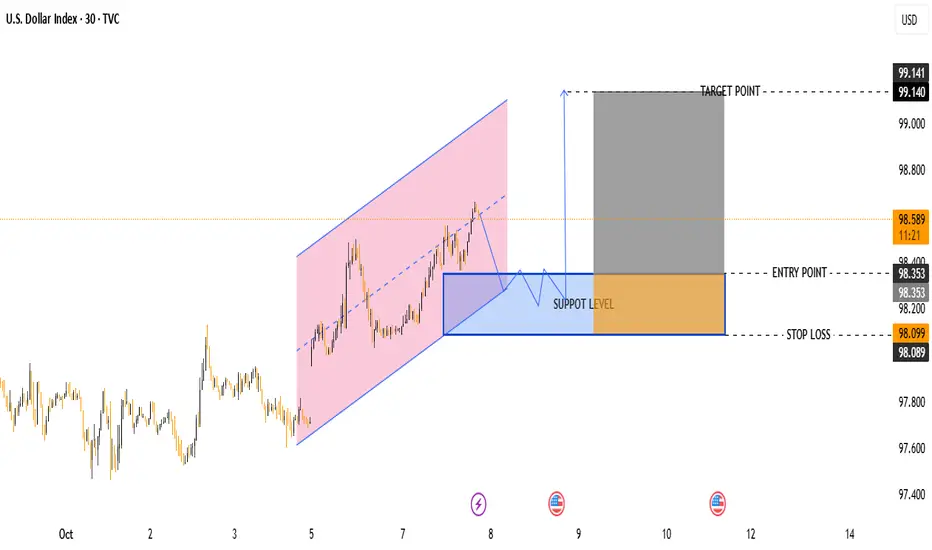
DXY Buy Opportunity – Support Retest Before Next Leg UpPair: U.S. Dollar Index (DXY)
Timeframe: 30 minutes
Current Price: 98.602
Trend: Short-term bullish channel (highlighted in pink)
🧭 Key Levels
Support Zone: 98.100 – 98.350
Entry Point: 98.353 (buy zone confirmation)
Stop Loss: 98.099 (below support)
Target Point: 99.140
📊 Market Structure
The price is moving within an ascending channel, showing a steady uptrend.
It has recently reached the upper boundary of the channel and is now expected to retrace toward the support zone (blue box).
After retesting this support level, a bullish continuation is expected.
🧩 Trade Idea
Plan: Wait for price to retest the blue support area.
If bullish candlestick confirmation appears (e.g., bullish engulfing, hammer), enter a buy trade near 98.350.
Stop Loss: below 98.099 (safe margin under support).
Take Profit: near 99.140, aligning with the top of the projected move.
Risk–Reward Ratio:
Approx. 1:3.5 — good reward compared to risk.
⚠ Possible Scenarios
1. ✅ Bullish Scenario:
Price respects the support level → breaks above 98.80 → continues to 99.14.
→ Confirms continuation of bullish trend.
2. ❌ Bearish Scenario:
Price breaks below 98.10 → invalidates bullish setup → channel structure fails → potential drop toward 97.80 zone.
📈 Conclusion
Current trend: Bullish, but waiting for a retracement and confirmation is key.
Buy zone: 98.35–98.10
Target: 99.14
Stop Loss: 98.09
10.10 Gold pullback continues to be bullish!!!Looking at the 4-hour market trend, watch for the important support level at 3957-3960. The bulls are rising strongly and there's no end in sight. Trading strategies should prioritize buying on dips. In the middle, be cautious and watchful when buying.
Gold Trading Strategies:
1. Go long on gold at 3957-3960, with a stop loss at 3948 and a target of 4015-4020. Hold if it breaks through!
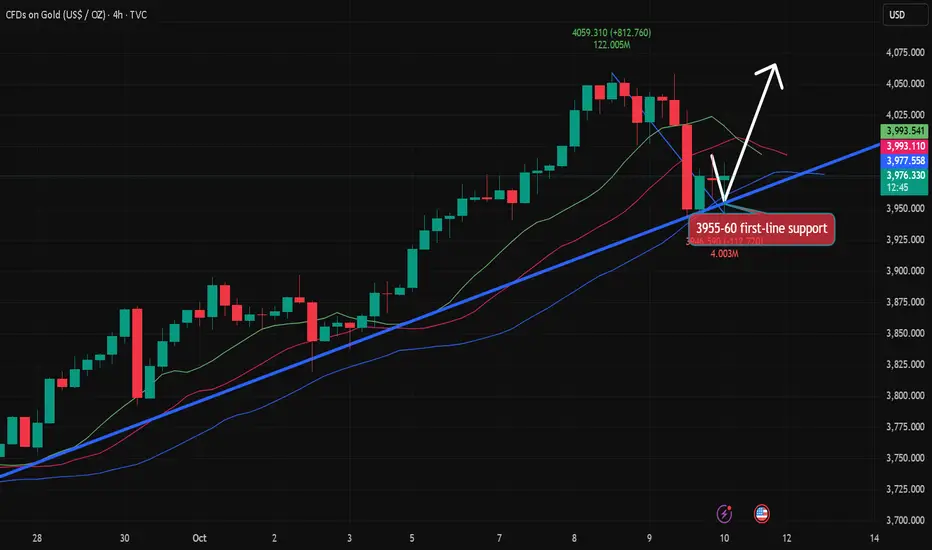
10.9 Gold US Market Operation Guide!!!Looking at the 4-hour market trend, watch for the important support level of 3990-4000 below, and the bull-bear watershed of 3980-85. The bull market is rising strongly and there is no end in sight. Trading strategies should focus on buying on pullbacks. In the middle, be cautious about following orders.
Gold Trading Strategies:
1. Buy gold at 4000-4010, and add to long positions if it retraces to 3985-3993. Set a stop loss at 3977 and target 4045-4050.
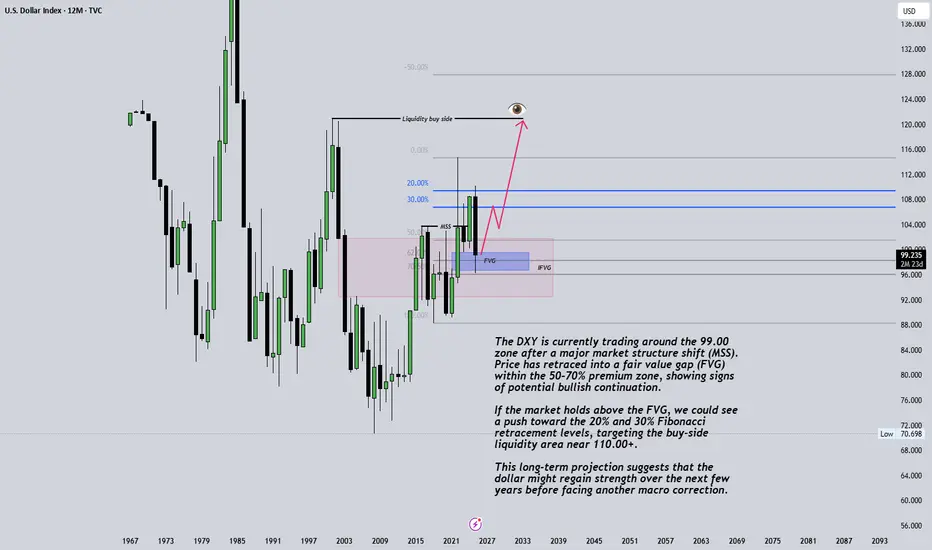
US Dollar Index (DXY) Monthly OutlookThe DXY is currently trading around the 99.00 zone after a major market structure shift (MSS). Price has retraced into a fair value gap (FVG) within the 50–70% premium zone, showing signs of potential bullish continuation.
If the market holds above the FVG, we could see a push toward the 20% and 30% Fibonacci retracement levels, targeting the buy-side liquidity area near 110.00+.
This long-term projection suggests that the dollar might regain strength over the next few years before facing another macro correction.
📅 Timeframe: Monthly
💡 Bias: Bullish towards liquidity highs
⚠️ Disclaimer: This analysis is for educational purposes only and does not constitute financial advice.
#DXY #USDX #DollarIndex #ForexAnalysis #SmartMoneyConcepts #MarketStructure #FVG #Liquidity #Herotraderfx #TradingView
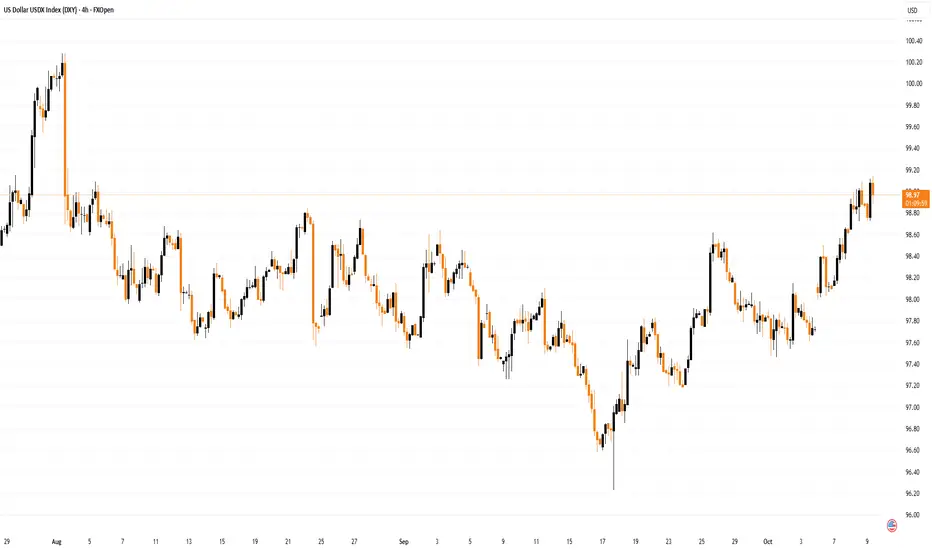
Dollar Index (DXY) Rises to Highest Level in Over Two MonthsDollar Index (DXY) Rises to Highest Level in Over Two Months
The chart shows the Dollar Index (DXY) trading above the 99-point level today — its highest since early August. The dollar’s strength is supported by the weakening of other currencies:
→ The yen is weakening amid expectations of looser monetary policy. Conservative Sanae Takaichi could become the first female prime minister in Japan’s history, pursuing substantial spending and economic stimulus.
→ The euro remains under pressure amid France’s political crisis. Following the resignation of Prime Minister Sébastien Lecornu’s government, President Emmanuel Macron stated he plans to appoint a new prime minister this week.
Will the Dollar Index continue to rise?
Technical Analysis of the DXY Chart
On 19 September, we provided a significant analysis of the DXY chart in which we:
→ Confirmed the relevance of a descending channel (shown in red), which includes intermediate QL and QH lines dividing the channel into quarters.
→ Highlighted a reversal upward from the QL line (shown with an arrow).
→ Suggested a bullish scenario aiming to reach the QH line.
This scenario has indeed unfolded:
→ On 25 September and 6 October (as shown by arrows), the QH line acted as resistance.
→ On 7 October, it was broken upward, underlining bulls’ strength.
Given this, it is reasonable to suggest that bulls remain in control, while:
→ DXY fluctuations since mid-September’s low are forming an upward channel;
→ its upper boundary may act as resistance, potentially triggering a pullback towards the Support line;
→ the upper boundary of the red channel appears to be a key target for the current rally that began last month.
This article represents the opinion of the Companies operating under the FXOpen brand only. It is not to be construed as an offer, solicitation, or recommendation with respect to products and services provided by the Companies operating under the FXOpen brand, nor is it to be considered financial advice.
10.9 Gold Short-term Intraday Operation Guide!!!Technical Analysis:
The 4-hour chart shows support at the middle line and near the MA30 moving average, corresponding to 3986 and 3947, respectively. The Bollinger Bands have also begun to narrow, indicating a volatile, compressed, and retest pattern in the 4-hour chart. Focus is currently on the upward pressure of 4032, near the MA5 moving average.
The 3-hour chart saw a rapid drop to 4001 this morning before bottoming out near 4008 and rebounding to 4036. The MACD formed a dead cross with high volume, and the STO indicator is trading at a low level, indicating weak 4-hour volatility. The high point of the morning rebound, the middle line of the hourly chart, has become the current resistance point at 4036. Meanwhile, support between 3999 and 4000 is a key focus today.
On the daily chart, focus on yesterday's highs and lows, 4059, and 3984. For the daily chart to rise, it must not fall below yesterday's lows but must break above yesterday's highs. However, considering the current volatile decline in the 4-hour chart, it is obvious that it will be difficult to go up in the morning session, so 4032 and 4050-59 become today's shorting points; and for the time being, we will focus on the morning low of 4001 and yesterday's low of 3984.
The US market fluctuates at a high level, and long orders fall bGold prices continued to fluctuate at high levels in the early stages of the U.S. trading session on Wednesday (October 8), with the potential for further gains. At the same time, the current price increase has already reached a large extent. Pursuing long positions at the current price is not the best opportunity. Waiting for a pullback to trade long positions at support points, with small stop-loss orders and a large expected profit range, spot gold broke through the $4,000 mark during the day, reaching a record high of $4,049.43 before retreating slightly. The current rise in gold prices is driven by strong safe-haven demand, driven by factors including the U.S. government shutdown, falling Treasury yields, and political turmoil in Europe and Japan.
10.8 Gold Daily Short-Term Operation Guide!!!In the 1-hour chart, the Asian session continues to rise with $3985 as support. A quick pullback would be an opportunity to buy in. Unless the Asian session decline continues in the European session and then in the US session, or if the Asian session breaks the bottom in the European session and fails to continue in the US session, don't try to bet on a pullback; instead, follow the trend.
Secondly, give up on speculating on the top. Currently, the strong upward trend remains unchanged on both the daily and 4-hour charts. Even after breaking through $4000 in the short term, there's still no sign of an end. While bullish, be wary of pullbacks. In other words, be prepared for a pullback and avoid chasing orders.
If the pullback approaches the $4000-3980 range, buy long. If the European session's strength doesn't offer opportunities, and there are further pullbacks before the US market opens, keep an eye on $4030-4050.