MIXED SIGNALS ON THE DOLLAR INDEXThe dollar index has beautifully retraced 100% of a bearish Butterfly pattern that was identified between July 1st and August 13th 2025, hitting the monthly support target of 95.911. There has been a strong bounce from this support zone into the weekly closing range.
What we currently have now is also a bullish Butterfly pattern on the daily chart and the bounce from the support zone has retraced to exactly the 0.382 fib level (97.336). The weekly hammer candle suggests that bulls will attempt to reach the 0.5 fib level, however lower time frames shows that the bulls are losing their strength. As such, I am not expecting DXY to continue grinding up next week without a major pullback to retest the weekly candle wicks. Basically expecting a lot of volatility in both directions.
I thank you for checking out my publication and I wish you a successful trading week. Cheers!!
Dxyanalysis

U.S. Dollar Index (DXY) – Bullish Pullback & Long Setup (2H Char1. Price Action & Structure
The chart shows a bullish channel (red shaded area) where price has been making higher highs and higher lows since around September 18.
Price recently reached the upper trendline of the channel and is now pulling back toward the middle/lower zone.
2. Key Levels
Support Zone: Around 97.575 – 97.257 (blue labels).
This is where the chart suggests a potential buy/long entry.
The gray box marks the area where price is expected to reverse to the upside.
Stop-Loss Level: Slightly below 97.257, around 97.238 (red level).
If price breaks below this, it would invalidate the bullish setup.
Target Point: 98.799 – 98.805
This is the projected move upward, shown with the big arrow.
3. Expected Scenario
The zigzag line indicates that price may dip into the support zone, consolidate, and then bounce back up strongly toward the target point.
This is a long (buy) trade setup with a favorable risk-to-reward ratio since the potential reward is much bigger than the stop loss risk.
4. Risk–Reward Ratio
Risk (downside): Around 0.3 points (from 97.575 entry to 97.238 stop).
Reward (upside): Around 1.2 points (from 97.575 entry to 98.799 target).
That’s roughly 4:1 R:R — a very good trade setup if price respects the support zone.
Summary
✅ Bullish Bias – Price is in an uptrend channel.
📉 Buy Zone: 97.575 – 97.257
📊 Target: 98.799 – 98.805
🛑 Stop Loss: Below 97.238
🎯 Expectation: Short-term dip followed by a strong bullish rally.

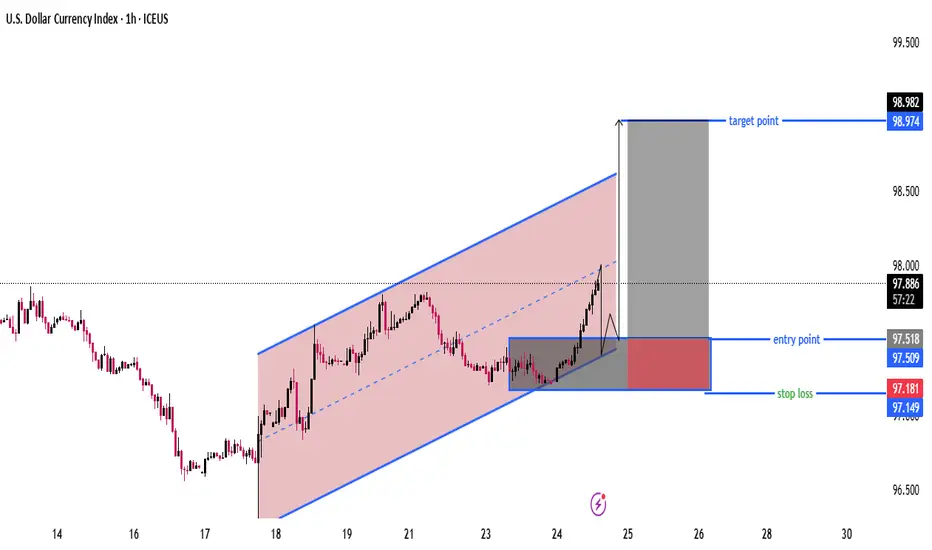
DXY Bullish Channel Setup with 1:4.5 RRR (Entry 97.50 → Target 9Chart Analysis
Trend:
Price is moving inside a rising parallel channel (marked in red with blue borders).
Currently near the mid-to-upper side of the channel.
Setup Highlighted:
Entry Point: Around 97.50 – 97.52 (support zone).
Stop Loss: Around 97.15 – 97.18 (below support and channel bottom).
Target Point: Around 98.97 – 98.98 (near channel top).
Risk-to-Reward Ratio (RRR):
Risk: ~0.33 points (97.50 → 97.18).
Reward: ~1.46 points (97.50 → 98.98).
RRR ≈ 1:4.5, which is a strong setup.
Price Action:
The chart suggests a retest of support (97.50 area) before a bullish continuation.
If buyers hold this level, upward momentum could push toward the 98.90–99.00 zone.
Invalidation:
A breakdown below 97.15 would invalidate the long setup and may push price toward 96.80 – 96.50 support levels.
📌 Summary
Bias: Bullish (as long as price holds above 97.15).
Plan: Wait for a pullback to the entry zone (97.50) for confirmation.
Target: 98.90 – 99.00.
Stop Loss: Below 97.15.
Strong RRR trade idea within the bullish channel.
DXY Dollar Heist: Can You Escape @100?🔥 DXY Dollar Index Bank Heist Plan (Swing Trade) 🔥
Asset: DXY Dollar Index 💵Plan: Bullish 📈Thief Trading Style: Layered Limit Order Strategy 🕵️♂️
🏦 The Heist Plan 🏦
Dear Thief OG's, Ladies & Gentlemen, get ready to pull off the ultimate DXY heist! 💰 We're using the Thief Layering Strategy to stack multiple limit orders and maximize our loot. Follow the plan, adjust to your risk, and let’s escape with the cash! 🚨
📈 Entry: The Break-In
Strategy: Deploy multiple buy limit orders to layer your entries like a master thief 🕴️. Suggested levels:
98.00 💸
98.20 💸
98.40 💸
98.60 💸
Flexibility: Add more layers based on your risk appetite or market conditions 📊.
Pro Tip: Set an alert on TradingView to catch the breakout or pullback at these levels 🚨.
🛑 Stop Loss: The Escape Route
Thief SL: Set at 97.50 to protect your stash 🛡️.
Risk Management: Adjust SL based on your lot size, risk tolerance, and number of layered entries ⚖️.
Warning: Don’t get caught! This is a high-stakes heist—stick to your risk plan 🔥.
🎯 Target: The Getaway
Police Barricade: Resistance at 100.30 🚓—watch out!
Our Target: Take profits at 100.00 to escape with the loot before the market traps you 🏃♂️💨.
🧠 Why This Heist?
The DXY is showing bullish momentum based on real-time market data 📡:
Macro Factors: Strong USD demand driven by economic indicators (check COT reports, geopolitics, and intermarket analysis) 🌍.
Technical Setup: Layered entries align with swing trade pullbacks and key support zones 📉.
Scalpers 👀: Stick to quick long-side trades with trailing SL to lock in profits 💰.
⚠️ Trading Alerts: Stay Sharp!
News Releases: Avoid new trades during high-impact news to dodge volatility traps 🚫.
Position Management: Use trailing stop-loss to secure your profits and stay safe 🛡️.
💪 Boost the Heist!
Hit the Boost Button to power up our Thief Trading Style! 🚀 Every like and view strengthens our crew, helping us rob the market with precision. Let’s make money and vanish like pros! 🤑
Stay tuned for the next heist plan, Thief OG’s! 🕵️♂️🎉

Dollar Index Resistance & Support AnalysisDXY (U.S. Dollar Index) is trading around 97.71, holding within an upward channel after bouncing from the 97.00–97.10 support zone. The structure shows a series of higher highs and higher lows, indicating short-term bullish momentum. However, the chart also highlights a potential “strong high” area near 98.20–98.40, where resistance from both Fibonacci retracement levels and channel tops converge. If DXY fails to break above this resistance, a retracement toward 97.20–97.00 is likely, with further downside risk toward 96.80 if that support breaks.
Based on the current setup, short-term upside toward 98.20–98.40 is possible, but overall bias suggests a likely pullback (downside) after testing resistance, especially if momentum weakens near the channel top.
🔴 Sell Zone (Short Setup)
- Sell Zone (Resistance area): 98.20 – 98.40
- Sell Trigger: If price tests and rejects this zone with bearish candles (reversal signals).
🟢 Buy Zone (Long Setup)
- Buy Zone (Support area): 97.20 – 97.30
- Buy Trigger: If price holds above this zone and shows bullish reversal candles (hammer, engulfing, etc.).
Note
Please risk management in trading is a Key so use your money accordingly. If you like the idea then please like and boost. Thank you and Good Luck!
DXYDXY seems like a correction will be coming before any push up.
Disclosure: We are part of Trade Nation's Influencer program and receive a monthly fee for using their TradingView charts in our analysis.

DXY is setting for another dropPre FOMC move on DXY bearish as with 0.25% to 0.5% rate cut decision as significantly impacted dollar index which on press conference, price finally rejected from the lower level 96.20
As with the weekly close coming in few hours, price approaching another key level of resistance, weekly and monthly giving a high probablity to reject back again to the support level as the resistance consist of 3 higher timeframe confulences, monty and weekly resistance alogn with weekly 10ema combining with break of series of lower highs and break of the combinations could lead the price to drop to the support. at 96.20
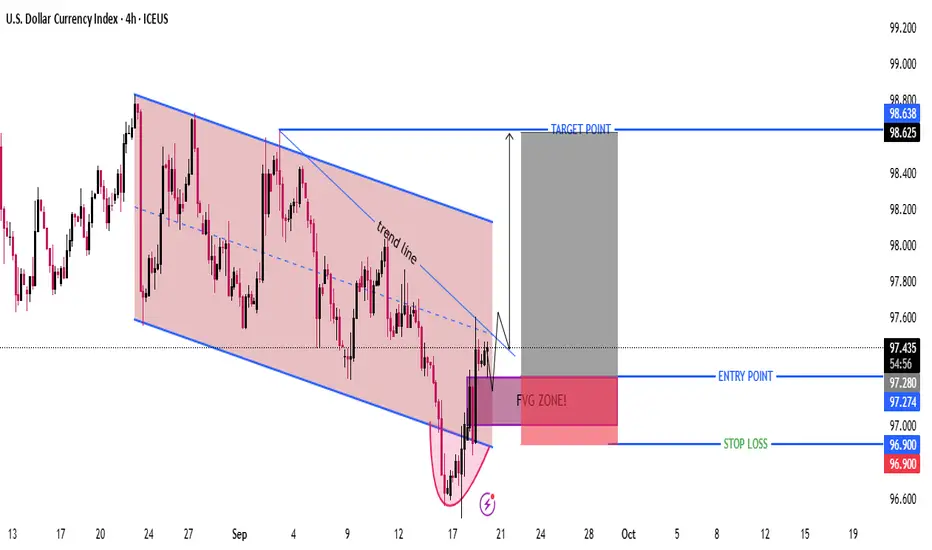
DXY 4H – Bullish Reversal Setup from FVG Zone | Target 98.63Technical Analysis
Downtrend Channel (Bearish Structure)
Price has been moving inside a descending channel (highlighted in red).
Recently, it touched the lower boundary and formed a rounded bottom pattern (possible reversal signal).
Trendline Breakout
A short-term downtrend line has been broken to the upside.
This suggests momentum is shifting from bearish to bullish.
Fair Value Gap (FVG Zone)
Price is currently testing an FVG zone around 97.00–97.28.
This zone acts as a potential entry area for long trades.
Entry, Stop Loss, and Target
Entry Point: 97.28 – 97.27
Stop Loss: 96.90 (below FVG zone support)
Target Point: 98.63
Risk–Reward Ratio: Approximately 1:3 → good setup.
Potential Scenario
If price holds above the FVG zone and doesn’t break below 96.90, we may see a bullish move toward 98.63.
But if the FVG fails and price closes below 96.90, it could resume the downtrend.
✅ Summary:
Market structure shows a possible bullish reversal after a prolonged downtrend.
A clean long setup is planned: Buy near 97.27 → Stop 96.90 → Target 98.63.
Confirmation needed: Strong bullish candle closing above the FVG zone
US Dollar Index - Looking To Sell Pullbacks In The Short TermM15 - Strong bearish move.
No opposite signs.
Currently it looks like a pullback is happening.
Expecting bearish continuation until the two Fibonacci resistance zones hold.
If you enjoy this idea, don’t forget to LIKE 👍, FOLLOW ✅, SHARE 🙌, and COMMENT ✍! Drop your thoughts and charts below to keep the discussion going. Your support helps keep this content free and reach more people! 🚀
-------------------------------------------------------------------------------------------------------------------

USD Index Technical Outlook – Key Buy & Sell LevelsThe U.S. Dollar Index (DXY) is currently trading inside a clear downward channel, showing a bearish market structure. Price is hovering near 98.23, just below the key resistance zone between 98.5 – 99.2, where Fibonacci retracement levels (0.382, 0.5, and 0.618) also align, making it a strong supply area. As long as price remains below this zone, the bias stays bearish, with potential downside targets at 97.5 and then 96.5, in line with the channel support and Fibonacci extensions. However, if buyers manage to push above 99.2, it would signal a possible trend reversal and shift the outlook towards bullish continuation. Overall, the structure suggests that the U.S. Dollar Index is more likely to face rejection near resistance and continue lower in the short term.
🔴 Sell Zone (Short Setup)
- 98.50 – 99.20 is a strong resistance area where price aligns with the Fibonacci retracement (0.382 – 0.618) and the upper channel trendline.
- Sell Trigger: If price shows rejection (bearish candles, wicks, or reversal patterns) within this zone.
🟢 Buy Zone (Long Setup)
- 97.50 – 96.50 area is the channel support and also near Fibonacci extension levels.
- Buy Trigger: Look for bullish confirmation (bounce, bullish engulfing, or rejection wicks).
Note
Please risk management in trading is a Key so use your money accordingly. If you like the idea then please like and boost. Thank you and Good Luck!

LIQUIDITY SWEEP ON DXY BEFORE FALLINGIn this weekend dollar index analysis presentation, my thesis is sideways liquidity sweep before a daily bear flag breakout to the downside. Momentum and RSI on the higher timeframe are still to downside suggesting more selling. Price is still trapped below all our moving averages confirming our trend bias. On the weekly time frame we have a couple of inverted candles at a fib 0.618 support zone suggesting a likely reversal from a higher low but I think these inverted candles are liquidity sweeps from the 0.382 fib retrace resistance level. The daily chart has a strong shooting star which initiated selling pressure to the current trendline support level at 97.432 where our last daily candle was a doji indecision or pause.
In the coming first trading week of September, I will be watching for clear break of the trendline on the daily chart and a confirmed breakout of the fib 0.618 support zone at 97.187 for an initial target of 96.702 and final target of 96.155.
Thank you and have a great profitable trading new month. Cheers!!

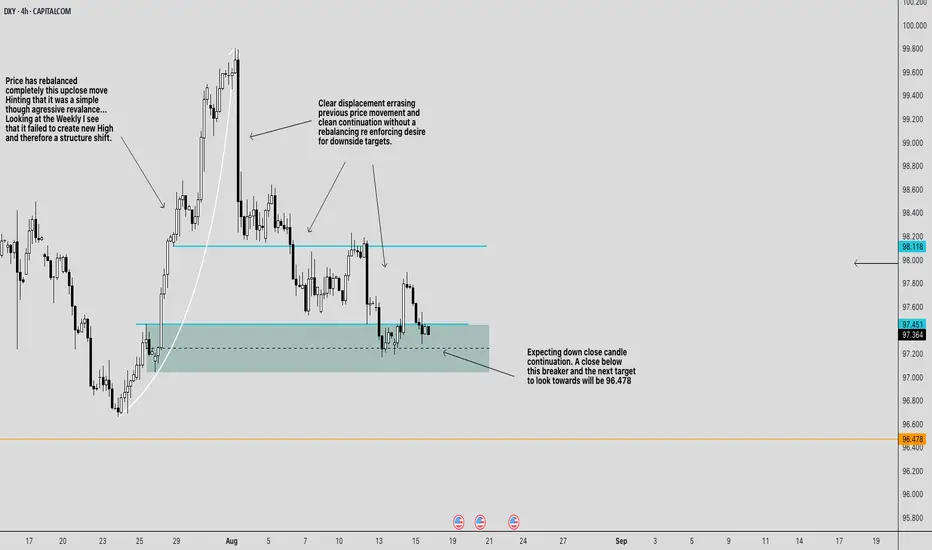
BEARISH CONTINUATION FOR DXYBearish Bias for CAPITALCOM:DXY
Weekly context:
The last up-move failed to print a new weekly high. Failing to create a shift in structure , so rallies are suspect.
4H structure:
We had a hard bearish displacement (large down candles) that erased prior price action and kept going without delivering a “full” rebalance. That usually means the price target remains lower .
The key zones on chart
Breaker / sell zone: \~ 97.45–97.75 (teal box). This is the prior bullish OB that failed (now acting as resistance).
Line in the sand: \~ 97.35–97.40 (dashed line through the teal). A decisive 4H close below here signals continuation.
Upside cap / invalidation area: 98.12 (cyan line) up to \~ 98.20 . Above this, the bearish sentiment weakens.
Primary downside draw: 96.478 (orange line). That’s the next obvious liquidity/inefficiency magnet on your chart.
Trade plan
Idea A — Rejection short from the breaker (preferred):
Entry: look for a rejection setup inside 97.45–97.75 (e.g., 15m/1h bearish shift after a sweep).
Stop: above the breaker and the cyan line ⇒ 98.12 (conservative) or 98.20 (safer).
Targets:
T1: 96.84 (take partials; pay yourself)
T2: 96.47.00
Idea B — Continuation after the break (confirmation play):
Trigger: a 4H close below \~97.35 .
Entry: sell the first clean pullback into 97.35–97.45 .
Stop: above 97.85–98.00 (back inside the breaker); conservative stop 98.12 .
Target: 96.478
Management & invalidation
If price rebalances deeper and closes 4H above 98.12–98.20 , the breaker is failing. Flatten shorts; reassess (potential squeeze toward 98.60–99.00 is then on deck).
If price hesitates at 97.00 , trail above the last 1H swing high to protect realized PnL while aiming for 96.478 .
News risk: Your chart flags upcoming US data (icons). Expect wicks; use hard stops and consider sizing down around releases.
Why this makes sense
* The strong displacement leg sets the draw lower.
* The teal box is a bearish breaker created by a failed bullish structure—ideal for “sell on rally.”
* The market rebalanced the prior up-close leg already; the lack of a symmetrical rebalance on the down-leg favors continuation to the next target ( 96.478 ).
One-liner: Bearish while 4H stays under 98.12 ; sell rallies into 97.45–97.75 or sell a 4H close-and-pullback below 97.35 ; scale out 97.20 → 97.00 → 96.80 → 96.478 ; hard stop above 98.12–98.20 .
*Not financial advice. Size appropriately and stick to your stop.*
PLEASE PUA!
DXY Neutral -BearishCAPITALCOM:DXY
Quick read / bias
Near-term neutral → biased bearish.
Price has failed to produce a clean reversal from the large consolidation at the top, shows a series of lower-highs and liquidity hunts (marked ellipses / Imbalance repairs on the chart), and a visible “downside pressure” supply region above. The path of least resistance is down unless price reclaims the supply/consolidation zone above ~98.6–99.2.
------------------------------------------------
Key levels (from the chart)
Major consolidation / supply: ~99.2 – 99.8 (big-picture resistance).
Downside pressure / mid supply: ~98.5 – 98.8 (area to sell into).
Recent micro highs: 98.39, 98.19, 97.99 (loci for liquidity).
Current price (chart right): ~97.18.
Recent local low/liquidity grab: 96.834.
Weekly void / structural bottom to watch: 96.478 (labelled on chart).
Invalidation for bearish thesis: close/hold above 99.2 (reclaim of consolidation).
------------------------------------------------
How I read the structure (step-by-step)
Price spent time in a higher consolidation zone and then failed to reverse higher — that is a distribution / supply footprint rather than demand.
The chart shows several short liquidity hunts above swing highs (grey ellipses) and subsequent strong selling — classic stop-hunts into supply then continuation lower.
Imbalances / small supply boxes on the chart mark places the market tends to retest before continuing — these are high-probability sell zones on rallies.
The sequence of lower highs and a recent push down to ~96.83 (buyer defence) gives a local support but not yet a valid reversal signal. Until price chops through the weekly void (96.478) or reclaims the supply, expect range/biased-down behavior.
------------------------------------------------
Trade setups (actionable — use your 5-min/1-min workflow)
I’ll give two primary setups: a higher-probability short (sell the rally) and a contrarian long (mean-reversion). Use 5-min to identify displacement into the zone and 1-min for the exact micro reversal entry.
------------------------------------------------
Setup A — Primary: Short on rally into supply (preferred)
Why: Market structure + downside pressure + Imbalance above make rallies into supply favourable.
Area to enter (limit or wait for 1-min reversal): 98.00 – 98.20 (ideal limit ~98.10).
Stop loss: 98.45 (just above the 98.39 / structure swing and above the Imbalance top).
Targets (scale):
T1: 97.00 — first logical demand and psychological level.
T2: 96.50 — deeper swing support / mid structural level.
T3: 96.478 — weekly void bottom (big target if momentum continues).
Risk / reward (example entry 98.10 → stop 98.45):
Risk = 0.35 index points.
R:T1 ≈ 1.10 / 0.35 ≈ 3.14:1.
R:T2 ≈ 1.60 / 0.35 ≈ 4.57:1.
R:T3 ≈ 1.622 / 0.35 ≈ 4.63:1.
Trigger: 5-min displacement into the 98.0–98.2 zone, then 1-min rejection pattern (pin bar / engulf / two-bar reversal) and ideally a filled Imbalance or wick extension that fails. Enter limit at Imbalance top or use a short after 1-min confirmation.
------------------------------------------------
Setup B — Secondary: Mean-reversion long (countertrend)
Why: Buyers defended the 96.83 area previously; a clean, verified micro reversal at lower support can produce a quick retrace. This is lower probability vs the sell-the-rally plan and should be sized smaller.
Area to enter (limit/1-min confirmation): 96.75 – 96.95 (example limit 96.85).
Stop loss: 96.45 (below the 96.48 weekly void and the local wick).
Targets (scale):
T1: 97.40 (near recent chop / first structure).
T2: 97.99 (previous micro high).
T3: 98.39 (if momentum shifts to reclaim structure).
Risk / reward (example entry 96.85 → stop 96.45):
Risk = 0.40.
R:T1 ≈ 0.55 / 0.40 ≈ 1.38:1.
R:T2 ≈ 1.14 / 0.40 ≈ 2.85:1.
R:T3 ≈ 1.54 / 0.40 ≈ 3.85:1.
Trigger: Look for a 5-min exhaustion and 1-min clean micro reversal (two-bar bullish rejection) ideally with buy volume or a wick that holds. Keep size smaller than on shorts.
------------------------------------------------
Intraday scalp idea (quick)
Long scalp on a 1-min reversal after a displacement down to ~96.83 with tight stop under the wick (e.g. 5–8 ticks) and target 97.20–97.40. Use only if price shows clean microstructure and momentum.
Trade management rules
Positioning: Risk a fixed % per trade (e.g., 0.5–1% of account) and size accordingly. The short setup has high RR — size to risk tolerance.
Partial take: Take ~50% at T1, move stop to breakeven, let remainder run to T2/T3.
If price stalls at T1: tighten stop to lock profit or exit if structure shows weakness.
If price breaks and holds above 98.60 / 99.2: exit shorts and flip to neutral/bullish plan — the initial bearish thesis is invalidated.
Use your timeframe combo: identify the displacement on 5-min, execute 1-min entry confirmation.
------------------------------------------------
Invalidation / alternative scenario
Bearish invalidation: clean, sustained close above 98.6–99.2 (consolidation re-claim) — if that happens, the market likely shifts to bullish and short ideas should be abandoned.
Bullish trigger: rally above 99.2 with follow-through and a higher low -> targets back toward 99.8.
------------------------------------------------
Final prediction
Over the next sessions I expect failed rallies into 98.0–98.6 to be sold, which should gravitate price toward 97.00 → 96.50 → 96.48 if momentum confirms. Countertrend longs are possible as scalps/swing trades off 96.8–96.48, but they should be treated as lower-probability and sized smaller. If price instead reclaims and holds >99.2, the bearish bias is invalidated.

USDJPY and DXY, Is FOMC affecting the both currency?Hello traders, this is a complete multiple timeframe analysis of this pair. We see could find significant trading opportunities as per analysis upon price action confirmation we may take this trade. Smash the like button if you find value in this analysis and drop a comment if you have any questions or let me know which pair to cover in my next analysis.

DXY FRGNT WEEKLY CHART ANALYSIS - DXY Q3 W38 Y25🌍FRGNT WEEKLY CHART ANALYSIS - DXY Q3 W38 Y25
📊 DXY FRGNT Breakdown + Impact on GBP, EUR, and Cross Pairs
1. Higher Timeframe Context (Weekly)
Trend: Bearish → clear lower highs & lower lows since mid-summer.
Unmitigated Imbalance (IMB): 99–101 zone above current price → acts as a long-term liquidity magnet but not yet tested.
Bias: Weakness dominates until price proves otherwise.
2. Daily Timeframe
Supply Zone: 98.200–98.500 (aligns with Daily 50 EMA).
Demand Zone: 96.800–97.000 (next liquidity draw).
Expectation: Retrace into 98.2 supply, then continuation lower toward 97.0 demand.
3. Intraday (4H)
Supply Overlap: 97.800–98.200 (Daily + 4H confluence).
Structure: Still bearish, repeated rejections from the 50 EMA.
Projection: Price likely taps 98.0 area, then drives into 97.0 demand.
Summary
Bias: Bearish.
Watch for liquidity sweep above 98.0 → rejection → sell setups toward 97.0 demand.
🌍 Impact on GBP, EUR, and Cross Pairs
GBPUSD
Effect: Dollar weakness supports bullish setups.
Expect retrace into 1.2670–1.2720 demand before price extends higher.
Targets: 1.2800–1.2850, with potential stretch toward 1.2950.
Narrative: As long as DXY stays capped under 98.2, GBPUSD should continue higher.
EURUSD
Effect: Also benefits from USD weakness, though less aggressively than GBP.
Look for longs around 1.0850–1.0880 demand.
Targets: 1.0950–1.1000.
Narrative: Similar structure to GBPUSD, but GBP is likely to outperform EUR.
EURGBP
Effect: GBP stronger than EUR → bearish bias.
Shorts valid below 0.8520, aiming for liquidity under 0.8430–0.8450.
Narrative: Even if both EUR and GBP rise against USD, GBP is leading.
Other USD Cross Pairs
USDJPY: Likely to weaken, targeting 144.50–145.00 liquidity.
USDCAD: Bearish pressure, could reach 1.3600 demand.
USDCHF: Lower toward 0.8850–0.8900 demand.
✅ Overall Picture
DXY Bearish = Favor longs on GBPUSD & EURUSD.
GBP stronger than EUR = EURGBP shorts are attractive.
JPY & CHF weak = Pairs like GBPJPY and EURJPY can push higher.
👉 In short: DXY’s weakness is the engine, driving GBPUSD and EURUSD higher. The Pound has the edge, making EURGBP a sell candidate while GBPJPY becomes a standout buy.
TVC:DXY
FRGNT

DXYDXY has got a potential to give us correction and push up if FOMC will be dropping the Dollar.
Disclosure: We are part of Trade Nation's Influencer program and receive a monthly fee for using their TradingView charts in our analysis.

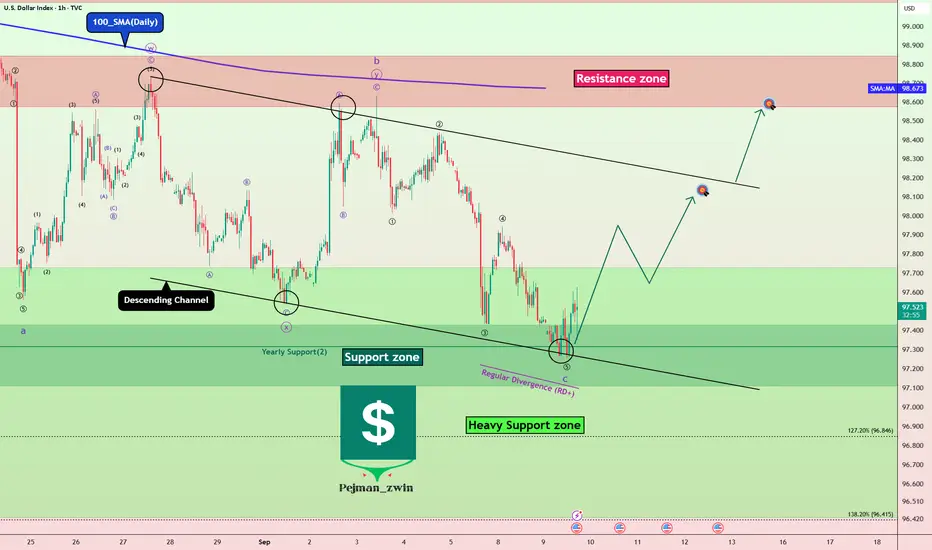
DXY at Major Support – Dollar Ready to Rebound?Today, I want to analyze the DXY index ( TVC:DXY ) for you. First, I must say that this week, US indexes can have an impact on the DXY index trend .
US indexes to be released this week:
Core PPI m/m: Tomorrow
PPI m/m: Tomorrow
Core CPI m/m: Thursday
CPI m/m: Thursday
CPI y/y: Thursday
Unemployment Claims: Thursday
Prelim UoM Consumer Sentiment: Friday
Prelim UoM Inflation Expectations: Friday
The DXY Index is currently moving near the Support zone($97.989-$97.834) , Yearly Support(2) , and the lower line of the descending channel .
In terms of Elliott Wave theory , it seems that the DXY index has managed to complete microwave 5 of the main wave C . The corrective structure is of the Zigzag Correction(ABC/5-3-5) type.
Also, we can see the Regular Divergence (RD+) between consecutive valleys .
I expect the DXY index to rise to at least $98.07(First Target) before the US indexes are announced.
Second Target: $98.56
Stop Loss(SL): $96.997
Note: With the DXY index rising, we can expect a correction in Gold( OANDA:XAUUSD ), Bitcoin( BINANCE:BTCUSDT ), and major Forex pairs (dollar strength).
Please respect each other's ideas and express them politely if you agree or disagree.
U.S. Dollar Index Analyze (DXYUSD), 1-hour time frame.
Be sure to follow the updated ideas.
Do not forget to put a Stop loss for your positions (For every position you want to open).
Please follow your strategy and updates; this is just my Idea, and I will gladly see your ideas in this post.
Please do not forget the ✅' like '✅ button 🙏😊 & Share it with your friends; thanks, and Trade safe.
DXY ready to resume downtrend!97.94 Level on DXY is a high liquidity zone as in the falling market there is bounce off to 97.937. Price grabbed liquidity and started to drop again to the major direction of the trend. As it is a long term down trend and price just rejected from a high liquidity zone, it is a high probability price may continue to drop to this support level as multiple timeframe trend is bearish.

US Dollar Index Drops to 7-Week Low Ahead of Key Inflation DataUS Dollar Index (DXY) Drops to 7-Week Low Ahead of Key Inflation Data
As the US Dollar Index (DXY) chart shows, the value of the USD against a basket of other currencies has fallen below 97.30 – its lowest level since late July.
The reasons lie in market sentiment ahead of major data releases:
→ On Wednesday at 15:30 GMT+3, Producer Price Index (PPI) figures will be published; a month ago they came in extremely high.
→ On Thursday at 15:30 GMT+3, Consumer Price Index (CPI) figures are due.
These releases are particularly significant as next week the Federal Reserve is set to announce its decision on interest rates – a 25-basis-point cut is widely expected.
Technical Analysis of the DXY Chart
On 18 August, we identified a descending channel (shown in red) based on a sequence of lower highs and lower lows → it remains valid.
In addition, our base scenario suggested that the index might test one of the quartile lines (QL and/or QH) dividing the channel → indeed, since then the QH line has been tested several times (red arrow), convincingly acting as resistance.
What Next?
Bearish case:
→ Lower highs and lows throughout the second half of August indicate that sellers are in control of the DXY market.
→ The black arrow marks bearish momentum that broke through support at 98.05 last week.
→ The drop was sharp (a sign of imbalance in favour of sellers), and yesterday the 98.05 level acted as resistance.
Bullish case:
→ The DXY has dropped into the median zone, where supply and demand often balance. Buyers may step in, viewing current levels as attractive for entry.
→ The RSI may potentially form a bullish divergence.
→ The latest candle on the right shows a long lower wick (a bullish pin bar pattern), underlining buyers’ determination.
Given the above, we could expect the DXY to hover around the median area. However, the upcoming US inflation reports could trigger volatility across financial markets. A test of support at 97.15 could occur.
This article represents the opinion of the Companies operating under the FXOpen brand only. It is not to be construed as an offer, solicitation, or recommendation with respect to products and services provided by the Companies operating under the FXOpen brand, nor is it to be considered financial advice.
DXYDXY is expected to give us correction or impulse upside.
Disclosure: We are part of Trade Nation's Influencer program and receive a monthly fee for using their TradingView charts in our analysis.

DXY Intraday Overview- US Dollar Index (DXY) breached the symmetrical triangle downwards and sustained downwards.
- It indicates that sellers are still strong, hence the structure remains downwards.
🔽 If the immediate support level of 97.80 (fib level 0.786) is broken again, then the price will continue its fall to the next support zone between 97.56 - 97.50
🔼 However, if the price manages to recover and break through the resistance level of 97.90, we can expect a further rise to the level of 98.00.

DXYDXY is heading towards the critical zone as highlighted for buys or further sells from the box.
Disclosure: We are part of Trade Nation's Influencer program and receive a monthly fee for using their TradingView charts in our analysis.

Dollar Index: Déjà Vu at the BottomTVC:DXY is testing the bottom of its channel once again. Historically, every touch at these levels has been followed by a rally in the dollar.
If the pattern holds, a rebound here could have meaningful implications for equities, commodities, and crypto.
