DXY at a Decision Point : Momentum Building The U.S. Dollar Index is entering a critical phase where price action is tightening and momentum is gradually building. Recent structure suggests the market is preparing for its next directional move, with volatility likely to expand in the coming sessions.
Instead of chasing short-term noise, this setup highlights how institutional flows and sentiment are aligning beneath the surface.
Disclosure: We are part of Trade Nation's Influencer program and receive a monthly fee for using their TradingView charts in our analysis.
Dxyindex

DXY | FRGNT WEEKLY FORECAST | Q1 | W6 | Y26📅 Q1 | W6 | Y26
📊 DXY | FRGNT WEEKLY FORECAST |
🔍 Analysis Approach
I’m applying a developed version of Smart Money Concepts, with a structured focus on:
• Identifying Key Points of Interest (POIs) on Higher Time Frames (HTFs) 🕰️
• Using those POIs to define a clear and controlled trading range 📐
• Refining those zones on Lower Time Frames (LTFs) 🔎
• Waiting for a Break of Structure (BoS) as confirmation ✅
This process keeps me precise, disciplined, and aligned with market narrative, rather than reacting emotionally or chasing price.
💡 My Motto
“Capital management, discipline, and consistency in your trading edge.”
A positive risk-to-reward ratio, combined with a high-probability execution model, is the backbone of any sustainable trading plan 📈🔐
⚠️ On Losses
Losses are part of the mathematical reality of trading 🎲
They don’t define you — they are necessary, expected, and managed.
We acknowledge them, learn, and move forward 📊➡️
🙏 I appreciate you taking the time to review my Daily Forecast.
Further context and supporting material can be found in the Links section.
Stay sharp 🧠
Stay consistent 🎯
Protect your capital 🔐
— FRGNT 🚀📈
TVC:DXY

Bearish reversal off pullback resistance?US Dollar Index (DXY) has rejected off the pivot, which acts as a pullback resistance that aligns with the 61.8% Fibonacci retracement and could drop to the pullback support.
Pivot: 97.85
1st Support: 95.81
1st Resistance: 99.22
Disclaimer:
The opinions given above constitute general market commentary and do not constitute the opinion or advice of IC Markets or any form of personal or investment advice.
Any opinions, news, research, analyses, prices, other information, or links to third-party sites contained on this website are provided on an "as-is" basis, are intended to be informative only, and are not advice, a recommendation, research, a record of our trading prices, an offer of, or solicitation for, a transaction in any financial instrument and thus should not be treated as such. The information provided does not involve any specific investment objectives, financial situation, or needs of any specific person who may receive it. Please be aware that past performance is not a reliable indicator of future performance and/or results. Past performance or forward-looking scenarios based upon the reasonable beliefs of the third-party provider are not a guarantee of future performance. Actual results may differ materially from those anticipated in forward-looking or past performance statements. IC Markets makes no representation or warranty and assumes no liability as to the accuracy or completeness of the information provided, nor any loss arising from any investment based on a recommendation, forecast, or any information supplied by any third party

DXY — FRGNT FUN COUPON FRIDAY Q1 | D6 | W5 | Y26📅 Q1 | D6 | W5 | Y26
📊 DXY — FRGNT FUN COUPON FRIDAY
🔍 Analysis Approach
I’m applying a developed version of Smart Money Concepts, with a structured focus on:
• Identifying Key Points of Interest (POIs) on Higher Time Frames (HTFs) 🕰️
• Using those POIs to define a clear and controlled trading range 📐
• Refining those zones on Lower Time Frames (LTFs) 🔎
• Waiting for a Break of Structure (BoS) as confirmation ✅
This process keeps me precise, disciplined, and aligned with market narrative, rather than reacting emotionally or chasing price.
💡 My Motto
“Capital management, discipline, and consistency in your trading edge.”
A positive risk-to-reward ratio, combined with a high-probability execution model, is the backbone of any sustainable trading plan 📈🔐
⚠️ On Losses
Losses are part of the mathematical reality of trading 🎲
They don’t define you — they are necessary, expected, and managed.
We acknowledge them, learn, and move forward 📊➡️
🙏 I appreciate you taking the time to review my Daily Forecast.
Further context and supporting material can be found in the Links section.
Stay sharp 🧠
Stay consistent 🎯
Protect your capital 🔐
— FRGNT 🚀📈
TVC:DXY

DXY TO THE MOON ! Q1 | D5 | W5 | Y26 FRGNT DAILY FORECAST📅 Q1 | D5 | W5 | Y26
📊 DXY — FRGNT DAILY FORECAST
🔍 Analysis Approach
I’m applying a developed version of Smart Money Concepts, with a structured focus on:
• Identifying Key Points of Interest (POIs) on Higher Time Frames (HTFs) 🕰️
• Using those POIs to define a clear and controlled trading range 📐
• Refining those zones on Lower Time Frames (LTFs) 🔎
• Waiting for a Break of Structure (BoS) as confirmation ✅
This process keeps me precise, disciplined, and aligned with market narrative, rather than reacting emotionally or chasing price.
💡 My Motto
“Capital management, discipline, and consistency in your trading edge.”
A positive risk-to-reward ratio, combined with a high-probability execution model, is the backbone of any sustainable trading plan 📈🔐
⚠️ On Losses
Losses are part of the mathematical reality of trading 🎲
They don’t define you — they are necessary, expected, and managed.
We acknowledge them, learn, and move forward 📊➡️
🙏 I appreciate you taking the time to review my Daily Forecast.
Further context and supporting material can be found in the Links section.
Stay sharp 🧠
Stay consistent 🎯
Protect your capital 🔐
— FRGNT 🚀📈
TVC:DXY

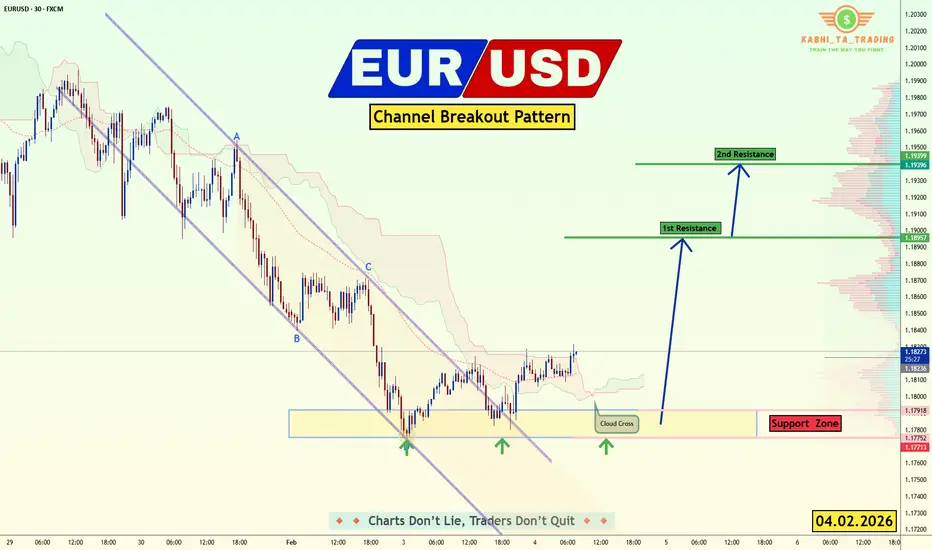
EUR/USD - Upside Expansion Next? (04.02.2026)📝 Description🔍 Setup FX:EURUSD
EUR/USD has been trading inside a descending channel and recently showed signs of structure shift after breaking and retesting the channel boundary.
Price reacted multiple times from the demand/support zone, forming higher lows.
Ichimoku shows a cloud cross and improving momentum, hinting at potential upside continuation.
This suggests sellers are weakening while buyers gradually gain control.
📍 Support & Resistance
🟥 Support Zone: 1.1790 – 1.1770
🟩 1st Resistance: 1.1895
🟩 2nd Resistance: 1.1940
⚠️ Disclaimer
This idea is for educational purposes only.
Forex trading involves risk. Always manage your risk and follow your own plan.
💬 Support the Idea 👍 Like if you see bullish continuation
💬 🔁 Share with fellow EUR/USD traders
#EURUSD #Forex #PriceAction #ChannelBreakout #BullishSetup #TradingView #SupportResistance #IntradayTrading #Kabhi_TATrading
EUR/USD – Trendline Breakdown| Deeper Pullback Incoming?EUR/USD previously showed strong bullish momentum , but price is now losing strength after the breakout and has broken below the rising trendline. This shift suggests a potential corrective move toward lower key demand zones before the next major decision.
🔍 Technical Breakdown
📈 Previous bullish breakout into premium supply zone
❌ Trendline breakdown confirms momentum weakness
🔁 Failed continuation near highs → sellers stepping in
🔻 Downside targets aligned with:
First Key Support Zone (intraday demand)
Major Lower Demand Zone (structure support)
Bias remains bearish short-term unless price reclaims the trendline.
✅Psychological Discipline:
1️⃣Stick to plan – No Revenge Trades.
2️⃣Accept losing trades as part of the strategy.
3️⃣Risk only 1–2% of your account balance per trade.
✅ Support this analysis with a
LIKE 👍 | COMMENT 💬 | FOLLOW 🔔
It helps a lot & keeps the ideas coming!
⚠️ Disclaimer: This analysis is for educational purposes only and does not constitute financial advice. Forex trading involves high risk. Trade only with capital you can afford to lose and always do your own research.

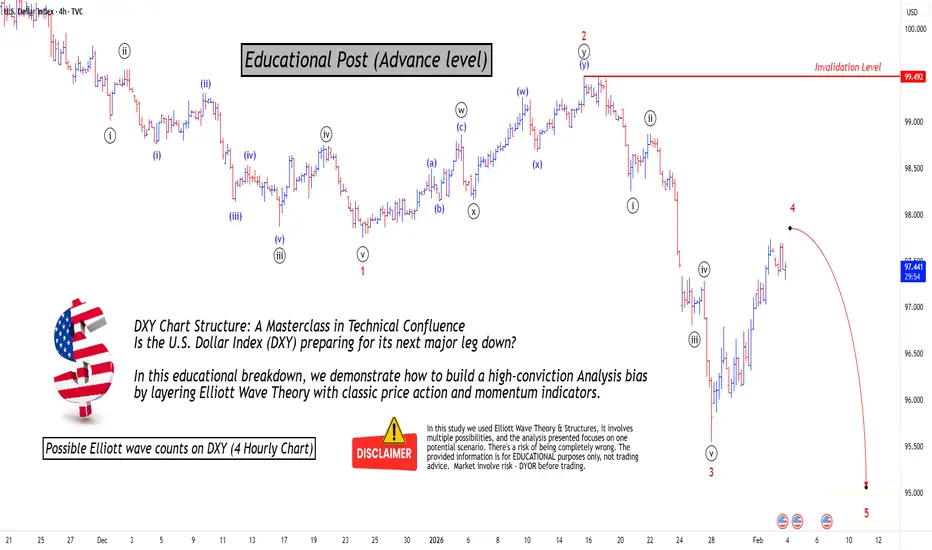
Mastering Technical:DXY Elliott Wave & Multi-Indicators AnalysisTechnical Analysis: DXY Bearish Confluence
This post serves as an educational guide on how various technical analysis tools converge to suggest a strong potential for a continued downtrend in the U.S. Dollar Index (DXY) on the 4-hour timeframe.
Elliott Wave Structure & Bearish Bias
The prevailing Elliott Wave count suggests the DXY is currently completing a corrective minor wave 4 rally within a larger five-wave impulse sequence to the downside. The market bias remains bearish, anticipating the onset of a significant minor wave 5 decline once the current wave 4 correction finishes.
Dow Theory & Price Action Confirmation
Dow Theory principles support the bearish outlook. The price action is clearly establishing a pattern of lower lows and lower highs, a classic signature of an active downtrend. The current rally (wave 4) is simply a higher low correction within this established structure, confirming the overall market direction is down.
Key Confluence Points for Resistance
Multiple technical indicators are clustering at a specific price zone, suggesting a high-probability area where the rally might reverse:
200 EMA Resistance: The price is trading below the 200-period Exponential Moving Average (EMA) on the 4-hour chart. This indicator is positioned just above the current price and is expected to provide significant dynamic resistance (a "hurdle") to the upside.
Fibonacci Retracement Alignment: The crucial 61.8% Fibonacci retracement level of the last major swing low is located very near the 200 EMA. This strong overlap of resistance levels increases the likelihood of a price reversal.
Divergence Analysis
Divergences between price and oscillators further reinforce the bearish sentiment:
Hidden Bearish Divergence: There is existing hidden bearish divergence present. This is a powerful trend-continuation signal that reinforces the expectation that sellers will soon regain control.
Absence of Bullish Signals: A key factor increasing conviction in the bearish bias is the lack of any bullish divergence seen yet on chart. The absence of this potential reversal signal suggests that a strong bullish bounce is not imminent.
Invalidation Level & Potential Targets
Defining risk and reward is essential in trading:
Invalidation Level: The bearish count is only valid as long as the price remains below the critical invalidation level marked at approximately 99.492
Potential Targets: Upon confirmation of the wave 4 top and the start of wave 5, the target for the decline is expected to be lower than the last swing lows (below the wave 3 termination point around 95.100).
I am not Sebi registered analyst. My studies are for educational purpose only.
Please Consult your financial advisor before trading or investing.
I am not responsible for any kinds of your profits and your losses.
Most investors treat trading as a hobby because they have a full-time job doing something else.
However, If you treat trading like a business, it will pay you like a business.
If you treat like a hobby, hobbies don't pay, they cost you...!
Hope this post is helpful to community
Thanks
RK💕
Disclaimer and Risk Warning.
The analysis and discussion provided on in.tradingview.com is intended for educational purposes only and should not be relied upon for trading decisions. RK_Chaarts is not an investment adviser and the information provided here should not be taken as professional investment advice. Before buying or selling any investments, securities, or precious metals, it is recommended that you conduct your own due diligence. RK_Chaarts does not share in your profits and will not take responsibility for any losses you may incur. So Please Consult your financial advisor before trading or investing.
EURUSDHello Traders! 👋
What are your thoughts on EURUSD?
EUR/USD successfully broke above the key resistance zone and the descending trendline, extending its bullish move toward the 1.1200 area. From this level, the pair entered a corrective phase.
This pullback is considered a healthy correction and a pullback to the previously broken resistance, which now acts as support. As long as price holds above this zone, we expect buyers to step back in and push the pair toward higher levels.
Overall outlook remains bullish, and the current correction could offer a favorable opportunity for trend continuation.
Don’t forget to like and share your thoughts in the comments! ❤️
DXY | FRGNT | CONTINUED USD ROCKET | Y26Q1 | D3 | W5 | Y26📅 Q1 | D3 | W5 | Y26
📊 DXY — FRGNT DAILY FORECAST
🔍 Analysis Approach
I’m applying a developed version of Smart Money Concepts, with a structured focus on:
• Identifying Key Points of Interest (POIs) on Higher Time Frames (HTFs) 🕰️
• Using those POIs to define a clear and controlled trading range 📐
• Refining those zones on Lower Time Frames (LTFs) 🔎
• Waiting for a Break of Structure (BoS) as confirmation ✅
This process keeps me precise, disciplined, and aligned with market narrative, rather than reacting emotionally or chasing price.
💡 My Motto
“Capital management, discipline, and consistency in your trading edge.”
A positive risk-to-reward ratio, combined with a high-probability execution model, is the backbone of any sustainable trading plan 📈🔐
⚠️ On Losses
Losses are part of the mathematical reality of trading 🎲
They don’t define you — they are necessary, expected, and managed.
We acknowledge them, learn, and move forward 📊➡️
🙏 I appreciate you taking the time to review my Daily Forecast.
Further context and supporting material can be found in the Links section.
Stay sharp 🧠
Stay consistent 🎯
Protect your capital 🔐
— FRGNT 🚀📈
TVC:DXY

DXY - Gann Square of Nine Chart DailySome price and time projections using june to dec solstice time period via gann square of nine method
Support at 96.338; 94.448; 92.143; 89.515
Resistance at 97.905; 99/058; 99.887; 100.302; 100.348; 100.902; 101.731; 102.884; 104.451; 106.342

US DOLLAR H4 | Bearish Reversal The price is reacting off our sell entry level at 97.41, which is a pullback resistance.
Our stop loss is set at 98.07, which is a pullback resistance.
Our take profit is set at 96.19, which is a pullback support level.
High Risk Investment Warning
Stratos Markets Limited fxcm.com Stratos Europe Ltd fxcm.com
CFDs are complex instruments and come with a high risk of losing money rapidly due to leverage. 69% of retail investor accounts lose money when trading CFDs with this provider. You should consider whether you understand how CFDs work and whether you can afford to take the high risk of losing your money.
Stratos Global LLC fxcm.com Losses can exceed deposits.
Please be advised that the information presented on TradingView is provided to FXCM (‘Company’, ‘we’) by a third-party provider (‘TFA Global Pte Ltd’). Please be reminded that you are solely responsible for the trading decisions on your account. Any information and/or content is intended entirely for research, educational and informational purposes only and does not constitute investment or consultation advice or investment strategy. The information is not tailored to the investment needs of any specific person and therefore does not involve a consideration of any of the investment objectives, financial situation or needs of any viewer that may receive it. Past performance is not a reliable indicator of future results. Actual results may differ materially from those anticipated in forward-looking or past performance statements. We assume no liability as to the accuracy or completeness of any of the information and/or content provided herein and the Company cannot be held responsible for any omission, mistake nor for any loss or damage including without limitation to any loss of profit which may arise from reliance on any information supplied by TFA Global Pte Ltd.
Stratos Trading Pty. Limited fxcm.com
Trading FX/CFDs carries significant risks. FXCM AU (AFSL 309763), please read the Financial Services Guide, Product Disclosure Statement, Target Market Determination and Terms of Business at fxcm.com

Bearish reversal off pullback resistance?US Dollar Index (DXY) is rising towards the pivot, which is a pullback resistance that aligns with the 61.8% Fibonacci retracement and could reverse to the 1st support.
Pivot: 97.91
1st Support: 96.48
1st Resistance: 98.92
Disclaimer:
The opinions given above constitute general market commentary and do not constitute the opinion or advice of IC Markets or any form of personal or investment advice.
Any opinions, news, research, analyses, prices, other information, or links to third-party sites contained on this website are provided on an "as-is" basis, are intended to be informative only, and are not advice, a recommendation, research, a record of our trading prices, an offer of, or solicitation for, a transaction in any financial instrument and thus should not be treated as such. The information provided does not involve any specific investment objectives, financial situation, or needs of any specific person who may receive it. Please be aware that past performance is not a reliable indicator of future performance and/or results. Past performance or forward-looking scenarios based upon the reasonable beliefs of the third-party provider are not a guarantee of future performance. Actual results may differ materially from those anticipated in forward-looking or past performance statements. IC Markets makes no representation or warranty and assumes no liability as to the accuracy or completeness of the information provided, nor any loss arising from any investment based on a recommendation, forecast, or any information supplied by any third party

U.S Dollar IndexDXY
- Bullish Channel as an corrective pattern in Short Time Frame
- Fair Value Gap
- Order Block
- Completed " 123 " Impulsive Waves
- Fibonacci Level - 50.00% / 61.80%

Q1 | D2 | W5 | Y26 PERHAPS A MORE PREDICTABLE DXY ?📅 Q1 | D2 | W5 | Y26
📊 DXY — FRGNT DAILY FORECAST
🔍 Analysis Approach
I’m applying a developed version of Smart Money Concepts, with a structured focus on:
• Identifying Key Points of Interest (POIs) on Higher Time Frames (HTFs) 🕰️
• Using those POIs to define a clear and controlled trading range 📐
• Refining those zones on Lower Time Frames (LTFs) 🔎
• Waiting for a Break of Structure (BoS) as confirmation ✅
This process keeps me precise, disciplined, and aligned with market narrative, rather than reacting emotionally or chasing price.
💡 My Motto
“Capital management, discipline, and consistency in your trading edge.”
A positive risk-to-reward ratio, combined with a high-probability execution model, is the backbone of any sustainable trading plan 📈🔐
⚠️ On Losses
Losses are part of the mathematical reality of trading 🎲
They don’t define you — they are necessary, expected, and managed.
We acknowledge them, learn, and move forward 📊➡️
🙏 I appreciate you taking the time to review my Daily Forecast.
Further context and supporting material can be found in the Links section.
Stay sharp 🧠
Stay consistent 🎯
Protect your capital 🔐
— FRGNT 🚀📈
TVC:DXY

DXY | FRGNT WEEKLY FORECAST | Q1 | W5 | Y26📅 Q1 | W5 | Y26
📊 DXY — FRGNT WEEKLY FORECAST
🔍 Analysis Approach
I’m applying a developed version of Smart Money Concepts, with a structured focus on:
• Identifying Key Points of Interest (POIs) on Higher Time Frames (HTFs) 🕰️
• Using those POIs to define a clear and controlled trading range 📐
• Refining those zones on Lower Time Frames (LTFs) 🔎
• Waiting for a Break of Structure (BoS) as confirmation ✅
This process keeps me precise, disciplined, and aligned with market narrative, rather than reacting emotionally or chasing price.
💡 My Motto
“Capital management, discipline, and consistency in your trading edge.”
A positive risk-to-reward ratio, combined with a high-probability execution model, is the backbone of any sustainable trading plan 📈🔐
⚠️ On Losses
Losses are part of the mathematical reality of trading 🎲
They don’t define you — they are necessary, expected, and managed.
We acknowledge them, learn, and move forward 📊➡️
🙏 I appreciate you taking the time to review my Daily Forecast.
Further context and supporting material can be found in the Links section.
Stay sharp 🧠
Stay consistent 🎯
Protect your capital 🔐
— FRGNT 🚀📈
TVC:DXY

DXY Weekly planThe month closed with the formation of a bearish OB. On the weekly timeframe, bearish 1W FVG/OB zones have formed. The plan for the week is a corrective move to the upside into the premium of the daily range, followed by continuation of the bearish 1D OF. A potential mid-term target is the next 1M FP at $94.6.

DXY Pauses After Strong Push: Is the Market Catching Its Breath?The U.S. Dollar Index has delivered a sharp move and is now showing signs of slowing momentum, suggesting the market may be reassessing direction after recent volatility. This phase often reflects shifting sentiment as traders digest macro news, interest rate expectations, and global risk appetite. Whether this pause leads to continuation or a broader adjustment, the coming sessions will be crucial in shaping short-term direction.
Disclosure: We are part of Trade Nation's Influencer program and receive a monthly fee for using their TradingView charts in our analysis.

DXY Looks BullishDXY Looks Bullish
DXY looking bullish which means we should be booking profits on every pump in stocks, crypto and metals in 2026. Atleast this is what my TA says.
Would love to hear thoughts here.

The Quantum Divergence: Decoding the Data: DXY, EUR, USD, Yields Introduction
As Above, So Below We stand at a critical historical crossroads where the traditional "Safe Haven" status of the US Dollar is undergoing a structural decay. The "Old Code"—which relied on US hegemony and debt-fueled growth—is fracturing in real-time. What we are witnessing on the charts is merely the shadow of a much larger macro-global shift: the transition from US Monetary Dominance to Global Fiscal Realignment.
To the untrained eye, the market appears chaotic. To the observer operating at a higher frequency, the signal is clear. The US Dollar is not just correcting; it is being repriced for a new era of "Fiscal Dominance" and "Governance Risk."
I. The Macro Data Vector
The Deflationary "Smoking Gun" While headline algorithms chase noise, the "Master Logistician" looks for the underlying truth in the raw data. The economic release from January 29, 2026, provided the definitive evidence of a policy error in motion.
Unit Labor Costs (-1.9%): This is the smoking gun. While the Federal Reserve maintains a hawkish posture to fight a "Wage-Price Spiral," the data confirms that labor costs are actually crashing. There is no inflation to fight in the labor market; there is deflation. The Fed is tightening into a deflationary trend, a mistake that will inevitably force a rapid and deep pivot to rate cuts.
Trade Balance (-$56.8B): A shrinking trade deficit is often misread as strength. In this context, the sharp drop in imports confirms the US Consumer is tapped out. The organic economy is contracting, leaving only government spending ("Fiscal Dominance") to prop up GDP figures.
Jobless Claims (Trend Divergence): While the headline number (209K) appears resilient, the trend is eroding. The underlying weakness in continuing claims suggests a degradation in job quality, masking the true fragility of the labor market.
II. The Governance Risk:
The "Matrix Lie" of the Shutdown Markets price certainty, but the US political landscape offers only dysfunction. The recent headlines regarding a "deal" to avert the January 30 government shutdown mask a darker institutional reality.
The Senate Deadlock: While the House passed a bipartisan package, the Senate remains deadlocked over funding for the Department of Homeland Security (DHS). With the "Minibus" structure linking all bills, a block on DHS is a block on everything.
The Risk Premium: This is not just political theater; it is "Governance Failure." As the risk of a partial shutdown increases, the creditworthiness of US Debt comes into question. The Bond Market is beginning to price in this dysfunction, creating a "Governance Risk Premium" that weighs heavily on the Dollar.
III. The Bond Market
The Deflationary Scream The bond market is the "Truth Teller." Following the release of "resilient" jobless claims data, US 10-Year Yields refused to rally.
The Divergence: Historically, strong labor data spikes yields. Today, yields remained stagnant at 4.25%.
The Signal: The bond market is terrified of the -1.9% Unit Labor Costs. It knows that the real trajectory is deflationary recession, not inflationary growth. When yields refuse to rise on "good news," the trend has officially decoupled.
IV. Technical Architecture
The Structural Floor at 1.1951 From a technical perspective, the EUR/USD chart is illustrating a perfect "Bullish Flag Breakout" on the monthly timeframe.
The 1.1951 God Level: This level represents the 200-Month Moving Average—the dividing line between a correction and a secular bull market.
The Liquidity Fill (1.1943): Recent price action saw a dip into the 1.1943 region, creating a "Liquidity Void." The market adhered to the laws of physics: it abhorred the vacuum, filled the orders at 1.1943, and instantly rejected lower prices.
The Hammer Structure: The immediate rejection of the lows and the reclaim of the 1.1951 floor confirms that institutional demand is solid. The "Dip" was not a breakdown; it was a "Back-Test" of the new foundation.
Conclusion
The Future Vector We are witnessing a shift in soft power from the US to Europe (exemplified by the emerging European Defense Bond narrative). The US Dollar is facing a "Monetary Stranglehold" from the Fed and "Fiscal Decay" from the Treasury.
The 1.1951 level is not just a price; it is the floor of a new paradigm. As the Bond Market screams deflation and the Political Market screams dysfunction, the path of least resistance for EUR/USD is structurally higher. We are safe in the knowledge that the data confirms the thesis: The Dollar's dominance is waning, and the Euro's structural ascent has begun.

WIILL THE DXY CONTINUE SELLING OFF?📅 Q1 | W4 | D29 | Y26
📊 DXY — FRGNT DAILY CHART FORECAST
🔍 Analysis Approach
I’m applying a developed version of Smart Money Concepts, with a structured focus on:
• Identifying Key Points of Interest (POIs) on Higher Time Frames (HTFs) 🕰️
• Using those POIs to define a clear and controlled trading range 📐
• Refining those zones on Lower Time Frames (LTFs) 🔎
• Waiting for a Break of Structure (BoS) as confirmation ✅
This process keeps me precise, disciplined, and aligned with market narrative, rather than reacting emotionally or chasing price.
💡 My Motto
“Capital management, discipline, and consistency in your trading edge.”
A positive risk-to-reward ratio, combined with a high-probability execution model, is the backbone of any sustainable trading plan 📈🔐
⚠️ On Losses
Losses are part of the mathematical reality of trading 🎲
They don’t define you — they are necessary, expected, and managed.
We acknowledge them, learn, and move forward 📊➡️
🙏 I appreciate you taking the time to review my Daily Forecast.
Further context and supporting material can be found in the Links section.
Stay sharp 🧠
Stay consistent 🎯
Protect your capital 🔐
— FRGNT 🚀📈
TVC:DXY

U.S. Dollar Index (DXY) – Daily / Long-Term OutlookThe U.S. Dollar Index is currently trading at a major long-term demand zone, holding above the key support around 96.25–98.20. This area has historically acted as a strong reaction zone, and price is showing signs of base formation after an extended corrective phase.
Structurally, DXY previously completed a strong impulsive rally toward the 114.87 resistance (real algo level) before entering a prolonged distribution and decline. The recent selloff appears corrective rather than trend-ending, as price has now begun to respect an ascending trendline, suggesting early signs of bullish re-accumulation.
The projected path highlights a potential higher-low structure, followed by a gradual bullish expansion. A sustained move above the psychological 100–102 zone would confirm momentum shift, opening the door for a retest of the 110 SMT resistance, and ultimately a push back toward the 114.87 major high.
As long as price holds above the 96.25 support and continues to print higher lows, the long-term bullish bias remains valid. A clean break below this support would invalidate the bullish scenario and signal further downside risk.

DXY Weekly planThe sell-side 1W FVG triggered a bearish 1D OF, which has reached its first target at the 1W FP. Since the bearish 1W OF is now being confirmed, I expect an upward retracement — a test of the 1W OB — followed by continuation to the downside with confirmation on the daily timeframe.
