DXY FRGNT Daily Forecast - Q4 | W44 | D30| Y25 |📅 Q4 | W44 | D30| Y25 |
📊 DXY FRGNT Daily Forecast
🔍 Analysis Approach:
I’m applying Smart Money Concepts, focusing on:
Identifying Points of Interest on the Higher Time Frames (HTFs) 🕰️
Using those POIs to define a clear trading range 📐
Refining those zones on Lower Time Frames (LTFs) 🔎
Waiting for a Break of Structure (BoS) for confirmation ✅
This method allows me to stay precise, disciplined, and aligned with the market narrative, rather than chasing price.
💡 My Motto:
"Capital management, discipline, and consistency in your trading edge."
A positive risk-to-reward ratio, paired with a high win rate, is the backbone of any solid trading plan 📈🔐
⚠️ Losses?
They’re part of the mathematical game of trading 🎲
They don’t define you — they’re necessary, they happen, and we move forward 📊➡️
🙏 I appreciate you taking the time to review my Daily Forecast.
Stay sharp, stay consistent, and protect your capital
— FRNGT 🚀
TVC:DXY
Dxyshort!!!!!!!!!!!!!

DXY FRGNT Daily Forecast -Q4 | W44 | D29| Y25 |📅 Q4 | W44 | D29| Y25 |
📊 DXY FRGNT Daily Forecast
🔍 Analysis Approach:
I’m applying Smart Money Concepts, focusing on:
Identifying Points of Interest on the Higher Time Frames (HTFs) 🕰️
Using those POIs to define a clear trading range 📐
Refining those zones on Lower Time Frames (LTFs) 🔎
Waiting for a Break of Structure (BoS) for confirmation ✅
This method allows me to stay precise, disciplined, and aligned with the market narrative, rather than chasing price.
💡 My Motto:
"Capital management, discipline, and consistency in your trading edge."
A positive risk-to-reward ratio, paired with a high win rate, is the backbone of any solid trading plan 📈🔐
⚠️ Losses?
They’re part of the mathematical game of trading 🎲
They don’t define you — they’re necessary, they happen, and we move forward 📊➡️
🙏 I appreciate you taking the time to review my Daily Forecast.
Stay sharp, stay consistent, and protect your capital
— FRNGT 🚀
TVC:DXY

DXY FRGNT Daily Forecast -Q4 | W44 | D28| Y25 |📅 Q4 | W44 | D28| Y25 |
📊 DXY FRGNT Daily Forecast
🔍 Analysis Approach:
I’m applying Smart Money Concepts, focusing on:
Identifying Points of Interest on the Higher Time Frames (HTFs) 🕰️
Using those POIs to define a clear trading range 📐
Refining those zones on Lower Time Frames (LTFs) 🔎
Waiting for a Break of Structure (BoS) for confirmation ✅
This method allows me to stay precise, disciplined, and aligned with the market narrative, rather than chasing price.
💡 My Motto:
"Capital management, discipline, and consistency in your trading edge."
A positive risk-to-reward ratio, paired with a high win rate, is the backbone of any solid trading plan 📈🔐
⚠️ Losses?
They’re part of the mathematical game of trading 🎲
They don’t define you — they’re necessary, they happen, and we move forward 📊➡️
🙏 I appreciate you taking the time to review my Daily Forecast.
Stay sharp, stay consistent, and protect your capital
— FRNGT 🚀
TVC:DXY

DXY FRGNT Daily Forecast -Q4 | W44 | D27| Y25 |📅 Q4 | W44 | D27| Y25 |
📊 DXY FRGNT Daily Forecast
🔍 Analysis Approach:
I’m applying Smart Money Concepts, focusing on:
Identifying Points of Interest on the Higher Time Frames (HTFs) 🕰️
Using those POIs to define a clear trading range 📐
Refining those zones on Lower Time Frames (LTFs) 🔎
Waiting for a Break of Structure (BoS) for confirmation ✅
This method allows me to stay precise, disciplined, and aligned with the market narrative, rather than chasing price.
💡 My Motto:
"Capital management, discipline, and consistency in your trading edge."
A positive risk-to-reward ratio, paired with a high win rate, is the backbone of any solid trading plan 📈🔐
⚠️ Losses?
They’re part of the mathematical game of trading 🎲
They don’t define you — they’re necessary, they happen, and we move forward 📊➡️
🙏 I appreciate you taking the time to review my Daily Forecast.
Stay sharp, stay consistent, and protect your capital
— FRNGT 🚀
TVC:DXY

DXY WEEKLY FRGNT FORECAST - Q4 | W44 Y25 |📅 Q4 | W44 Y25 |
📊 DXY WEEKLY FRGNT FORECAST
🔍 Analysis Approach:
I’m applying Smart Money Concepts, focusing on:
Identifying Points of Interest on the Higher Time Frames (HTFs) 🕰️
Using those POIs to define a clear trading range 📐
Refining those zones on Lower Time Frames (LTFs) 🔎
Waiting for a Break of Structure (BoS) for confirmation ✅
This method allows me to stay precise, disciplined, and aligned with the market narrative, rather than chasing price.
💡 My Motto:
"Capital management, discipline, and consistency in your trading edge."
A positive risk-to-reward ratio, paired with a high win rate, is the backbone of any solid trading plan 📈🔐
⚠️ Losses?
They’re part of the mathematical game of trading 🎲
They don’t define you — they’re necessary, they happen, and we move forward 📊➡️
🙏 I appreciate you taking the time to review my Daily Forecast.
Stay sharp, stay consistent, and protect your capital
— FRNGT 🚀
TVC:DXY

DXY FRGNT Daily Forecast -Q4 | W43 | D2| Y25 |
📅 Q4 | W43 | D2| Y25 |
📊 DXY FRGNT Daily Forecast
🔍 Analysis Approach:
I’m applying Smart Money Concepts, focusing on:
Identifying Points of Interest on the Higher Time Frames (HTFs) 🕰️
Using those POIs to define a clear trading range 📐
Refining those zones on Lower Time Frames (LTFs) 🔎
Waiting for a Break of Structure (BoS) for confirmation ✅
This method allows me to stay precise, disciplined, and aligned with the market narrative, rather than chasing price.
💡 My Motto:
"Capital management, discipline, and consistency in your trading edge."
A positive risk-to-reward ratio, paired with a high win rate, is the backbone of any solid trading plan 📈🔐
⚠️ Losses?
They’re part of the mathematical game of trading 🎲
They don’t define you — they’re necessary, they happen, and we move forward 📊➡️
🙏 I appreciate you taking the time to review my Daily Forecast.
Stay sharp, stay consistent, and protect your capital
— FRNGT 🚀
TVC:DXY

DXYU.S Dollar Index
- Bullish Channel as an corrective pattern in Short Time Frame
- Break of Structure
- Completed " 12345 " Impulsive Waves and " A " Corrective Waves
- RSI - Divergence
- Order Block


DXY Daily Outlook: Bearish Pressure BuildsLooking at the DXY (US Dollar Index) chart as of September 30, 2025, the long-term structure is clearly in a descending wedge pattern, showing sustained weakness since the sharp rejection from the 100.23 level earlier this year. Price action has been consistently making lower highs and lower lows, respecting the upper and lower trendline resistance and support. Currently, DXY is trading around 97.80, slightly above the mid-support zone, but momentum suggests that bears remain in control.
The chart also highlights multiple Change of Character (ChoCH) and Break of Structure (BOS) points, showing failed attempts by bulls to reverse the trend. Each rally has been capped below descending resistance, most recently around the 98–99 zone, which is now acting as a supply area. The ongoing compression in price suggests a possible breakout direction soon.
From a Fibonacci perspective, the major retracement levels drawn from the swing high (100.23) to the swing low (96.18) give clear downside targets. If the wedge breaks bearish, first support lies near 96.18, followed by Fib -0.382 (94.63), then deeper at -0.618 (93.67). A strong bearish continuation could extend toward the -1.618 projection (89.62), which aligns with long-term demand.
On the other side, if bulls manage to reclaim 98.50–99.00 with strong volume, it could trigger a corrective leg toward 100.23 (previous high and wedge resistance). However, given repeated rejections, this remains the less likely scenario unless macro fundamentals (such as Fed policy or global risk sentiment) strongly shift in favor of the dollar.
The RSI/Momentum structure would likely be neutral-to-bearish given the flat but declining structure. The price remains below the major moving averages (200-day SMA/EMA), adding weight to the bearish bias.
Momentum / indicators
Momentum on the daily appears neutral-to-bearish (rallies are weaker and get rejected).
RSI on daily (if checked) is likely flat-to-slightly below neutral, not showing strong bullish divergence — therefore rallies are corrective.
Price is trading under the major moving averages on the daily (200MA acts as dynamic resistance), reinforcing the bearish bias unless reclaimed decisively.
Key daily levels
Immediate resistance / supply: 98.00 – 99.00 (daily rejection zone).
Invalidation for bearish view (daily close basis): daily close above 100.23 / decisive break and hold above 100.5–101 would flip bias.
Near-term support: 96.18 (first target / pivot).
Secondary targets if 96.18 breaks: 94.63, 93.67 then 89.62 as extended target on a strong bearish continuation.
Price-action scenarios
Bearish continuation (favored): Price respects the upper descending trendline, forms a daily rejection or bearish engulfing at ~98.0–99.0 → short with first target at 96.18, partial take at 94.63 if momentum continues.
Neutral / consolidation: Price oscillates 97–98.5, chopping in wedge — wait for a daily close below 96.60 or above 99.50 before taking directional trade.
Bullish breakout (less likely): Daily close above 100.23 with follow-through and volume would signal trend change toward 102+ — invalidate shorts and look for long setups only after retest.
In Summary
Trend: Bearish within a descending wedge.
Resistance: 98.50 → 99.00 → 100.23.
Support: 96.18 → 94.63 → 93.67 → 89.62.
Long-term bias: As long as 99–100 zone is not broken decisively, DXY is likely to head lower toward 94–90 levels in coming months.
Risk factor: Only a macro-driven breakout above 100.23 would invalidate the bearish outlook and shift momentum toward 102+.
One-line Conclusion
Daily bias = bearish while price stays under the 98–100 supply zone; preferred approach is to short on daily rejections or after a break+retest of 96.18, with extended targets at 94.6 → 93.7 → 89.6, and clear invalidation only on a daily close above ~100.23.
Note
Please risk management in trading is a Key so use your money accordingly. If you like the idea then please like and boost. Thank you and Good Luck!

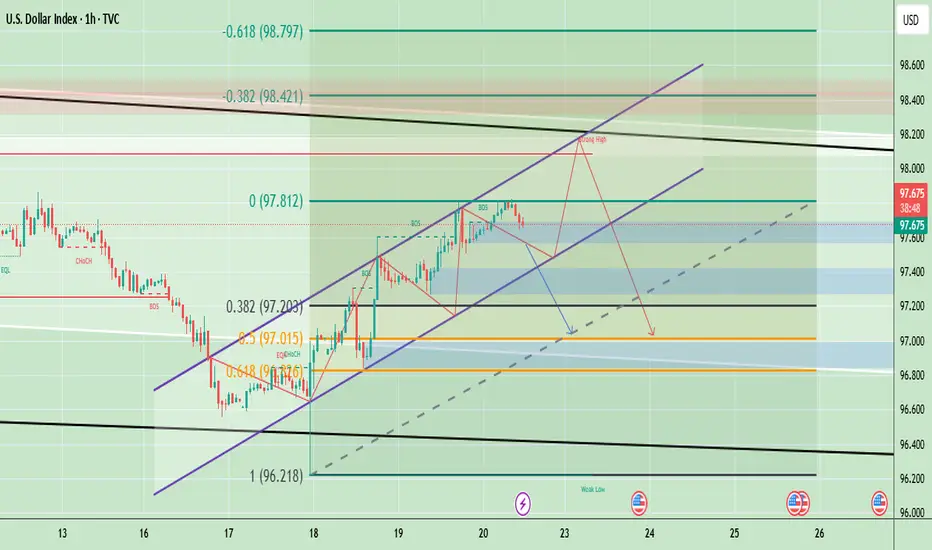
Dollar Index Resistance & Support AnalysisDXY (U.S. Dollar Index) is trading around 97.71, holding within an upward channel after bouncing from the 97.00–97.10 support zone. The structure shows a series of higher highs and higher lows, indicating short-term bullish momentum. However, the chart also highlights a potential “strong high” area near 98.20–98.40, where resistance from both Fibonacci retracement levels and channel tops converge. If DXY fails to break above this resistance, a retracement toward 97.20–97.00 is likely, with further downside risk toward 96.80 if that support breaks.
Based on the current setup, short-term upside toward 98.20–98.40 is possible, but overall bias suggests a likely pullback (downside) after testing resistance, especially if momentum weakens near the channel top.
🔴 Sell Zone (Short Setup)
- Sell Zone (Resistance area): 98.20 – 98.40
- Sell Trigger: If price tests and rejects this zone with bearish candles (reversal signals).
🟢 Buy Zone (Long Setup)
- Buy Zone (Support area): 97.20 – 97.30
- Buy Trigger: If price holds above this zone and shows bullish reversal candles (hammer, engulfing, etc.).
Note
Please risk management in trading is a Key so use your money accordingly. If you like the idea then please like and boost. Thank you and Good Luck!
US Dollar Index - Looking To Sell Pullbacks In The Short TermM15 - Strong bearish move.
No opposite signs.
Currently it looks like a pullback is happening.
Expecting bearish continuation until the two Fibonacci resistance zones hold.
If you enjoy this idea, don’t forget to LIKE 👍, FOLLOW ✅, SHARE 🙌, and COMMENT ✍! Drop your thoughts and charts below to keep the discussion going. Your support helps keep this content free and reach more people! 🚀
-------------------------------------------------------------------------------------------------------------------

USD Index Technical Outlook – Key Buy & Sell LevelsThe U.S. Dollar Index (DXY) is currently trading inside a clear downward channel, showing a bearish market structure. Price is hovering near 98.23, just below the key resistance zone between 98.5 – 99.2, where Fibonacci retracement levels (0.382, 0.5, and 0.618) also align, making it a strong supply area. As long as price remains below this zone, the bias stays bearish, with potential downside targets at 97.5 and then 96.5, in line with the channel support and Fibonacci extensions. However, if buyers manage to push above 99.2, it would signal a possible trend reversal and shift the outlook towards bullish continuation. Overall, the structure suggests that the U.S. Dollar Index is more likely to face rejection near resistance and continue lower in the short term.
🔴 Sell Zone (Short Setup)
- 98.50 – 99.20 is a strong resistance area where price aligns with the Fibonacci retracement (0.382 – 0.618) and the upper channel trendline.
- Sell Trigger: If price shows rejection (bearish candles, wicks, or reversal patterns) within this zone.
🟢 Buy Zone (Long Setup)
- 97.50 – 96.50 area is the channel support and also near Fibonacci extension levels.
- Buy Trigger: Look for bullish confirmation (bounce, bullish engulfing, or rejection wicks).
Note
Please risk management in trading is a Key so use your money accordingly. If you like the idea then please like and boost. Thank you and Good Luck!

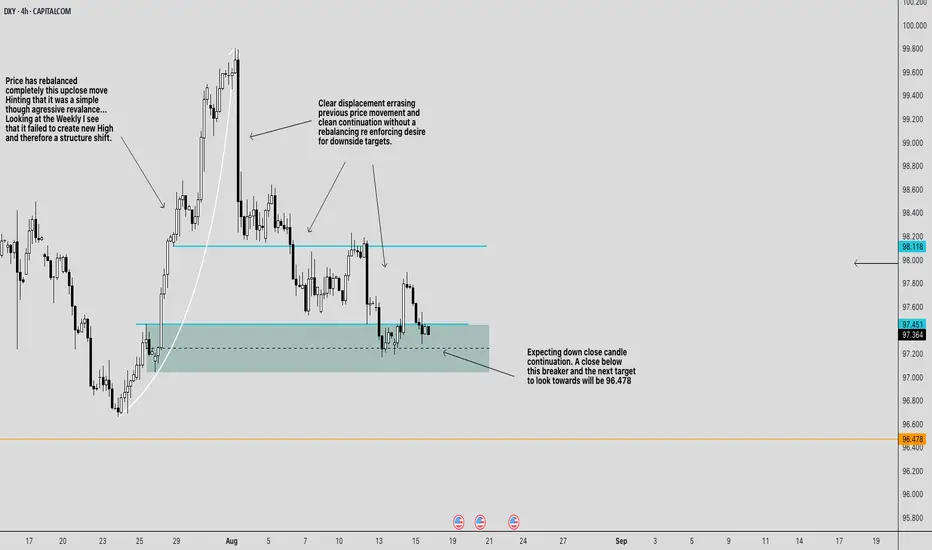
BEARISH CONTINUATION FOR DXYBearish Bias for CAPITALCOM:DXY
Weekly context:
The last up-move failed to print a new weekly high. Failing to create a shift in structure , so rallies are suspect.
4H structure:
We had a hard bearish displacement (large down candles) that erased prior price action and kept going without delivering a “full” rebalance. That usually means the price target remains lower .
The key zones on chart
Breaker / sell zone: \~ 97.45–97.75 (teal box). This is the prior bullish OB that failed (now acting as resistance).
Line in the sand: \~ 97.35–97.40 (dashed line through the teal). A decisive 4H close below here signals continuation.
Upside cap / invalidation area: 98.12 (cyan line) up to \~ 98.20 . Above this, the bearish sentiment weakens.
Primary downside draw: 96.478 (orange line). That’s the next obvious liquidity/inefficiency magnet on your chart.
Trade plan
Idea A — Rejection short from the breaker (preferred):
Entry: look for a rejection setup inside 97.45–97.75 (e.g., 15m/1h bearish shift after a sweep).
Stop: above the breaker and the cyan line ⇒ 98.12 (conservative) or 98.20 (safer).
Targets:
T1: 96.84 (take partials; pay yourself)
T2: 96.47.00
Idea B — Continuation after the break (confirmation play):
Trigger: a 4H close below \~97.35 .
Entry: sell the first clean pullback into 97.35–97.45 .
Stop: above 97.85–98.00 (back inside the breaker); conservative stop 98.12 .
Target: 96.478
Management & invalidation
If price rebalances deeper and closes 4H above 98.12–98.20 , the breaker is failing. Flatten shorts; reassess (potential squeeze toward 98.60–99.00 is then on deck).
If price hesitates at 97.00 , trail above the last 1H swing high to protect realized PnL while aiming for 96.478 .
News risk: Your chart flags upcoming US data (icons). Expect wicks; use hard stops and consider sizing down around releases.
Why this makes sense
* The strong displacement leg sets the draw lower.
* The teal box is a bearish breaker created by a failed bullish structure—ideal for “sell on rally.”
* The market rebalanced the prior up-close leg already; the lack of a symmetrical rebalance on the down-leg favors continuation to the next target ( 96.478 ).
One-liner: Bearish while 4H stays under 98.12 ; sell rallies into 97.45–97.75 or sell a 4H close-and-pullback below 97.35 ; scale out 97.20 → 97.00 → 96.80 → 96.478 ; hard stop above 98.12–98.20 .
*Not financial advice. Size appropriately and stick to your stop.*
PLEASE PUA!
DXY ready to resume downtrend!97.94 Level on DXY is a high liquidity zone as in the falling market there is bounce off to 97.937. Price grabbed liquidity and started to drop again to the major direction of the trend. As it is a long term down trend and price just rejected from a high liquidity zone, it is a high probability price may continue to drop to this support level as multiple timeframe trend is bearish.

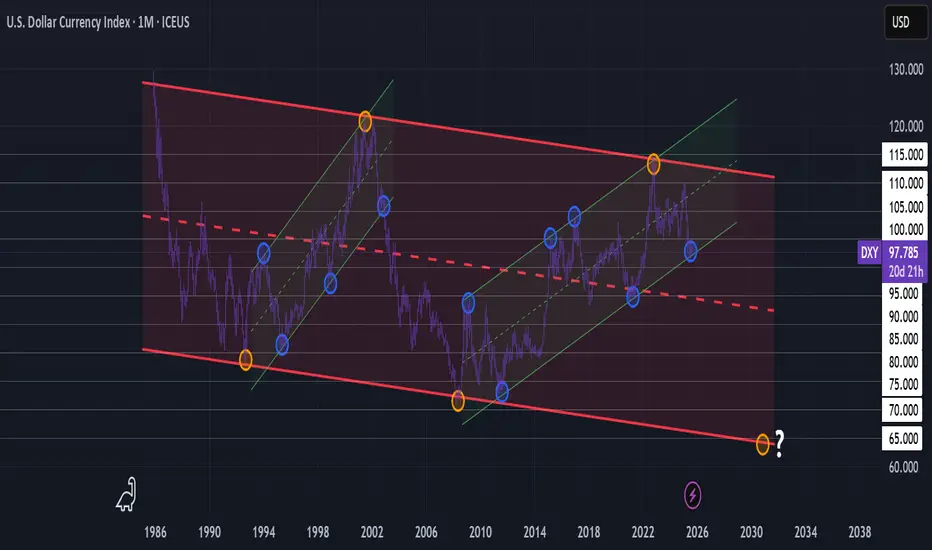
Implausible until it's not? Zoom out $DXY.On the high time frames, the dollar is trading inside a long-term descending channel that dates back decades. The rally into a rising channel has been previously followed by a decline 2002-2008. The most recent rejection from the channel’s upper trend in 2022–2023 suggests that momentum could shift toward the downside, with our next macro target lying near the bottom of the range. We've already broken below our major whole of 1.00 and retested.
Recent NFP data shows a cooling labor market. Slowing job growth and downward revisions might point to a break in momentum. A softer labor market reduces the Fed’s ability to maintain higher rates, undermining DXY strength. Beyond employment, consumer spending is showing cracks while business investment is being pressured by higher borrowing costs. If growth becomes stagnant, the immediate appeal of the economy could weaken, reducing foreign capital that support the dollar. Other factors may include tariffs, policy shifts, or deficits.
When both macro fundamentals and technical structure align, the case for a dollar decline strengthens. While near-term volatility is always expected around Fed shifts and global risk, the high-time-frame view points to the possibility of a downtrend that could extend into the months or possibly years to come.
Eyes peeled for an inverse crypto-winter.
Gbpusd long ideaprevious ideas went extremely well and were very quick!
We have seen PDL and Asia sell-side taken during London then followed by a reversal.
I would like to see a bullish follow through going at least mid range.
Let see how that goes!

DXY Intraday Overview- US Dollar Index (DXY) breached the symmetrical triangle downwards and sustained downwards.
- It indicates that sellers are still strong, hence the structure remains downwards.
🔽 If the immediate support level of 97.80 (fib level 0.786) is broken again, then the price will continue its fall to the next support zone between 97.56 - 97.50
🔼 However, if the price manages to recover and break through the resistance level of 97.90, we can expect a further rise to the level of 98.00.

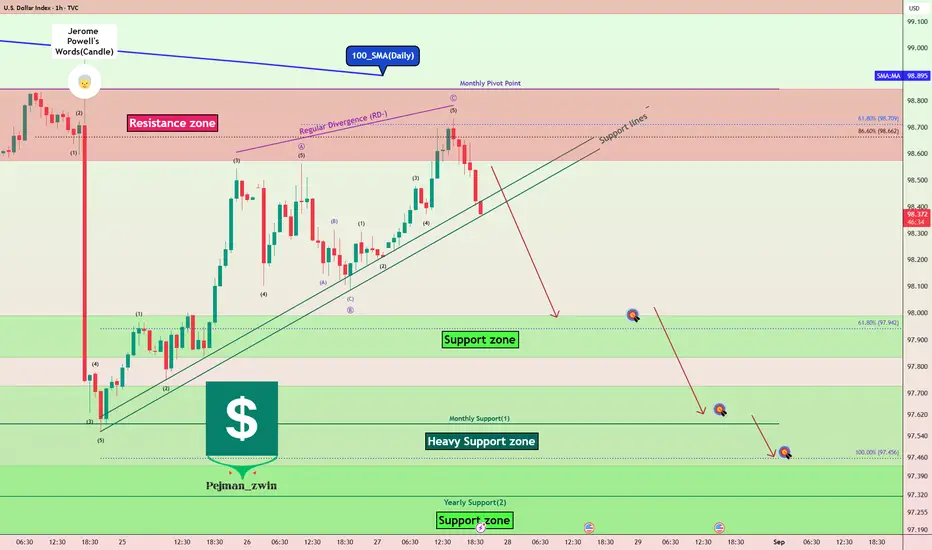
DXY Analysis: Resistances Holding Strong, Is the Downtrend Back?Today, I want to analyze one of the important indices of the financial markets , the U.S. Dollar Index ( TVC:DXY ), for you, which can be a guide for taking short-long positions in the Forex , Futures , and even Crypto markets.
The DXY index fell by about -1.2% after Jerome Powell began talking about the possibility of a rate cut in September , but as the new week began, the DXY index started to rise again.
If we look at the DXY Index chart on the 1-hour time frame , we can see that the DXY Index reacted well to the Resistances and started to decline.
The Resistances for the DXY Index include:
Resistance zone($98.843-$98.575)
Monthly Pivot Point
100_SMA(Daily)
In terms of Elliott Wave theory , it seems that this increase in the DXY Index over the last two days has been in the form of corrective waves . The structure of the corrective waves is Zigzag Correction(ABC/5-3-5). By breaking the Support lines , we can confirm the end of the corrective waves .
Also, we can see the Regular Divergence(RD-) between Consecutive Peaks .
I expect the DXY Index to decline to at least the Support zone($97.989-$97.834) AFTER breaking the Support lines .
Second Target: $97.650
Third Target: $97.450
Stop Loss(SL): $99.000
Note: With the DXY Index declining, we can expect more hope for a weakening of the U.S Dollar's strength in the major Forex pairs .
Please respect each other's ideas and express them politely if you agree or disagree.
U.S. Dollar Index Analyze (DXYUSD), 1-hour time frame.
Be sure to follow the updated ideas.
Do not forget to put a Stop loss for your positions (For every position you want to open).
Please follow your strategy and updates; this is just my Idea, and I will gladly see your ideas in this post.
Please do not forget the ✅' like '✅ button 🙏😊 & Share it with your friends; thanks, and Trade safe.
Gbpusd long idea Related to a previous idea.
Looks like we could have a mid-week reversal after taking sell-side as expected. Let's see what happens next.
Lowest hanging fruit targets internal range buy-side at London swing high.
Previous simulated trade hit target !

Gbpusd lond idea I like that we took London sell-side liquidity and then shifted back into the range. I am bearish dollar until we take at least one weekly low.
Right now i want to see some pullback as depicted and then a run on some buy-side liquidity as depicted and maybe PDH.
This will be another simulated trade setup.

Gbpusd possible long ideaI am looking at what looks like a draw on sell-side liquidity under equal lows during London then a shift thereafter.
I want to see NY pull back into the range between London swing low to current swing high and find support before expanding to at least PDH.
That would be another simulated long setup.

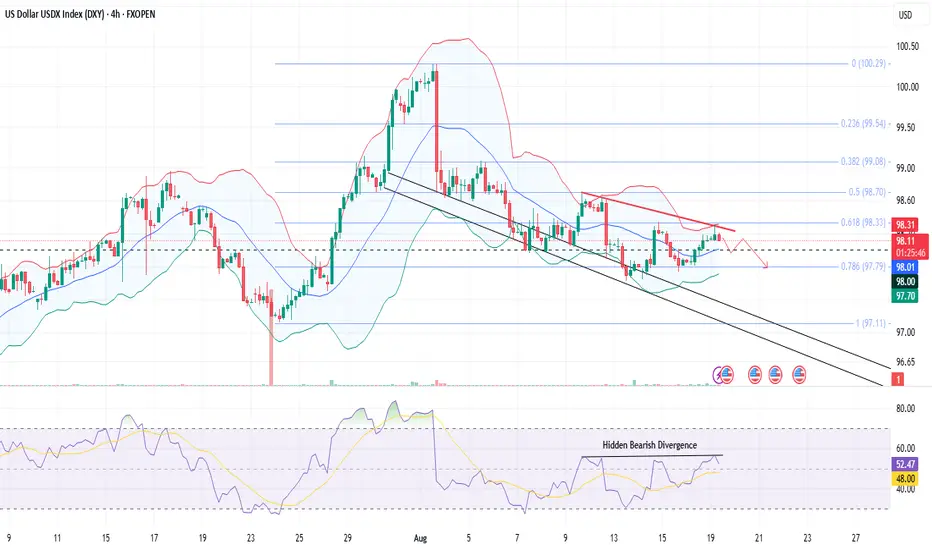
DXY Comprehensive AnalysisThe US Dollar Index (DXY) is currently trading around 98.14, struggling near the 0.618 Fibonacci retracement at 98.33, where strong resistance has capped further upside.
The RSI shows hidden bearish divergence, signaling potential weakness despite the recent bounce.
Price action remains within a broader downtrend channel, and repeated failures to sustain above 98.30 indicate fading bullish momentum.
Immediate support is seen near 98.00, any bearish break out will lead the prices towards 97.79 (Fib 0.786), followed by 97.50, which could attract sellers if broken.
On the upside, only a decisive break above 98.33–98.70 would shift intraday sentiment bullish toward 99.08.
For today, the bias leans bearish as long as DXY trades below 98.30, with intraday traders likely eyeing short setups on rejection patterns targeting the lower supports.
Gold (XAUUSD) Brief Analysis- Gold (XAUUSD) is currently trading around 3350, consolidating within a symmetrical triangle pattern after finding support near the 3330–3338 zone (Fib 0.5 and trendline support).
- The RSI is hovering near 50, showing a balanced momentum, while prices have broken out of the short-term descending trendline, suggesting potential bullish continuation.
- For intraday trading, our bias remains bullish, and a sustained breach above the 3355 Fib 0.382 level could open the path toward 3365 and 3376 resistances.
- On the downside, immediate support lies at 3338, followed by 3328, and only a break below these levels would negate the bullish setup.
- Traders may look for buying opportunities on dips above 3355 with tight stop losses, targeting the upside levels.
