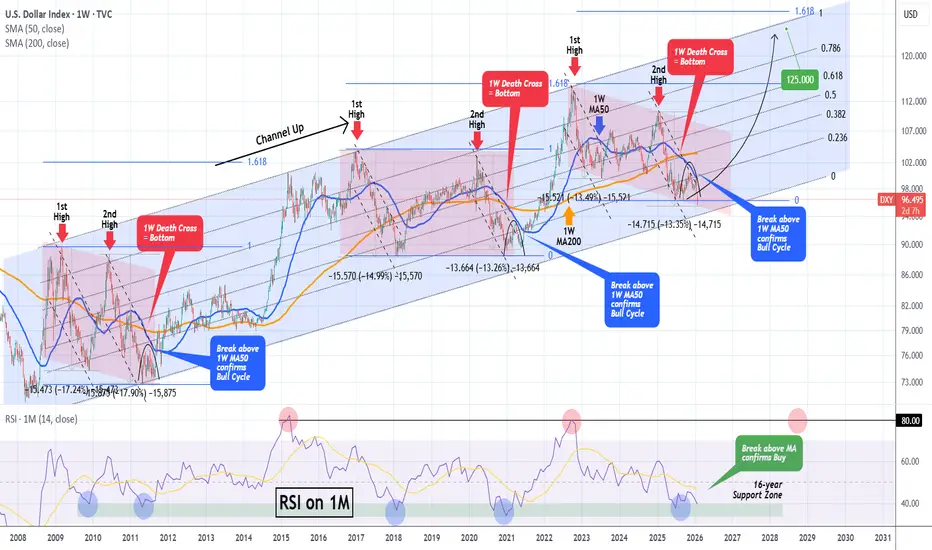
DXY has bottomed and is starting a massive 2-year rallyThe U.S. Dollar index (DXY) has been trading within a Channel Up since the March 2008 bottom during the U.S. Housing Crisis. This is not the first time we use this pattern to identify key macro trend shifts, in fact we revisited it 2 months ago, calling for 'a final pull-back before a massive rally'.
Well the time for this rally is here as yesterday it completed a -13.35% decline from the January 2025 High a year ago.
That decline was technically the Bearish Leg of this pattern's correction phase (red Channel). This is part of its incredible symmetry, with similar correction phases throughout this time period followed by bullish phases, that eventually lead to price rallies to the 1.618 Fibonacci extension.
All conditions for the new Bull Cycle (Bullish Leg) have been fulfilled. Along with the price being at the bottom of the Channel Up, with the -13.35% decline being a benchmark correction historically, we are also past a 1W Death Cross, which has always been a bottom signal on this multi-year Channel Up.
This has always happened at the end of the Bear Cycles (red correction phase) with the Arc pattern making a multi-week Double Bottom before the decisive rebound the breaks above the 1W MA50 (blue trend-line). That break-out is the confirmation of the Bull Cycle start (Bullish Leg).
With the 1M RSI having already touched its 16-year Support Zone, which has provided the most optimal Buy Signals throughout this pattern, we expect the Dollar Index to start rising aggressively in the long-term, targeting the 120.000 - 128.000 Zone on its way to the 1.618 Fib ext, which has been where the previous Higher Highs (Cycle Tops) were priced. 125.000 is a fair Target within a 2-year time-frame.
Notice also that a solid peak indicator (Sell signal) is when the 1M RSI hits 80.00, indicating that the market is massively overbought (overheated trend).
---
** Please LIKE 👍, FOLLOW ✅, SHARE 🙌 and COMMENT ✍ if you enjoy this idea! Also share your ideas and charts in the comments section below! This is best way to keep it relevant, support us, keep the content here free and allow the idea to reach as many people as possible. **
---
💸💸💸💸💸💸
👇 👇 👇 👇 👇 👇
Dxysignals
U.S Dollar IndexDXY
- Bearish Channel as an corrective pattern in Long Time Frame
- Break of Structure
- RSI - Divergence
- Completed " 12345 " Impulsive Waves and " ABC " Corrective Waves
- Rising Wedge in Short Time Frame

DXY crossed very important line- is THIS why FED will Hold RatesAs we wait for the expexted Rate freeze decison by the FED on Wednesday, I thought it would be a good time to just remind ourselves of some Historical and yet not very often Mentoned FACTS.
The Principle thing to fully understand is that Rate Cuts DEVALUE the American Doller.
Simply put, The saved Doller returns less than it does when Rates are higher.
As we see from the chart above, Almost every single meaningful round of Rate cuts has led to the $ loosing Value.
The only 2 occasions where that did not happen was in the first 2 rounds after the American Doller got rid of Gold as a Backing in 1971.
The Rate cuts between May 1974 and October 1977 caused an ebb and Flow that ultimetly ended up with the $ worth slightly Less in 1977 than it was in 1974 but it had risen in that Time
And the Cuts in June 1981 to March 1983 did Nothing at all to curb the rise in Value of the $.
This was most likely due to the beginnings of Henrey Kissengers "Petro Doller".
But ever since then, as you can see on the Chart above, Rates FELL everytime Interest rates were Cut.
Infact, if you look, you will notice that from the point were Nikon anexed the $ from Gold,in 1971, there has only been ONE occasion where the $ has had the same value, or more, than it did that day.
Over all, the $ has LOST value, as the falling Trend line shows.
Note the Horizontal Dotted line that the $ bounced off over on the left side of the chart. The Base line.
In September 2006, the $ fell Below that line. and it continued falling untill, in 2008, the BANKS called it a day, Crashed the Markets, Wiped the slates clean, borrowed money off governments that it had once lent to and started again.
The Success of this move is seen in this chart below.
The Ever rising channel the $ has been in .......Till NOW......
The first round of Rate cuts since entering the rising channel were in 2019 - 2020 and had the effect of bringing the DXY back down to the lower trend line of that rising channel.
We entered the 2nd round of Rate cuts since 2008, in September 2024 and again, we see DXY PA being brought down to the lower trend line.
The problem is, DXY PA JUST FELL OUT OF CHANNEL, it has fallen through this line of support.
Further Rate Cuts would do what they always have down, devalue the $ and push the $ Deeper below this line.
Is the FED the only reason the $ is loosing Value?
NO, The DXY is facing a huge backlash internationaly now.
BRICS being one of the biggest problems.
It is NOT there to Harm the $ , as some suggest. It is the next step in the idea of OPEN MARKETS, were anyone will try and find the best deal.
The Deals in question here are international settlements.
The USD used to be the only available method of international settlement and the USA took commision on every deal, worth $Billions annualy.
BRICS does Not use the $ and so the USA looses money, the $ not required and so, looses Value..
That is a VERY simplaistic explanation....but highlights the headwind the $ is sailing into, amoung many others.
The Job of the FED, a group of independant BANKERS<,,is to protect the $......
A RAISE in rates would earn more money..but Harm industry
To Hold Rates were they are and try and pacify the Fall
Reduce Rates further, make American goods and services cheaper to buy but devalue tie USD<
Is the fact that the USD has fallen out of Channel the real reason the FED will Hold Rates, possinly all year ?
A possible target for the $ longer term is that Horizontal Dotted line that was mentioned earlier.
And in the Meantime..GOLD.....Still winning.
Should the USD jump back obto the GOLD BACKED SYSTEM?

Q1 | W4 | Y26 OK DXY - IS THE SELL OFF OVER ?📅 Q1 | W4 | Y26
OK DXY - IS THE SELL OFF OVER ?
A single weekly bearish candle has engulfed months of prior price action 📉, signalling a decisive shift in higher-timeframe momentum.
With the DXY now showing signs of a momentum melt 🔥, focus naturally turns to whether price is preparing for a corrective retracement into the imbalances and inefficiencies left behind at the highs 🧲.
Within FRGNT Mastery, the DXY is marked and treated as a core framework instrument 🧭 — not for direct trading, but as a directional and timing tool ⏱️ for USD-cross pairs such as GBPUSD, AUDUSD and EURUSD .
By applying the FRGNT interpretation of Smart Money Concepts (SMC) 🧠 — specifically HTF structure shifts, displacement, liquidity draws and imbalance mitigation — we can begin to establish potential points of turnaround 🔄 on the DXY.
Once a DXY reaction or point of inflection is identified 📍, that information becomes a high-probability confluence ✅ for execution on the main pairs. This allows bias, expectation and timing to align 🎯, rather than treating each USD pair in isolation.
Key focus points:
📊 Weekly / Daily DXY structure and imbalance zones
🔍 Confirmation of reaction using FRGNT SMC principles
🔗 Translation of DXY behaviour into bias for GBPUSD, AUDUSD and EURUSD
⚡ Execution only once LTF confirmation aligns with HTF DXY context
Used correctly, the DXY acts as the anchor ⚓ while the USD-cross pairs provide the opportunity — ensuring trades are taken with broader dollar flows, not against them 🚀
📅 Q1 | W4 | Y26
📊 DXY — FRGNT WEEKEND FORECAST
🔍 Analysis Approach
I’m applying a developed version of Smart Money Concepts, with a structured focus on:
• Identifying Key Points of Interest (POIs) on Higher Time Frames (HTFs) 🕰️
• Using those POIs to define a clear and controlled trading range 📐
• Refining those zones on Lower Time Frames (LTFs) 🔎
• Waiting for a Break of Structure (BoS) as confirmation ✅
This process keeps me precise, disciplined, and aligned with market narrative, rather than reacting emotionally or chasing price.
💡 My Motto
“Capital management, discipline, and consistency in your trading edge.”
A positive risk-to-reward ratio, combined with a high-probability execution model, is the backbone of any sustainable trading plan 📈🔐
⚠️ On Losses
Losses are part of the mathematical reality of trading 🎲
They don’t define you — they are necessary, expected, and managed.
We acknowledge them, learn, and move forward 📊➡️
🙏 I appreciate you taking the time to review my Daily Forecast.
Further context and supporting material can be found in the Links section.
Stay sharp 🧠
Stay consistent 🎯
Protect your capital 🔐
— FRGNT 🚀📈
TVC:DXY

DXY is about to bounce off manthly support?DXY currently at the montly support level. Past 4 months DXY has created series of higher low, with strong liquidity grab off the support level market may bounce off the level as the price at order block which is a key level of support where in the past price rejected with strong break of structure.
As of Friday, market is highly likely to bounce off the level to retest the montly and weekly high.

Breaking: US Dollar Index (DXY) Extends Cool-OffThe U.S. dollar weakened for a second straight session, with the DXY index edging lower as currency markets reacted to growing geopolitical uncertainty. Traders are starting to pull back from the dollar as a safe haven, choosing to stay cautious ahead of what many describe as a messy global outlook.
This move isn’t about one data point or a single headline. Instead, it reflects a market that is nervous about global politics, conflict risks, and sudden policy shifts. When uncertainty rises like this, forex markets often turn volatile, and that’s exactly what traders are preparing for.
Why the Dollar Is Under Pressure
Part of the pressure on the dollar comes from falling U.S. Treasury yields, which reduce the appeal of holding dollars compared to other currencies. When yields dip, the dollar usually follows, especially if investors are willing to take on more risk elsewhere.
At the same time, some traders are rotating into other major currencies, including the euro and yen, as they wait for a clearer direction. The result is a softer DXY, even though the U.S. economy itself hasn’t shown major weakness.
Technically, the chart depicts a bullish flag pattern a breakout above the flag could resort to a bullish reversal in the long term.

DXYU.S Dollar Index
- Completed " 12345 " Impulsive Waves
- Break of Structure
- Order Block
- Fair Value Gap
- Fibonacci Level - 50.00% / 61.80%

US Dollar Index Outlook | Trend Strength vs Key Resistance💰 DXY (US DOLLAR INDEX) - SWING TRADE OPPORTUNITY 📊
Bullish Momentum Play with WEIGHTED MA Breakout Confirmation
🎯 MARKET CONTEXT
Current Price: 98.53 | Trend: Consolidation Zone (97.00 - 100.00 Range)
Status: Preparing for breakout above Monday highs at 98.85 🚀
After the worst annual performance since 2017 (-9.3% in 2025), the DXY is regaining momentum in early 2026. Bulls are establishing strong demand at critical support levels with both 50-hour and 200-hour moving averages acting as backstops. The technical setup suggests a potential run toward the 99.30-99.50 resistance zone on breakout confirmation.
📈 TECHNICAL SETUP - LAYERING STRATEGY (Thief Entry Method)
Entry Strategy: Multiple Limit Order Layers 🎰
Using the Smart Layering Technique for optimal risk-adjusted positioning:
Layer 1 Entry @ 98.40 💰 Support Zone Entry (33% Position Size)
This is your first buy trigger at the lower support consolidation zone. Activate your first limit buy here to catch early momentum before the main move. This layer catches sellers panicking at support levels. Strong psychological anchor for building position.
Layer 2 Entry @ 98.50 📊 HULL MA Pull-Back Zone (33% Position Size)
Your second layer activates at the HULL moving average pullback confirmation point. This is where momentum traders get shaken out—perfect opportunity to add. Average your cost higher while securing better entry confirmation. This level shows institutional interest.
Layer 3 Entry @ 98.60 🚀 Accumulation Zone (34% Position Size)
Your final layer triggers at the upper consolidation band where accumulation is strongest. By this point, you've built 100% of your position with an average cost significantly lower than a single market order. This creates psychological momentum as you're "buying strength" into the breakout zone.
Pro Tip: You can adjust layer spacing based on volatility. Wider layers = patience for perfect fills. Tighter layers = aggressive accumulation for faster positioning. This method reduces average entry cost while managing drawdowns effectively. Smart traders stack positions like this instead of FOMO market buying. 🎯
Stop Loss (SL): 98.20 🛑
Hard stop at the 4-hour support consolidation level. This represents a breach of the lower Rectangle boundary.
⚠️ Disclaimer: This is MY suggested SL. You maintain complete control over your risk management. Scale your position size accordingly to your personal risk tolerance. Only risk what you can afford to lose completely. This is NOT financial advice—trade at your own risk.
Target Zone (TP): 99.30 - 99.50 🎊
Primary Resistance Level where overbought conditions + trapped short sellers create a natural profit-taking zone. This level aligns with Monday's highs (98.85) and extends toward the 99.30 psychological level.
⚠️ Disclaimer: This is my projected resistance zone based on technical analysis. Market conditions change rapidly. Take partial profits at 99.30 and trail your stop on remaining position. You decide your exit strategy—this is guidance, not a guarantee.
🔗 RELATED PAIRS TO WATCH (Correlation Analysis)
1️⃣ EUR/USD (FX: FX:EURUSD ) 📉
Correlation: NEGATIVE (inverse to DXY)
Current Level: ~1.1716 | Watch: 1.3520-1.3560 range
Key Driver: Euro manufacturing weakness (Dec: 9-month low) supports USD strength
Action: If DXY breaks 99.30, expect EUR/USD to test 1.15 support levels
2️⃣ GBP/USD (FX: FX:GBPUSD ) 💷
Correlation: NEGATIVE (inverse to DXY)
Current Level: ~1.3445 | 2026 Forecast: 1.36-1.40 range expected
Key Driver: BOE cutting rates more gradually than Fed = GBP resilience likely
Action: Sterling strength could limit DXY upside; watch for BOE communications
3️⃣ USD/JPY (FX: FX:USDJPY ) 🇯🇵
Correlation: POSITIVE (moves WITH DXY)
Current Level: ~156.65 | 10-Month Low: 157.89 (Nov 2025)
Key Driver: BOJ Intervention Risk + Rate Hike Expectations
Action: BOJ still holds limited rate hike probability until July—JPY weakness supports USD strength
4️⃣ DXY vs USD/CAD (FX: OANDA:USDCAD ) 🇨🇦
Correlation: MIXED (commodity-sensitive)
Watch Level: Canadian economic data + BoC policy divergence
Key Driver: CAD weakness when risk-off sentiment dominates
Action: Oil prices + BoC dovish stance = support for USD/CAD upside
📰 FUNDAMENTAL & MACRO DRIVERS (Live as of Jan 8, 2026)
🚨 SHORT-TERM CATALYSTS (This Week/Next Week)
✅ US Employment Data (Jobs Report - Jan 10)
Latest: -105K jobs (WORSE than +64K expected)
Impact: Signals economic weakness BUT triggers "safety trade" into USD
Watch: If jobs continue weak → confirms Fed rate cuts → longer-term DXY weakness
Action: Initial dip likely, then reversal higher on safe-haven demand
✅ Fed Rate Cut Expectations - CRITICAL
Market Pricing: 2 x 25bp cuts in 2026 (vs Fed's 1 cut projection)
Fed Communication Risk: Multiple Fed officials saying more dovish stance needed
Richmond Fed President Barkin: Monetary policy requires "finely tuned judgments"
Impact: Rate cut expectations = DXY headwind long-term, but near-term bounces likely
✅ ISM Manufacturing PMI (Already Released)
Dec Data: Sharpest contraction since 2024 | Services PMI also revised lower
Impact: Economic slowdown narrative = negative for USD long-term
But: Safe-haven demand provides near-term support
✅ Geopolitical Risk - Venezuela Situation
Recent: US military action in Venezuela sparked brief safe-haven rally
Current: Concerns eased; initially pushed DXY to 98.80, faded back to 98.50
Watch: Any escalation = temporary USD strength; normalization = weakness
📊 MID-TERM DRIVERS (Next 1-3 Months)
🔴 Federal Reserve Independence Concerns
Timeline: Fed Chair selection happening THIS MONTH (Trump announcement)
Market Fear: New Chair (May 2026) may prioritize rate cuts over inflation control
DXY Impact: Significant structural selling pressure if dovish chair appointed
Watch: Trump's nominee announcement = potential volatility catalyst
🔴 US Inflation Data (CPI Reports)
Status: Core inflation sticky; any surprise UP = DXY support
Risk: If inflation surprises DOWN = accelerates rate cut timeline = DXY weakness
Watch: Jan 15 & Feb 12 CPI releases
💚 US Fiscal Policy Uncertainty
Wildcard: Trade policy, tariffs, government spending debates
Scenario 1: Tariffs trigger inflation → Fed stays hawkish → DXY stronger
Scenario 2: Fiscal stimulus accelerates early 2026 → inflation risk → mixed effects
🌍 INTERNATIONAL FACTORS
🇪🇺 Eurozone Economic Weakness
Factory Activity: 9-month low in December
Support: Lower inflation readings in Germany/France (good news for ECB)
DXY Impact: Euro weakness = relative USD strength support ✅
🇯🇵 Bank of Japan (BOJ) Policy
Current: BOJ raised rates 2x in 2025 but YEN still underperformed
Forward View: Markets pricing <50% chance of BOJ hike until July 2026
DXY Impact: Yen weakness = carry trade pressure = mild USD strength
💡 2026 DXY SCENARIO ANALYSIS
BASE CASE: "V-Shaped" Year
H1 2026: DXY expected to decline toward 94.00 as Fed cuts rates
H2 2026: Rebound above 99.00 as fiscal stimulus drives inflation + yields higher
Current Position (98.53): Setting up for H1 weakness, but near-term bounces likely
BULL CASE (Our Setup) 🚀
Thesis: Consolidation breaks above 99.30 → tests 100.00
Catalyst: Labor data weakness + geopolitical safety bid extension
Resistance: 99.30-99.50, then 100.00 psychological level
Risk: Only viable if jobs report doesn't accelerate rate cut expectations
BEAR CASE 📉
Thesis: Fed cuts rates aggressively → DXY collapses toward 94.00
Catalyst: New dovish Fed Chair + prolonged economic weakness
Support: 97.50-97.00 rectangle lows become prime targets
Timeline: Likely unfolding H1 2026
⚡ KEY TAKEAWAYS FOR TRADERS
1️⃣ Entry: Use the 3-layer method at 98.40 / 98.50 / 98.60—cost-averages your fills
2️⃣ Risk: Hard stop at 98.20; size accordingly to your account
3️⃣ Reward: Target 99.30-99.50 for near-term swing (100-150 pips potential)
4️⃣ Watch: Jobs report (Jan 10) = weekly game-changer | Fed chair news (late Jan) = structural pivot
5️⃣ Correlations: Monitor EUR/USD, GBP/USD, USD/JPY for confirmation of DXY momentum
⚠️ TRADING DISCLAIMER
🚨 This is NOT financial advice. I am NOT a licensed financial advisor or analyst. This setup represents my personal technical + macro analysis framework. Markets are unpredictable. All trades carry RISK OF TOTAL LOSS. You are responsible for:
✅ Your own position sizing
✅ Your own stop loss placement
✅ Your own profit target selection
✅ Conducting independent research before entry
Trade responsibly. Risk what you can afford to lose completely. Accept losses gracefully. Consistency beats perfection. 🎯
Last Updated: January 8, 2026
DXY Real-Time Price: 98.57 | 52-Week Range: 96.22 - 110.18
Good luck, traders! May your entries be clean and your exits cleaner. 💼📈

DXY 📉 TVC:DXY (US Dollar Index) Technical Analysis (4H Timeframe)
The overall trend for the Dollar Index is currently bearish, as the price action is trading below a downward-sloping EMA 200 (black line) and consistently forming lower highs and lower lows 📉. The momentum remains weak, with large bearish candles dominating previous impulsive moves. Currently, the price is in a corrective phase, attempting to test the EMA 50 (red line) and the broken structural zone at 98.680 USD. The EMA 50 is trending below the EMA 200, confirming the bearish pressure in the medium term. If the price fails to break back above the current resistance level with strong candle bodies, we expect a continuation of the downtrend toward the next liquidity targets 📉.
🔑 Key Levels to Watch:
Major Resistance Zone: 99.250 USD (Previous Peak & Grey Box) 🚩
Immediate Pivot Resistance: 98.680 USD (Current Test Area) 💡
First Downside Target: 98.150 USD (Recent Support / Grey Box) 🎯
Secondary Support Level: 97.770 USD (Solid Black Line) ⚡
Primary Demand Origin: 97.300 USD (Major Grey Box) 🛡️
Long-term Resistance: 100.344 USD – 100.800 USD 🏗️

DXYU.S Dollar Index
- Order Block
- Fair Value Gap
- Completed " 12345 " Impulsive Waves and " A " Corrective waves
- Fibonacci Level - 50.00% / 61.80%
- Demand Zone

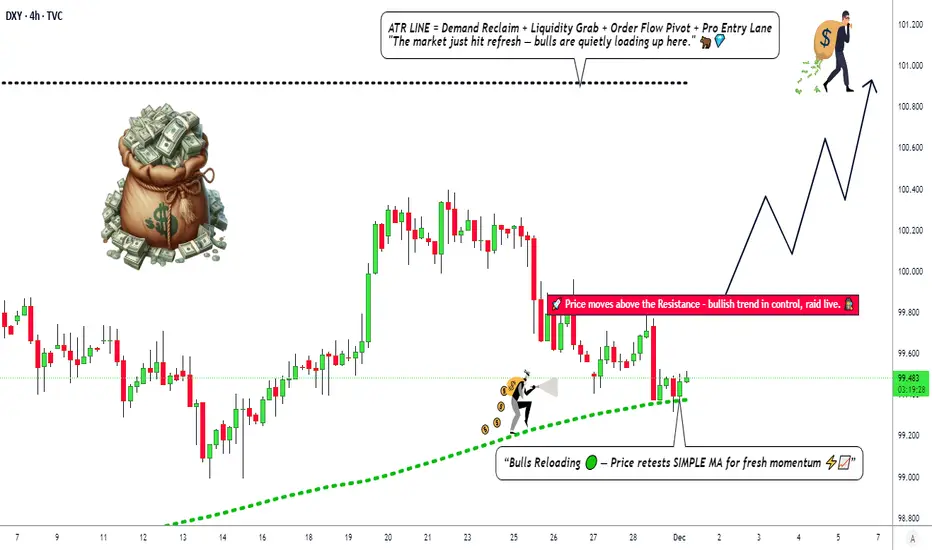
DXY preparing a 2-month rally.The U.S. Dollar index (DXY) has been consolidating within a 6-month Rectangle pattern following the very bearish first half of 2025. As this consolidation Rectangle evolved, the price managed to break above all of its MA Resistance levels in succession: 1D MA50 (blue trend-line), 1D MA100 (green trend-line) and a little more than a month ago, the 1D MA200 (orange trend-line).
This slow process hints towards the formation of a long-term Support base, in preparation for a 2026 Bull Cycle. The first steps of such a process is establishing the conditions for shorter term rallies. And what this chart shows us is that, every time the index made a 1D MACD Bullish Cross, just like the one it completed today, it started an uptrend.
This time, we also have a Double Bottom on the 1D RSI, which also made Higher Highs, being a Bullish Divergence against the price's Lower Highs.
As a result, it may be time for the 6-month Rectangle to break upwards and the first technical Targe is the 0.382 Fibonacci retracement level at 101.550.
---
** Please LIKE 👍, FOLLOW ✅, SHARE 🙌 and COMMENT ✍ if you enjoy this idea! Also share your ideas and charts in the comments section below! This is best way to keep it relevant, support us, keep the content here free and allow the idea to reach as many people as possible. **
---
💸💸💸💸💸💸
👇 👇 👇 👇 👇 👇

DXY Looks BullishDXY Looks Bullish
DXY looks bullish so all risky assets will take correction in coming days/weeks IMO.

DXYU.S Dollar Index
- Bearish Channel as an corrective pattern in Short Time Frame
- Break of Structure
- RSI - Divergence
- Completed " 123 " Impulsive Waves
- Demand Zone

DXY Trade Set Up Dec 16 2025Price has swept SSL and has low range liquidity above which i will expect to be swept before a continuation lower

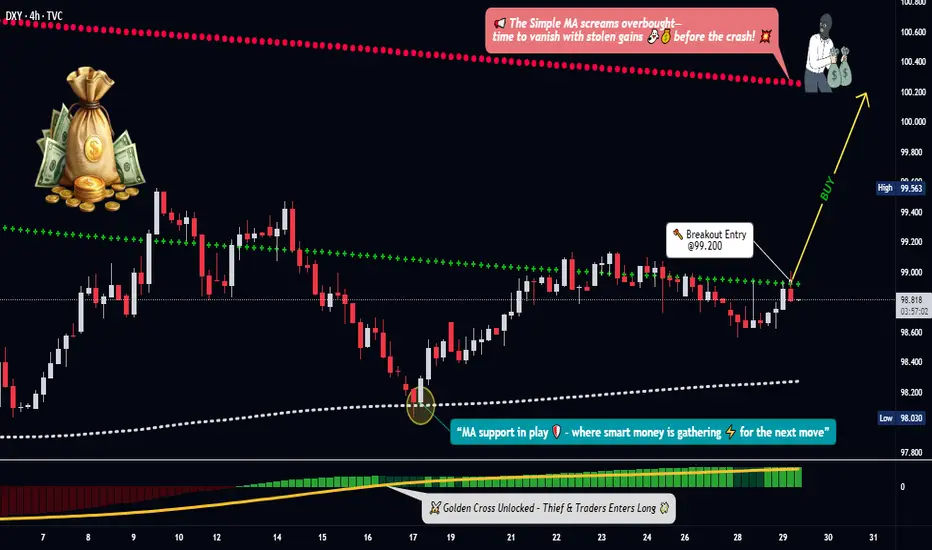
DXY Breakout Map — Is the Dollar Index Ready for a Power Move?🎯 DXY BULLISH BREAKOUT: The "Limit Order Layup" Strategy 🚀
Hey Thief OGs! 👋 The King Dollar 👑 is getting ready for a potential rally, and we've got the map 🗺️ to navigate it. This is a swing/day trade plan focusing on a classic technical setup with a tactical entry twist.
📈 The Overall Plan (Bias): BULLISH 🐂
The strategy waits for a bullish confirmation using a Simple Moving Average (SMA) pullback 🔙 followed by a MACD golden cross ✨. We're buying the dip, expecting a continuation upward 📊.
⚡ The Thief's Entry Tactic (The "Layering Method") 🎁
The key is patience and precision. We don't chase the price.
✅ Wait for the Trigger: Confirm a daily close ABOVE 99.200.
🎯 Deploy Limit Orders: After the breakout, set multiple buy limit orders at key support levels to get a good average entry price.
Suggested Layers: 🟢 98.400, 🟢 98.600, 🟢 98.800, 🟢 99.000
💡 Pro Tip: You can adjust the number of layers and levels based on your own risk appetite!
🛡️ Risk Management (The Escape Plan) 🚨
Stop Loss (SL): A hard stop is placed at 98.200. This level is the line in the sand – if price breaks below here, our thesis is likely invalid ❌.
⚠️ Note: Dear Ladies & Gentleman (Thief OGs), I do not recommend you set only my SL. It is your own choice. You can make money, then take money at your own risk.
🎯 Profit Targets (The Getaway) 💰
Take Profit (TP): We are targeting 100.200. This zone aligns with where the Moving Average may act as strong resistance, and the market could become overbought. When the trap is set, we escape with profits! 🏃♂️💨
⚠️ Note: Dear Ladies & Gentleman (Thief OGs), I am not recommending you set only my TP. It is your own choice. You can make money, then take money at your own risk.
🔍 Related Pairs to Watch & Key Correlations 🌐
The DXY doesn't move in a vacuum. Keep an eye on these:
EUR/USD ( FX:EURUSD ): 👑 The inverse king. A rising DXY typically means a falling EUR/USD 📉.
GBP/USD ( FX:GBPUSD ): Similar to the Euro, a strong dollar often pressures Cable downward 📉.
Gold ( OANDA:XAUUSD ): 🪙 Gold is priced in USD. A stronger dollar can make gold more expensive for other currencies, often putting downward pressure on it 📉.
USD/JPY ( FX:USDJPY ): A strong dollar trend usually powers USD/JPY higher 📈.
Key Point: If our DXY bullish idea is correct, you should generally see EUR/USD and GBP/USD weakening 📉, and USD/JPY strengthening 📈.
✨ “If you find value in my analysis, a 👍 and 🚀 boost is much appreciated — it helps me share more setups with the community!”
#DXY #TradingSetup #SwingTrading #Forex #DollarIndex #TradingStrategy #MACD #TechnicalAnalysis #LimitOrder
DXY Trade Set Up Dec 12 2025Price is overall in a strong bearish trend which i expect to continue after filling 4h FVG and/or tapping into supply to continue to lower SSL

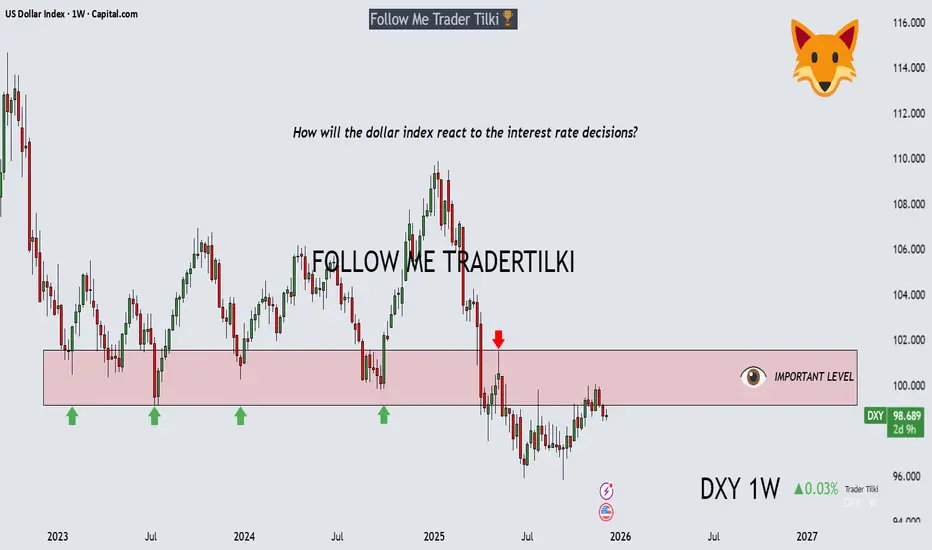
Interest Rate Decision and DXY – 1-Week - Tradertilki AnalysisMy friends,
Today, the most important fundamental news from the U.S. will be the interest rate decision.
This data will determine the direction of both gold and cryptocurrencies.
If there is an interest rate cut, gold and bitcoin will rise; if there is a rate hike, gold and bitcoin will fall.
Before approaching other trades today, I believe it is beneficial to wait for this important news release.
If DXY manages to break above the 101,550 – 99,143 levels, the first level it will want to test is 103,360.
My friends, I share these analyses thanks to each like I receive from you.
Your likes increase my motivation and encourage me to support you in this way.🙏✨
Thank you to all my friends who support me with their likes.❤️
DXYU.S Dollar Index
- Rising Wedge as an corrective pattern in Long Time Frame
- Order Block
- Fibonacci Level - 50.00% / 61.80%
- Demand Zone
- Completed " 1234 " Impulsive Waves

DXY Bullish Outlook | SMA Pullback + Breakout Confirmation🚀 DXY BULLISH SWING SETUP: SMA PULLBACK CONFIRMED! | Key Levels & Correlated Pairs 📈
🎯 Trade Idea: Bullish Swing on DXY (US Dollar Index)
📊 Asset: TVC:DXY | Timeframe: 4H & Daily
🔥 Strategy: Simple Moving Average Pullback + Resistance Breakout Confirmation
⚡ ENTRY PLAN:
Trigger: Break & close above 99.900 resistance
Ideal Entry: Any pullback toward 99.700-99.850 after breakout
Confirmation: Price holding above SMA support (adjust to your preferred period)
🛑 STOP LOSS (RISK MANAGEMENT):
Reference level: 99.300
👑 Dear Trading Family (Thief OGs) – This is MY protective stop. PLEASE adjust based on YOUR risk tolerance and strategy. I am not responsible for your SL/TP decisions. Manage your own risk!
✅ TAKE PROFIT TARGETS:
Primary TP: 100.900 (Strong confluence: SuperTrend ATR resistance + overbought zone potential trap)
Partial take profits advised along the way
🧠 Reminder: You can take money at YOUR own discretion. Not financial advice!
📈 RELATED PAIRS TO WATCH & CORRELATIONS:
FX:EURUSD – Inversely correlated (~57.6% weight in DXY). DXY up = EURUSD down.
FX:GBPUSD – Negative correlation. Strong dollar pushes GBPUSD lower.
FX:USDJPY – Positive correlation. DXY bullish = USDJPY often rises.
OANDA:XAUUSD (Gold) – Typically inverse to dollar strength.
TVC:USOIL (Crude) – Dollar up can pressure oil prices (denominated in USD).
🔍 KEY POINTS:
Watch for USD strength across majors to confirm DXY momentum
If DXY rallies, expect EURUSD & GBPUSD to show sell setups
Always correlate with Fed policy expectations & US economic data
📌 DISCLAIMER:
This is my personal analysis, not financial advice. Trade at your own risk. You are responsible for your own decisions.
Let’s get this bread! 🍞 If you find this helpful, drop a like 👍, follow for more ideas, and share your thoughts in the comments!
#DXY #USDollar #TradingSetup #SwingTrading #ForexTrading #MarketAnalysis #TradingView #FX #RiskManagement #ThiefOGs
U.S. Dollar Index Gearing Up for a Powerful Upswing!💵 DXY — U.S. Dollar Index | Profit Pathway Setup (Swing Trade)
🧭 Bias: Bullish (Confirmed Setup)
📈 Market Type: Index (USD Strength Focus)
🧠 Strategy Style: Layered Limit Entry with SMA Pullback + Triangular MA Breakout
🎯 Trade Plan Breakdown
📊 Setup Insight:
The DXY (U.S. Dollar Index) has confirmed a bullish momentum as price reclaims above the Simple Moving Average (SMA) and breaks through the Triangular Moving Average (TMA) resistance zone — signaling potential continuation strength for the dollar.
📥 Entry Zone (Layering Strategy):
My “Thief Strategy” approach uses multiple limit layers for precision stacking entries:
Buy Limit Layers: 99.00 → 99.50 → 100.00
(You can extend or adjust layers based on your own conviction and risk appetite.)
🛑 Stop Loss:
My Thief SL sits near the recent lower low wick for structure protection → 98.50
💬 Note: Dear Ladies & Gentlemen (Thief OG’s) — I’m not recommending my exact SL.
You manage your own risk — make money, take money, your call.
🎯 Target (Take Profit):
The moving average line is acting like a police barricade — strong resistance area, potential overbought trap zone. Be smart and escape with profits near 102.00.
💬 Note: Dear Ladies & Gentlemen (Thief OG’s) — TP is flexible.
Lock profits where you’re satisfied; don’t let greed arrest your gains. 🚓💰
🌐 Correlated Market Watch
Keep an eye on these correlated pairs & assets for confirmation signals or divergence clues:
💶 $EUR/USD → Inverse correlation (DXY up → EUR/USD down)
$XAU/USD (Gold) → Often moves opposite to USD strength
💷 FX:GBPUSD → Mirrors EUR/USD volatility when DXY surges
BITSTAMP:BTCUSD → Weakens when DXY strengthens due to liquidity shifts
💹 FX:USDJPY → Supports bullish dollar narrative if yield spreads widen
These pairs can help you validate sentiment and timing entries better — especially during London & New York sessions when DXY liquidity peaks.
🧩 Technical Key Points
✅ SMA pullback confirms bullish continuation zone
🔺 Triangular Moving Average breakout shows renewed strength
🧱 99.00–100.00 acts as accumulation floor
🚨 102.00 remains resistance barricade zone (potential trap)
⏰ Best observed during London/NY overlap for volatility cues
✨ “If you find value in my analysis, a 👍 and 🚀 boost is much appreciated — it helps me share more setups with the community!”
⚠️ Disclaimer: This is a Thief-style trading strategy — just for fun and education. Not financial advice. Trade wisely and manage risk like a pro.
#DXY #USDollarIndex #ForexTrading #SwingTrade #TechnicalAnalysis #TradingIdeas #PriceAction #SMAStrategy #MovingAverages #CurrencyTrading #DollarStrength #ForexSignals #TradingStrategy #MarketAnalysis #ChartPatterns #BullishSetup #RiskManagement #ForexCommunity #TradingView #DXYAnalysis

DXY is making perhaps the final pull-back before a massive rallyThe U.S. Dollar index (DXY) has been trading within a Channel Up since the March 2008 bottom during the U.S. Housing Crisis. This is not the first time we use this pattern to identify key macro trend shifts, in fact we revisited it a little over 2 months ago.
The incredible symmetry it's been showing, with clear correction phases (red Channels) followed by bullish phases, eventually lead to price rallies to the 1.618 Fibonacci extension.
Right now the price is past a 1W Death Cross, which has always been a bottom signal on this multi-year Channel Up, and is pulling back on perhaps the final mini drop before the new 2-year Bullish Leg begins.
This has always happened at the end of the Bear Cycles (red correction phase) with the Arc pattern showing a final pull-back before the decisive rebound the breaks above the 1W MA50 (blue trend-line). That break-out is the confirmation of the Bull Cycle start (Bullish Leg).
With the 1M RSI having already touched its 16-year Support Zone, which has provided the most optimal Buy Signals throughout this pattern, we expect the Dollar Index to start rising aggressively in the long-term, targeting the 120.000 - 128.000 Zone on its way to the 1.618 Fib ext, which has been where the previous Higher Highs (Cycle Tops) were priced.
Notice also that a solid peak indicator (Sell signal) is when the 1M RSI hits 80.00, indicating that the market is massively overbought (overheated trend).
---
** Please LIKE 👍, FOLLOW ✅, SHARE 🙌 and COMMENT ✍ if you enjoy this idea! Also share your ideas and charts in the comments section below! This is best way to keep it relevant, support us, keep the content here free and allow the idea to reach as many people as possible. **
---
💸💸💸💸💸💸
👇 👇 👇 👇 👇 👇

DXYU.S Dollar Index
- Buy Side Liquidity
- Break of Structure
- Completed " 12345 " Impulsive Waves
- Change of Characteristics
- RSI - Divergence

What should we expect from DXY Index by the end of 2023❗️❓🗺️👋Hi everyone (Reading time less than 3 minutes⏰) .
📚One of the most important Indices that we should have an analysis of is the DXY index because it has a direct impact on the Forex , Cryptocurrency , and stock and etc markets. So, in this post, I'm going to show you the 🗺️ Roadmap 🗺️ for DXY until at least the End of 2023 and Early 2024 .
💡I used the Monthly time frame and Elliott wave theory to display the DXY index roadmap better.
💡First of all, it is better to know that the DXY index has formed an Ascending Channel since 2008 and is moving in it.
🌊According to the theory of Elliott waves , the DXY index has succeeded in completing its 5 impulsive waves in the ascending channel so that the 3rd wave was an extended wave .
🌊As a result, it seems that Corrective waves have started, and to confirm this, it is better to wait for the break of the lower line of the ascending channel.
🔔I expect the DXY to move between 🔴Heavy Resistance zone($107.62-$103.10)🔴 and 🟢Support zone($101.64-$99.58)🟢 by the end of 2023 and early 2024, and in mid-2024 , the DXY will begin to trend Down , and Financial markets will likely turn 🚀Green🚀 .
DXY Index Analyze ( DXYUSD ), Monthly time frame ⏰.
Do not forget to put Stop loss for your positions (For every position you want to open).
Please follow your strategy; this is just my Idea, and I will be glad to see your ideas in this post.
Please do not forget the ✅' like '✅ button 🙏😊 & Share it with your friends; thanks, and Trade safe.
