DXY – The Road to 100 Looks ClearIn my previous analysis on DXY, I mentioned that as long as the 97.60 zone holds, there are strong chances for an upside move and a possible test of the 100 level.
Indeed, the index reversed perfectly from that support area and has now broken above the interim resistance around 98.60, trading close to 99 at the time of writing.
Over the last three sessions, DXY has also completed an inverted Head & Shoulders pattern, with the neckline breakout confirming the bullish structure.
From here, the path toward the 100 zone appears clear and technically justified.
I maintain a bullish bias for the U.S. Dollar Index, which naturally implies a bearish outlook for EURUSD and GBPUSD in the short term.
Dxysignals

DXY nfp again breaking the support?Hello traders, this is a complete multiple timeframe analysis of this pair. We see could find significant trading opportunities as per analysis upon price action confirmation we may take this trade. Smash the like button if you find value in this analysis and drop a comment if you have any questions or let me know which pair to cover in my next analysis.

DXY Strategy Unlocked — Will Bulls Control the Next Swing?⚡ US Dollar Index (DXY) Swing/Day Trade Setup ⚡
💹 Asset: DXY (US Dollar Index)
📈 Plan: Bullish — Pending Order Strategy
📊 US Dollar Index (DXY) Real-Time Data
Daily Change: +0.55 (+0.56%)
Day's Range: 97.62 – 98.60
52-Week Range: 96.38 – 110.18
🔔 Trade Setup (Thief Plan)
Breakout Entry: 98.800 ⚡ (Set TradingView alarm to catch the move in real time)
Stop Loss: “Thief SL” @ 24,000.0 (only after breakout confirmation).
📝 Adjust your SL based on your strategy & risk appetite, Ladies & Gentlemen (Thief OG’s).
Target: Resistance/overbought zone at 100.20
🎩 Escape target: 100.000 (take profits before market flips).
😰 Fear & Greed Sentiment
Index Level: 64 (Greed)
Market Mood: Moderately greedy, driven by:
📉 Net new 52-week highs vs. lows (bullish)
📊 VIX near averages (neutral)
🛡️ Bonds underperforming stocks (risk-on)
📈 Junk bond demand narrowing spreads (greed signal)
🌍 Fundamental & Macro Score
Fed Rate Cut Probability: 90% (Sept 18 FOMC, 25 bps cut expected)
Key Drivers:
✅ Labor Data: NFP (Sept 5) is crucial for direction.
⚠️ Trade Policy: Court ruled Trump tariffs illegal (appeal pending).
⬇️ Consumer Confidence: Michigan Index at 3-month low (58.2).
⬆️ ISM Manufacturing: Ahead of release, possible USD support.
Safe-Haven Demand: Geopolitical tensions supporting USD.
🐂 Overall Market Outlook Score
Bullish (Long): 60%
Bearish (Short): 40%
Bias: Short-term bullish as long as 97.60 holds.
USD rebound + bond yield strength + equity weakness backing USD.
⚠️ Risk: Break below 97.60 → next target 96.55 (bearish).
💡 Key Takeaways
🎯 NFP Report (Sept 5) = decisive catalyst.
⚖️ Fed debates + trade policy = medium-term uncertainty.
📉 Breakout above 98.80 is the key to bullish continuation.
🔍 Related Markets to Watch
FX:EURUSD
FX:GBPUSD
FX:USDJPY
OANDA:XAUUSD
CAPITALCOM:US30
✨ “If you find value in my analysis, a 👍 and 🚀 boost is much appreciated — it helps me share more setups with the community!”
#DXY #USD #DollarIndex #Forex #DayTrading #SwingTrading #BreakoutStrategy #ThiefTrader #TradingSetup

DXY – Reversal in Motion, Correction Next?In my previous DXY analysis, I highlighted that all the bad news might already be priced in for the USD, opening the door for a reversal.
That scenario is now unfolding: after making new dips, the index bounced strongly from the 95 zone and is currently trading around 98.
After such a sharp rebound, the market looks ready for a correction. This pullback phase could provide traders with attractive opportunities – especially to position short on the major USD pairs, but at better, higher prices.
Trading Plan:
• The reversal has confirmed, but I expect a correction before continuation.
• I’m looking for retracements to offer entry levels for USD shorts via majors.
• As always, flexibility is key – monitor price action closely to time entries correctly.
The market has started to shift – now it’s about waiting for the correction to align risk and reward properly. 🚀
DXY Breakout Trade Setup – Bullish Channel & High R:R OpportunitChart Overview:
Instrument: U.S. Dollar Currency Index (DXY)
Timeframe: 1 Hour (1H)
Current Price: 98.371
Analysis Date: September 26, 2025
🔍 Technical Structure:
1. Bullish Channel:
A clear ascending channel is drawn, indicating a strong short-term uptrend.
Price action has been respecting the channel well, moving between the upper and lower trendlines.
A bullish breakout is either anticipated or just confirmed above the channel.
🟦 Trade Setup (Long Position):
✅ Entry Point:
Price: 98.267 (blue horizontal line labeled "Entry Point")
This is slightly below the current price (98.371), suggesting an entry on a slight pullback after breakout.
🛑 Stop Loss:
Price: 97.986 (also marked 97.982 on the lower blue line)
Located below a recent support zone and below the breakout structure.
This gives a safety buffer if the breakout fails.
🎯 Target Point (Take Profit):
Price: 99.676
This is based on the measured move from the height of the channel, projected upward from the breakout point.
📐 Risk-to-Reward Ratio (RRR):
Very favorable; visually it appears to be around 4:1 or higher.
Small stop loss area (red box) relative to the large target area (green box).
High RRR makes this setup attractive for risk-managed traders.
🔎 Additional Observations:
Trend: Strong bullish momentum leading into the breakout.
Volume / Confirmation: Not shown on the chart, but ideally you’d want volume confirmation for the breakout.
Timing: Entry and confirmation should align with break and retest of the channel top.
✅ Summary of the Trade Plan:
Component Value
Entry 98.267
Stop Loss 97.986
Take Profit 99.676
Risk-Reward ~4:1
Trade Type Long (Buy)
Strategy Breakout + Retest
⚠️ Important Notes:
Wait for confirmation (like a bullish candle close above the channel or successful retest).
Be aware of macroeconomic news that can affect DXY (e.g., Fed announcements, interest rate decisions, inflation data).
Use position sizing appropriate to your risk tolerance.


U.S. Dollar Index (DXY) – Bullish Pullback & Long Setup (2H Char1. Price Action & Structure
The chart shows a bullish channel (red shaded area) where price has been making higher highs and higher lows since around September 18.
Price recently reached the upper trendline of the channel and is now pulling back toward the middle/lower zone.
2. Key Levels
Support Zone: Around 97.575 – 97.257 (blue labels).
This is where the chart suggests a potential buy/long entry.
The gray box marks the area where price is expected to reverse to the upside.
Stop-Loss Level: Slightly below 97.257, around 97.238 (red level).
If price breaks below this, it would invalidate the bullish setup.
Target Point: 98.799 – 98.805
This is the projected move upward, shown with the big arrow.
3. Expected Scenario
The zigzag line indicates that price may dip into the support zone, consolidate, and then bounce back up strongly toward the target point.
This is a long (buy) trade setup with a favorable risk-to-reward ratio since the potential reward is much bigger than the stop loss risk.
4. Risk–Reward Ratio
Risk (downside): Around 0.3 points (from 97.575 entry to 97.238 stop).
Reward (upside): Around 1.2 points (from 97.575 entry to 98.799 target).
That’s roughly 4:1 R:R — a very good trade setup if price respects the support zone.
Summary
✅ Bullish Bias – Price is in an uptrend channel.
📉 Buy Zone: 97.575 – 97.257
📊 Target: 98.799 – 98.805
🛑 Stop Loss: Below 97.238
🎯 Expectation: Short-term dip followed by a strong bullish rally.

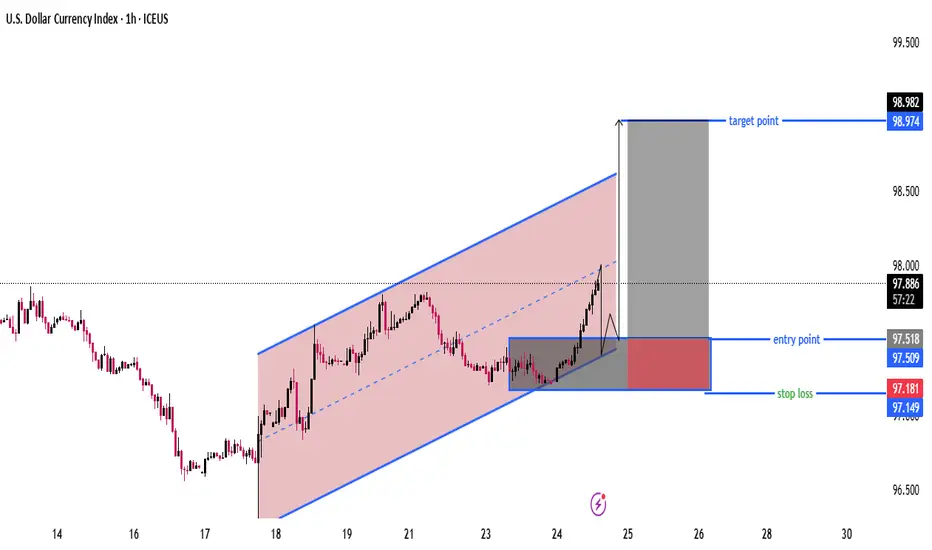
DXY Bullish Channel Setup with 1:4.5 RRR (Entry 97.50 → Target 9Chart Analysis
Trend:
Price is moving inside a rising parallel channel (marked in red with blue borders).
Currently near the mid-to-upper side of the channel.
Setup Highlighted:
Entry Point: Around 97.50 – 97.52 (support zone).
Stop Loss: Around 97.15 – 97.18 (below support and channel bottom).
Target Point: Around 98.97 – 98.98 (near channel top).
Risk-to-Reward Ratio (RRR):
Risk: ~0.33 points (97.50 → 97.18).
Reward: ~1.46 points (97.50 → 98.98).
RRR ≈ 1:4.5, which is a strong setup.
Price Action:
The chart suggests a retest of support (97.50 area) before a bullish continuation.
If buyers hold this level, upward momentum could push toward the 98.90–99.00 zone.
Invalidation:
A breakdown below 97.15 would invalidate the long setup and may push price toward 96.80 – 96.50 support levels.
📌 Summary
Bias: Bullish (as long as price holds above 97.15).
Plan: Wait for a pullback to the entry zone (97.50) for confirmation.
Target: 98.90 – 99.00.
Stop Loss: Below 97.15.
Strong RRR trade idea within the bullish channel.
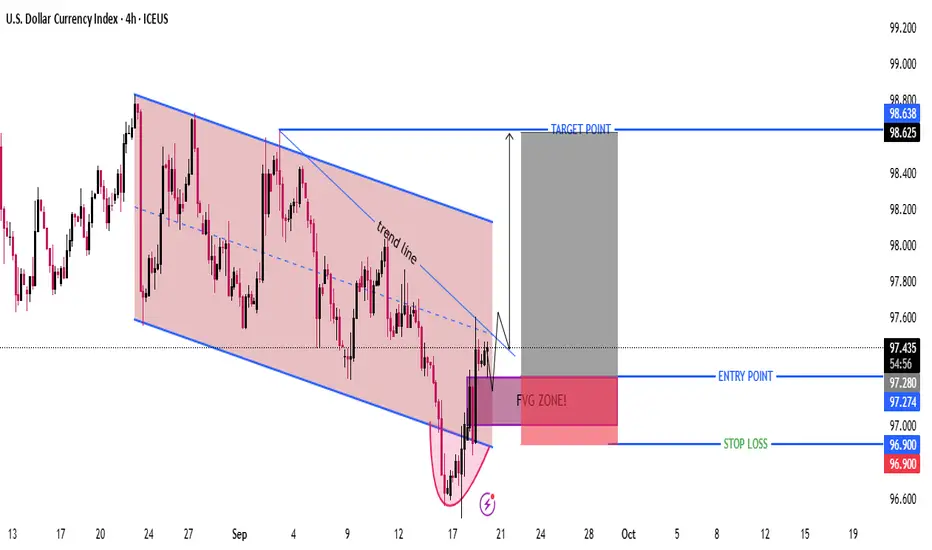
DXY 4H – Bullish Reversal Setup from FVG Zone | Target 98.63Technical Analysis
Downtrend Channel (Bearish Structure)
Price has been moving inside a descending channel (highlighted in red).
Recently, it touched the lower boundary and formed a rounded bottom pattern (possible reversal signal).
Trendline Breakout
A short-term downtrend line has been broken to the upside.
This suggests momentum is shifting from bearish to bullish.
Fair Value Gap (FVG Zone)
Price is currently testing an FVG zone around 97.00–97.28.
This zone acts as a potential entry area for long trades.
Entry, Stop Loss, and Target
Entry Point: 97.28 – 97.27
Stop Loss: 96.90 (below FVG zone support)
Target Point: 98.63
Risk–Reward Ratio: Approximately 1:3 → good setup.
Potential Scenario
If price holds above the FVG zone and doesn’t break below 96.90, we may see a bullish move toward 98.63.
But if the FVG fails and price closes below 96.90, it could resume the downtrend.
✅ Summary:
Market structure shows a possible bullish reversal after a prolonged downtrend.
A clean long setup is planned: Buy near 97.27 → Stop 96.90 → Target 98.63.
Confirmation needed: Strong bullish candle closing above the FVG zone
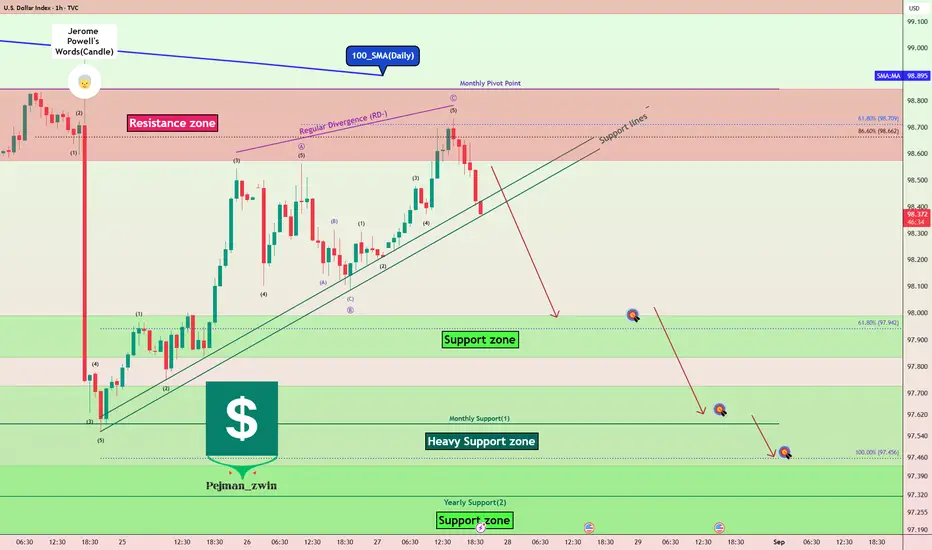
DXY at Major Support – Dollar Ready to Rebound?Today, I want to analyze the DXY index ( TVC:DXY ) for you. First, I must say that this week, US indexes can have an impact on the DXY index trend .
US indexes to be released this week:
Core PPI m/m: Tomorrow
PPI m/m: Tomorrow
Core CPI m/m: Thursday
CPI m/m: Thursday
CPI y/y: Thursday
Unemployment Claims: Thursday
Prelim UoM Consumer Sentiment: Friday
Prelim UoM Inflation Expectations: Friday
The DXY Index is currently moving near the Support zone($97.989-$97.834) , Yearly Support(2) , and the lower line of the descending channel .
In terms of Elliott Wave theory , it seems that the DXY index has managed to complete microwave 5 of the main wave C . The corrective structure is of the Zigzag Correction(ABC/5-3-5) type.
Also, we can see the Regular Divergence (RD+) between consecutive valleys .
I expect the DXY index to rise to at least $98.07(First Target) before the US indexes are announced.
Second Target: $98.56
Stop Loss(SL): $96.997
Note: With the DXY index rising, we can expect a correction in Gold( OANDA:XAUUSD ), Bitcoin( BINANCE:BTCUSDT ), and major Forex pairs (dollar strength).
Please respect each other's ideas and express them politely if you agree or disagree.
U.S. Dollar Index Analyze (DXYUSD), 1-hour time frame.
Be sure to follow the updated ideas.
Do not forget to put a Stop loss for your positions (For every position you want to open).
Please follow your strategy and updates; this is just my Idea, and I will gladly see your ideas in this post.
Please do not forget the ✅' like '✅ button 🙏😊 & Share it with your friends; thanks, and Trade safe.
DXY ready to resume downtrend!97.94 Level on DXY is a high liquidity zone as in the falling market there is bounce off to 97.937. Price grabbed liquidity and started to drop again to the major direction of the trend. As it is a long term down trend and price just rejected from a high liquidity zone, it is a high probability price may continue to drop to this support level as multiple timeframe trend is bearish.

DXY Analysis – Are Bad News Already Priced In?Since Trump entered the White House, the U.S. Dollar has taken a hard hit against its major counterparts, losing more than 10% overall.
But looking closer at the chart, we see a different story: since the April low around 97.80, the DXY has been stuck in a range-bound pattern, with the exception of July’s dip that was quickly reversed.
Lately, the USD has faced strong headwinds:
• Two weak NFP reports in a row.
• The Fed hinting at rate cuts.
• A constant flow of bearish headlines.
And yet, the Dollar did not collapse to fresh lows — instead, it simply revisited the same levels as before. This is a classic market signal that bad news may already be priced in.
From a technical standpoint, August was nothing but an annoying tight range:
• Support around 97.50.
• Resistance near 98.50.
Now, although the index looks like it’s breaking lower, I suspect this is another false breakdown, one that could be reversed quickly. If that plays out, the stage is set for a push higher — potentially to the 100 zone, a clean 3% rise from current levels.
Such a move would naturally translate into pressure on the majors:
• EUR/USD could slide back toward 1.14.
• GBP/USD could retreat near 1.35.
For now, I’m watching closely for reversal signals. The market has punished the USD for months, but if sellers are exhausted, the Dollar may surprise to the upside. 🚀

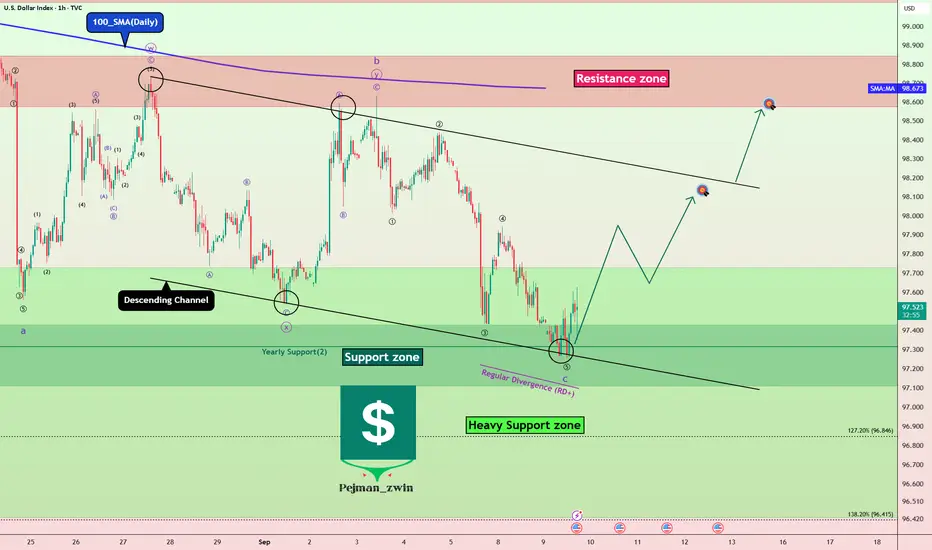
DXY Analysis: Resistances Holding Strong, Is the Downtrend Back?Today, I want to analyze one of the important indices of the financial markets , the U.S. Dollar Index ( TVC:DXY ), for you, which can be a guide for taking short-long positions in the Forex , Futures , and even Crypto markets.
The DXY index fell by about -1.2% after Jerome Powell began talking about the possibility of a rate cut in September , but as the new week began, the DXY index started to rise again.
If we look at the DXY Index chart on the 1-hour time frame , we can see that the DXY Index reacted well to the Resistances and started to decline.
The Resistances for the DXY Index include:
Resistance zone($98.843-$98.575)
Monthly Pivot Point
100_SMA(Daily)
In terms of Elliott Wave theory , it seems that this increase in the DXY Index over the last two days has been in the form of corrective waves . The structure of the corrective waves is Zigzag Correction(ABC/5-3-5). By breaking the Support lines , we can confirm the end of the corrective waves .
Also, we can see the Regular Divergence(RD-) between Consecutive Peaks .
I expect the DXY Index to decline to at least the Support zone($97.989-$97.834) AFTER breaking the Support lines .
Second Target: $97.650
Third Target: $97.450
Stop Loss(SL): $99.000
Note: With the DXY Index declining, we can expect more hope for a weakening of the U.S Dollar's strength in the major Forex pairs .
Please respect each other's ideas and express them politely if you agree or disagree.
U.S. Dollar Index Analyze (DXYUSD), 1-hour time frame.
Be sure to follow the updated ideas.
Do not forget to put a Stop loss for your positions (For every position you want to open).
Please follow your strategy and updates; this is just my Idea, and I will gladly see your ideas in this post.
Please do not forget the ✅' like '✅ button 🙏😊 & Share it with your friends; thanks, and Trade safe.
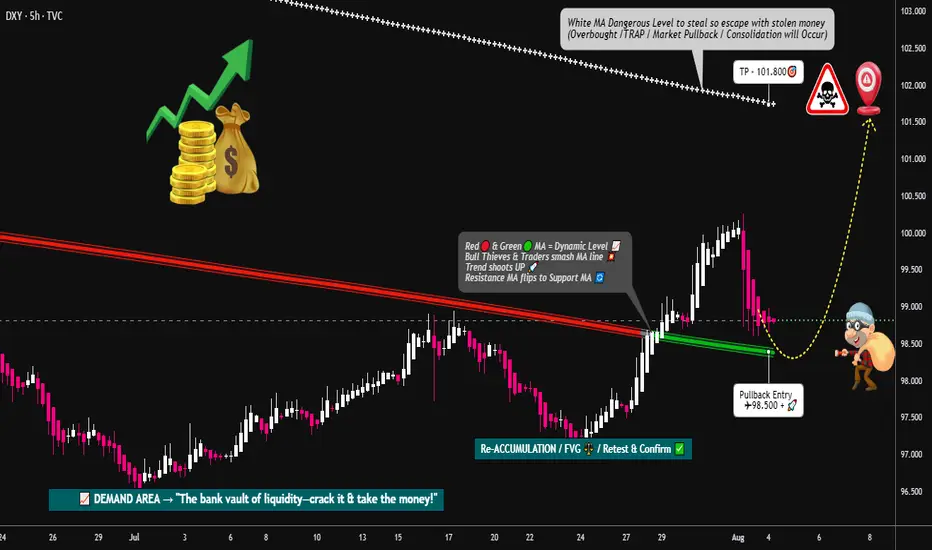
DXY Locked & Loaded: Robber's Gameplan for Profit Pullout💸💼 "DXY Market Heist Blueprint – The Thief's Bullish Escape Plan" 💼💸
Rob the Market, Not the Rules – Trade Smart, Trade Sharp, Trade Thief Style™
🌍 Hey Money Makers, Risk Takers & Market Robbers!
Hola! Ola! Bonjour! Hallo! Marhaba! 🙌
Let’s break into the DXY vault and swipe those profits with precision. 💼💸
🧠💡This Thief Trading Style™ Master Plan is a high-stakes operation backed by technical setups, macro-fundamentals, and robbery-level insights. Follow the blueprint laid out on the chart. Our target? The High-Risk Yellow ATR Zone – where the real treasure is buried.
💼 ENTRY: "The Vault Is Open – Grab the Bullish Bags!"
Enter long as price approaches key pullback levels within a 15–30 min timeframe. Use the most recent candle wick’s swing low/high for sniper-style DCA entries.
🔑 Layer multiple limit orders like a thief stacking getaway bags (aka the DCA / Layering Method). Be patient and precise.
🛑 STOP LOSS: "Don’t Get Caught by the Market Police"
📍 Place SL just below the nearest 4H swing low (example: 97.300) depending on your strategy (scalping/swing).
⚖️ Your SL should reflect your risk appetite, lot size, and how many limit orders you’re running. Thieves don’t risk it all on one job. 🎭
🎯 TARGET: 101.800 (or Escape Before the Sirens)
Once the target zone nears, decide whether to collect full loot or exit before resistance hits. We trade smart, not greedy. 🧠💰
📈 Why This Heist Makes Sense: Market Conditions Breakdown
Bullish momentum supported by macro drivers and intermarket forces
COT report and sentiment leaning in favor of USD
Dollar Index structure showing signs of reversal + trend confirmation
Consolidation trap zones hinting at institutional accumulation
💡 This is not just a blind entry—it's a well-researched and time-tested plan. Check the chart details and refer to:
🔗 Fundamentals | COT Reports | Sentiment Score | Quantitative Outlook
🚨 NEWS & POSITION MANAGEMENT ALERT
Before jumping in, beware of high-impact news!
🗞️ To keep your trades safe and stress-free:
Avoid opening new positions during major news releases
Use trailing SLs to protect gains
Monitor volatility triggers (economic calendar is your best friend!)
🏴☠️💥 BOOST THE ROBBERY – Hit That Like/Boost Button
The more you boost, the stronger the heist crew becomes! 💪🚀
Help fellow traders steal opportunities with the Thief Trading Style™ – calculated, bold, and sharp.
🔥 Let's continue to outsmart the markets and make each trade count. Stay tuned for the next heist update – fresh trades, deeper insights, and bigger bags. 🤑💼
🔔 Disclaimer: This plan is not financial advice. Use it for educational and entertainment purposes. Always conduct your own analysis and manage risk accordingly.
📌 Markets shift quickly. Stay adaptable, informed, and always ready to pivot.
DXY ready to drop again?DXY has done false breakout in the beginning of the week with strong rejection to the upside. Upon rejection, price has pulled back to 38.2% fib along with daily resistance retest and price has strongly rejected from 98.70 showing further downside with another wave to 98.32 has rejected with strong liquidity candle that continue to drop as 4h, has formed liquidity candle with false breakout at 98.00, there is higher probability to drop to support.

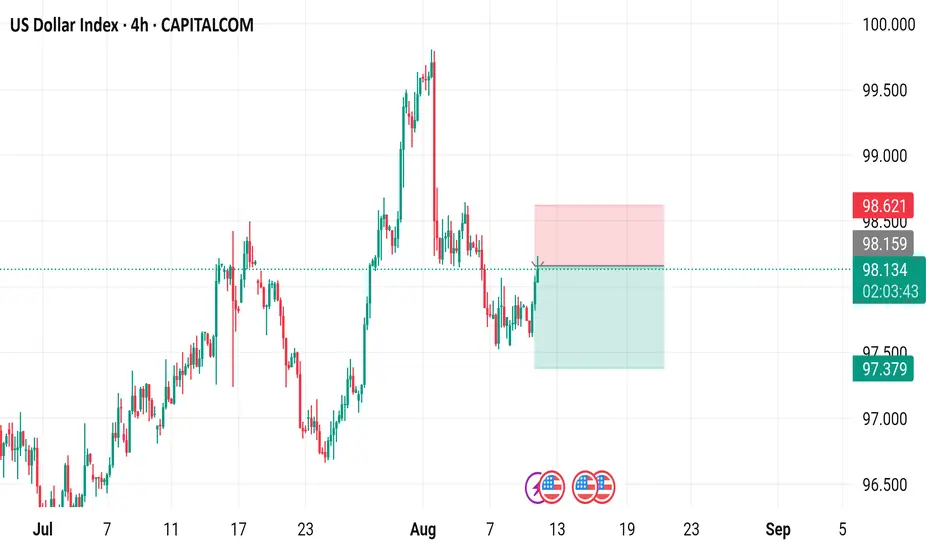
US Dollar Index (DXY) 4-Hour Chart4-hour chart of the US Dollar Index (DXY) from CAPITALCOM. The chart shows the price movement of the DXY from early July to early September. The current price is 98.131 with a 0.28% increase. The chart features a candlestick pattern with green (upward movement) and red (downward movement) bars. A sell signal is indicated at 98.132, and a buy signal is at 98.186. The chart also includes highlighted zones (red and green rectangles) indicating potential trading ranges or areas of interest between approximately 98.621 and 97.379.
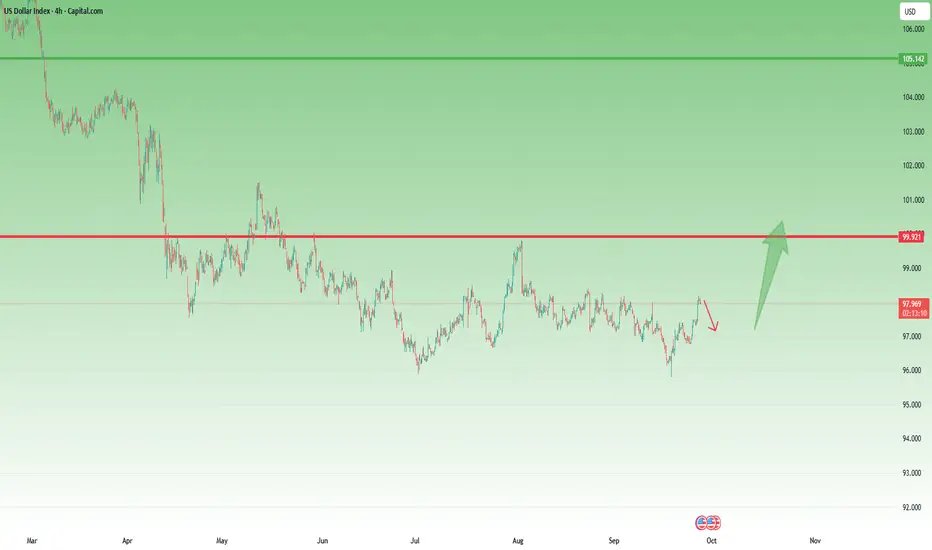
DXY Just Broke Resistance – Is This the Start of a Dollar Rally?As per our analysis, DXY has successfully broken above the primary and secondary resistance line.
If the price manages to close above the marked resistance zone, we could see further upside momentum ahead.

DXY still in downward channel. Rejection here = BTC rally The DXY is still in a downward sloping channel and trying to break back above the previous 2-year cycle low, but I think will reject here and kick off the next leg of the BTC rally.
Ideally we get a big DXY drop and ultimately break below the 95% level and on down into 'Bitcoin Super Rally Zone'🚀

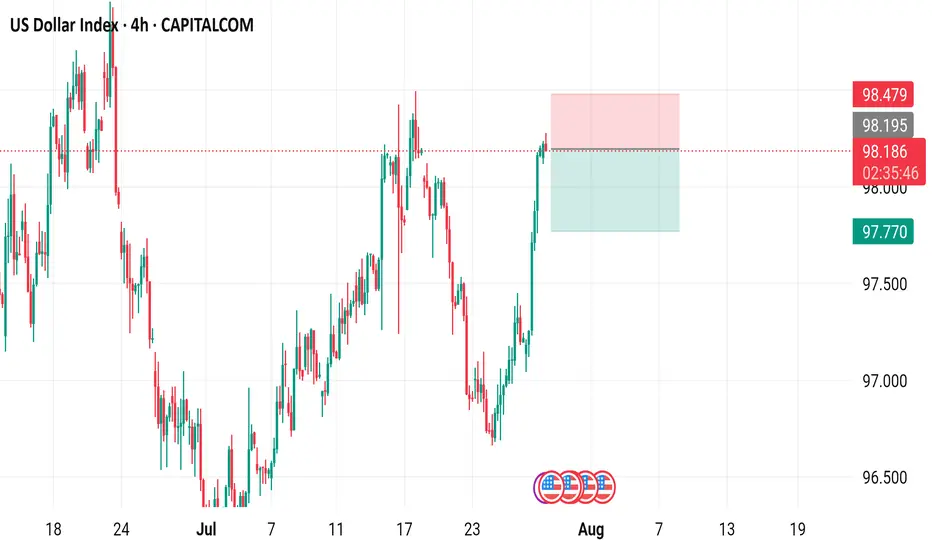
US Dollar Index (DXY) - 4 Hour Chart4-hour chart from CAPITALCOM displays the recent performance of the US Dollar Index (DXY), showing a current value of 98.190 with a slight decline of 0.009 (-0.01%). The chart highlights key price levels, including a recent sell signal at 98.189 and a buy signal at 98.243, with a resistance zone marked between 98.195 and 98.479. The index has experienced fluctuations, with notable drops and recoveries, and is currently trending near the 98.190 level as of July 29, 2025.
US Dollar Index - 4h Chart (CAPITALCOM)4-hour chart of the US Dollar Index (DXY) from CAPITALCOM shows the index's recent price movements. The current value is 96.955, with a slight increase of 0.054 (+0.06%). Key levels include a support at 96.413 and resistance at 97.554. The chart highlights buy signals at 97.012 and sell signals at 96.958 and 96.955, with a notable downward trend breaking below a support zone around 97.150.

US Dollar Breakdown – Don’t Fight the FloodSince the start of the year, after forming a small double top around the 110 zone, the US Dollar Index (DXY) has followed only one direction: down.
So far, we’re seeing a decline that’s approaching 15%, with the index breaking multiple major support levels along the way. And judging by the current structure, there’s little reason to believe this trend will reverse any time soon.
________________________________________
🔍 Short-Term View – Flag Break, More Losses Ahead
Zooming in, we can observe that the last rally was purely corrective — a typical bear flag formation. That flag is now broken to the downside, which confirms renewed bearish pressure and suggests that further losses are likely even in the short term.
________________________________________
🎯 What’s Next?
The next major support zone sits around 95, a level that should act as a magnet if the current trend continues.
As long as price stays under 100 ZONE, the outlook remains bearish and the strategy should align with that bias.
________________________________________
✅ Strategy Going Forward
The safe and logical approach now is to buy dips on major USD pairs:
EURUSD, GBPUSD, AUDUSD, and NZDUSD
________________________________________
📌 Final Thought
The structure is clear, momentum favors the downside, and the market is offering clean setups across multiple USD pairs.
Don’t fight the trend — follow the flow. 🟢

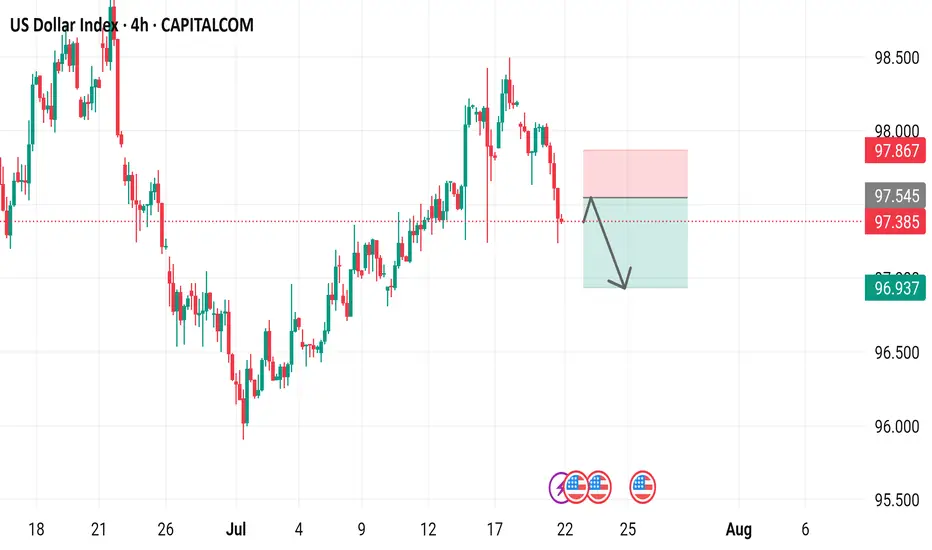
US Dollar Index 4-hour time frame, showcasing the US Dollar Index's performance over this period.
- The index is currently at 97.385, with a decrease of 0.636 (-0.65%) from its previous value.
- A red box indicates a "SELL" signal at 97.385, while a blue box suggests a "BUY" signal at 97.439.
- The chart includes various technical indicators, such as moving averages and relative strength index (RSI), to help traders analyze market trends.
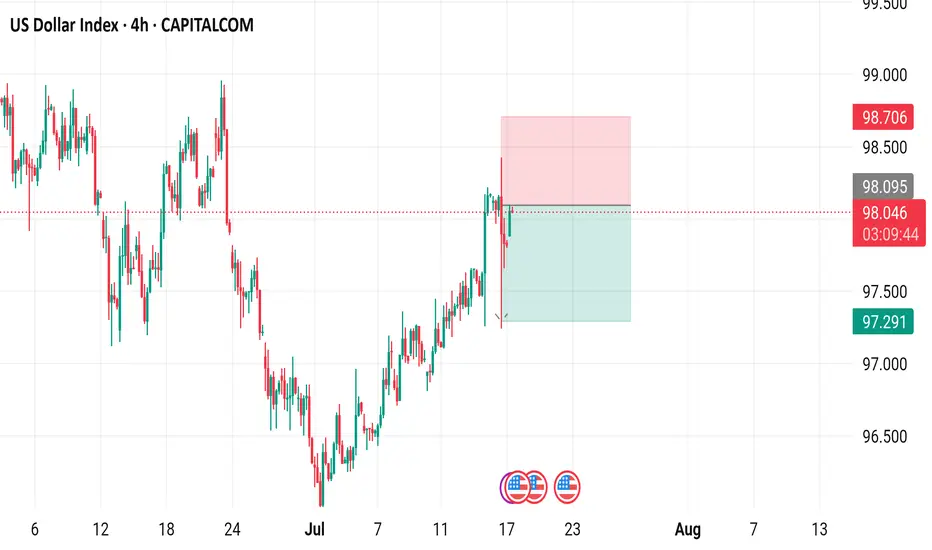
US Dollar Index (DXY) - 4 Hour Chart4-hour performance of the US Dollar Index (DXY) from CAPITALCOM, showing a current value of 98.040 with a 0.23% increase (+0.222). The chart includes recent buy and sell signals at 98.094 and 98.040, respectively, with a highlighted resistance zone around 98.706-99.000 and a support zone around 97.291-98.040. The timeframe covers data from early July to mid-August 2025.