DXYU.S Dollar Index
- Order Block
- Fair Value Gap
- Completed " 12345 " Impulsive Waves and " A " Corrective waves
- Fibonacci Level - 50.00% / 61.80%
- Demand Zone
Dxyviews

DXYU.S Dollar Index
- Bearish Channel as an corrective pattern in Short Time Frame
- Break of Structure
- RSI - Divergence
- Completed " 123 " Impulsive Waves
- Demand Zone

DXYU.S Dollar Index
- Rising Wedge as an corrective pattern in Long Time Frame
- Order Block
- Fibonacci Level - 50.00% / 61.80%
- Demand Zone
- Completed " 1234 " Impulsive Waves

DXY Trade Set Up Dec 9 2025I am expecting DXY to continue bullish for now, targeting supply before the reversal back down

DXYU.S Dollar Index
- Buy Side Liquidity
- Break of Structure
- Completed " 12345 " Impulsive Waves
- Change of Characteristics
- RSI - Divergence

DXYDXY - U.S Dollar Index
- Completed " 1234 " Impulsive Waves
- Fair Value Gap
- Bullish Channel as an corrective pattern in Short Time Frame
- Resistance Level
- Double Top in Short Time Frame

DXYU.S Dollar Index
- Completed " 12345 " Impulsive Waves and " AB " Corrective Wave
- Break of Structure
- Demand Zone
- Order Block
- Change of Characteristics

DXYU.S Dollar Index
- Bullish Channel as an corrective pattern in Long Time Frame
- Break of Structure
- Completed " 1234 " Impulsive Waves
- Fibonacci Level - 23.60%
- Demand Zone

DXYU.S Dollar Index
- Completed " 12345 " Impulsive Waves
- Break of Structure
- Bullish Channel as an corrective pattern in Long Time Frame
- Order Block
- RSI - Divergence

DXY FRGNT Weekly Forecast -Q4 | W45 | Y25 |📅 Q4 | W45 | Y25 |
📊 DXY FRGNT Weekly Forecast
🔍 Analysis Approach:
I’m applying Smart Money Concepts, focusing on:
Identifying Points of Interest on the Higher Time Frames (HTFs) 🕰️
Using those POIs to define a clear trading range 📐
Refining those zones on Lower Time Frames (LTFs) 🔎
Waiting for a Break of Structure (BoS) for confirmation ✅
This method allows me to stay precise, disciplined, and aligned with the market narrative, rather than chasing price.
💡 My Motto:
"Capital management, discipline, and consistency in your trading edge."
A positive risk-to-reward ratio, paired with a high win rate, is the backbone of any solid trading plan 📈🔐
⚠️ Losses?
They’re part of the mathematical game of trading 🎲
They don’t define you — they’re necessary, they happen, and we move forward 📊➡️
🙏 I appreciate you taking the time to review my Daily Forecast.
Stay sharp, stay consistent, and protect your capital
— FRNGT 🚀
TVC:DXY

DXY FRGNT Daily Forecast -Q4 | W44 | D31| Y25 |📅 Q4 | W44 | D31| Y25 |
📊 DXY FRGNT Daily Forecast
🔍 Analysis Approach:
I’m applying Smart Money Concepts, focusing on:
Identifying Points of Interest on the Higher Time Frames (HTFs) 🕰️
Using those POIs to define a clear trading range 📐
Refining those zones on Lower Time Frames (LTFs) 🔎
Waiting for a Break of Structure (BoS) for confirmation ✅
This method allows me to stay precise, disciplined, and aligned with the market narrative, rather than chasing price.
💡 My Motto:
"Capital management, discipline, and consistency in your trading edge."
A positive risk-to-reward ratio, paired with a high win rate, is the backbone of any solid trading plan 📈🔐
⚠️ Losses?
They’re part of the mathematical game of trading 🎲
They don’t define you — they’re necessary, they happen, and we move forward 📊➡️
🙏 I appreciate you taking the time to review my Daily Forecast.
Stay sharp, stay consistent, and protect your capital
— FRNGT 🚀
TVC:DXY

DXY FRGNT Daily Forecast -Q4 | W44 | D29| Y25 |📅 Q4 | W44 | D29| Y25 |
📊 DXY FRGNT Daily Forecast
🔍 Analysis Approach:
I’m applying Smart Money Concepts, focusing on:
Identifying Points of Interest on the Higher Time Frames (HTFs) 🕰️
Using those POIs to define a clear trading range 📐
Refining those zones on Lower Time Frames (LTFs) 🔎
Waiting for a Break of Structure (BoS) for confirmation ✅
This method allows me to stay precise, disciplined, and aligned with the market narrative, rather than chasing price.
💡 My Motto:
"Capital management, discipline, and consistency in your trading edge."
A positive risk-to-reward ratio, paired with a high win rate, is the backbone of any solid trading plan 📈🔐
⚠️ Losses?
They’re part of the mathematical game of trading 🎲
They don’t define you — they’re necessary, they happen, and we move forward 📊➡️
🙏 I appreciate you taking the time to review my Daily Forecast.
Stay sharp, stay consistent, and protect your capital
— FRNGT 🚀
TVC:DXY

DXY FRGNT Daily Forecast -Q4 | W44 | D27| Y25 |📅 Q4 | W44 | D27| Y25 |
📊 DXY FRGNT Daily Forecast
🔍 Analysis Approach:
I’m applying Smart Money Concepts, focusing on:
Identifying Points of Interest on the Higher Time Frames (HTFs) 🕰️
Using those POIs to define a clear trading range 📐
Refining those zones on Lower Time Frames (LTFs) 🔎
Waiting for a Break of Structure (BoS) for confirmation ✅
This method allows me to stay precise, disciplined, and aligned with the market narrative, rather than chasing price.
💡 My Motto:
"Capital management, discipline, and consistency in your trading edge."
A positive risk-to-reward ratio, paired with a high win rate, is the backbone of any solid trading plan 📈🔐
⚠️ Losses?
They’re part of the mathematical game of trading 🎲
They don’t define you — they’re necessary, they happen, and we move forward 📊➡️
🙏 I appreciate you taking the time to review my Daily Forecast.
Stay sharp, stay consistent, and protect your capital
— FRNGT 🚀
TVC:DXY

DXY FRGNT Daily Forecast -Q4 | W43 | D2| Y25 |
📅 Q4 | W43 | D2| Y25 |
📊 DXY FRGNT Daily Forecast
🔍 Analysis Approach:
I’m applying Smart Money Concepts, focusing on:
Identifying Points of Interest on the Higher Time Frames (HTFs) 🕰️
Using those POIs to define a clear trading range 📐
Refining those zones on Lower Time Frames (LTFs) 🔎
Waiting for a Break of Structure (BoS) for confirmation ✅
This method allows me to stay precise, disciplined, and aligned with the market narrative, rather than chasing price.
💡 My Motto:
"Capital management, discipline, and consistency in your trading edge."
A positive risk-to-reward ratio, paired with a high win rate, is the backbone of any solid trading plan 📈🔐
⚠️ Losses?
They’re part of the mathematical game of trading 🎲
They don’t define you — they’re necessary, they happen, and we move forward 📊➡️
🙏 I appreciate you taking the time to review my Daily Forecast.
Stay sharp, stay consistent, and protect your capital
— FRNGT 🚀
TVC:DXY

DXYU.S Dollar Index
- Bullish Channel as an corrective pattern in Short Time Frame
- Break of Structure
- Completed " 12345 " Impulsive Waves and " A " Corrective Waves
- RSI - Divergence
- Order Block

DXY Breakout Trade Setup – Bullish Channel & High R:R OpportunitChart Overview:
Instrument: U.S. Dollar Currency Index (DXY)
Timeframe: 1 Hour (1H)
Current Price: 98.371
Analysis Date: September 26, 2025
🔍 Technical Structure:
1. Bullish Channel:
A clear ascending channel is drawn, indicating a strong short-term uptrend.
Price action has been respecting the channel well, moving between the upper and lower trendlines.
A bullish breakout is either anticipated or just confirmed above the channel.
🟦 Trade Setup (Long Position):
✅ Entry Point:
Price: 98.267 (blue horizontal line labeled "Entry Point")
This is slightly below the current price (98.371), suggesting an entry on a slight pullback after breakout.
🛑 Stop Loss:
Price: 97.986 (also marked 97.982 on the lower blue line)
Located below a recent support zone and below the breakout structure.
This gives a safety buffer if the breakout fails.
🎯 Target Point (Take Profit):
Price: 99.676
This is based on the measured move from the height of the channel, projected upward from the breakout point.
📐 Risk-to-Reward Ratio (RRR):
Very favorable; visually it appears to be around 4:1 or higher.
Small stop loss area (red box) relative to the large target area (green box).
High RRR makes this setup attractive for risk-managed traders.
🔎 Additional Observations:
Trend: Strong bullish momentum leading into the breakout.
Volume / Confirmation: Not shown on the chart, but ideally you’d want volume confirmation for the breakout.
Timing: Entry and confirmation should align with break and retest of the channel top.
✅ Summary of the Trade Plan:
Component Value
Entry 98.267
Stop Loss 97.986
Take Profit 99.676
Risk-Reward ~4:1
Trade Type Long (Buy)
Strategy Breakout + Retest
⚠️ Important Notes:
Wait for confirmation (like a bullish candle close above the channel or successful retest).
Be aware of macroeconomic news that can affect DXY (e.g., Fed announcements, interest rate decisions, inflation data).
Use position sizing appropriate to your risk tolerance.


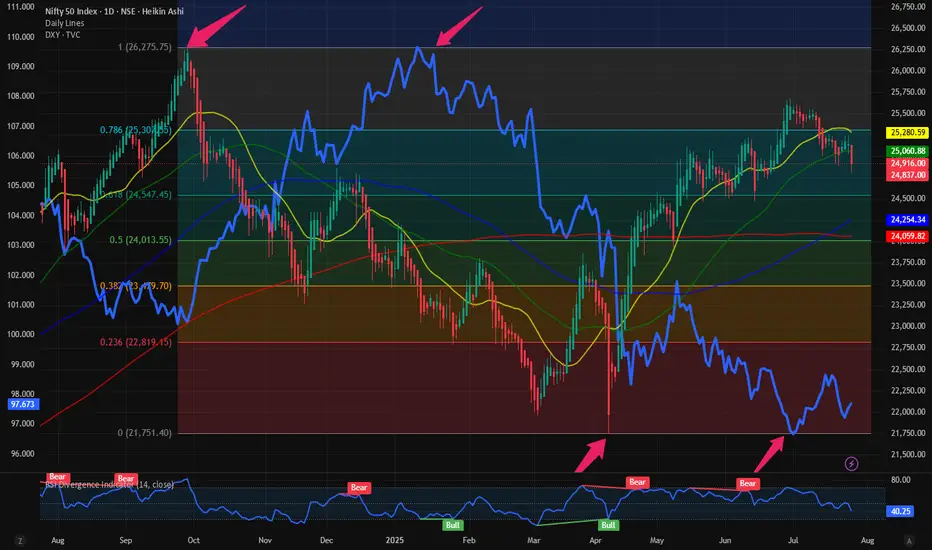
$NIFTY: Minor hiccup or downside expected. Answer: Watch $DXYRecently we have seen some weakness in NSE:NIFTY where it has failed to break out of the upward sloping Fib Retracement level. On June 16 we reflected upon the situation with $NIFTY. I was bullish on NSE:NIFTY due to the $DXY.
TVC:DXY weakness and EM markets: NSE:NIFTY more upside? for NSE:NIFTY by RabishankarBiswal — TradingView
My prediction was that the NSE:NIFTY can reach 26000 and TVC:DXY @ 96 by end of July. But the unravelling of the TVC:DXY short trade and recent strength in TVC:DXY has put pressure on our outlook.
Now we can go to the micro level and check what happening in the charts for both TVC:DXY and $NIFTY. In the daily chart below we overlayed TVC:DXY on top of the NSE:NIFTY candle stick chart. If we draw the Fib retracement level form the top to bottom of the NSE:NIFTY on the yearly chart we can see clear levels at play. It is also astounding to see how the Top and the bottom range of the Fib levels match to those from the $DXY. After making a new low of 97, TVC:DXY saw some short covering which took it back to 99. At the same time NSE:NIFTY put out a local top @ 25600 and then pulled back below to 0.786 Fib level currently below the psychological level of 25000. Hence our July end target of 26000 for NSE:NIFTY and 96 for TVC:DXY looks distant but not unrealistic. With 4 more trading days left in the month we might rally another 4.5% in NSE:NIFTY and drop 2% in TVC:DXY giving us a perfect leverage trade and meeting our July targets.
Verdict: NSE:NIFTY @ 26000 and TVC:DXY @ 96 as target remains intact. If not in July, we will achieve it in August.
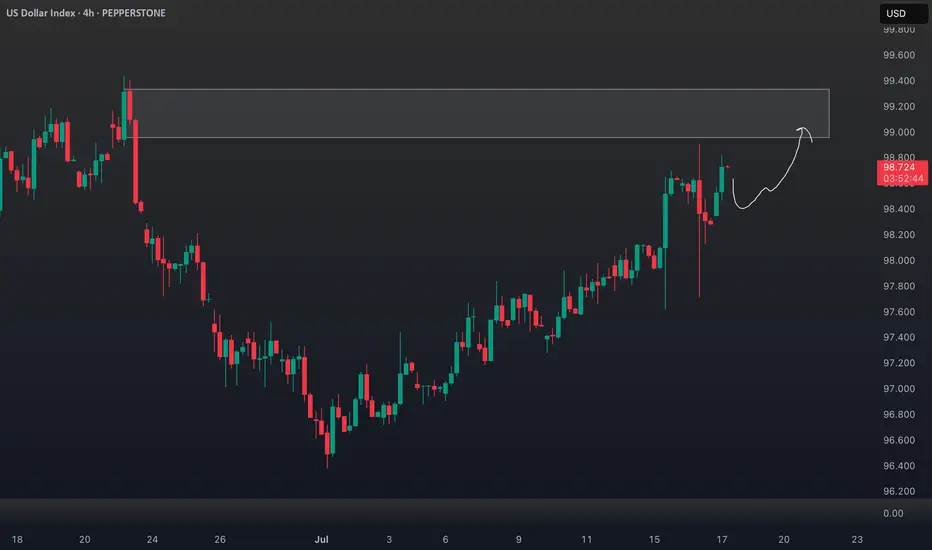
DXY Outlook: Bullish Move Fueled by Fundamentals & GeopoliticsTechnical Analysis (4H Chart & Broader Context) 📈🕓
The DXY 4H chart shows a clear bullish trend 🚀, with higher highs and higher lows since early July. DXY has caught a strong bid, breaking above short-term resistance near 98.40 and now eyeing the previous swing high 🎯. This matches the consensus among analysts: DXY remains in a bullish structure, with momentum supported by both technicals and macro factors.
Key resistance: Next upside target is the previous high (around 99.60 on the chart), with further resistance at the psychological 100 level 🏁.
Support: Immediate support at 98.20, then 97.60 🛡️.
Momentum: Strong bullish candles and no major bearish reversal signals on the 4H. Some analysts note positioning is stretched, so a short-term pullback or consolidation is possible before more upside (IG).
Fundamental Analysis 💹🌍
Why is DXY rallying?
Fed Policy & US Data: The US economy is resilient 💪, with robust services data, strong retail sales, and a recent uptick in core inflation. The Fed is less dovish, with markets now expecting a slower pace of rate cuts 🏦.
Interest Rate Differentials: The US keeps a yield advantage as the Fed is less aggressive in cutting rates compared to the ECB and BoJ, especially with Europe and Japan facing weaker growth and possible further easing 🌐.
Geopolitical Factors: Ongoing trade tensions (Trump’s tariff threats) and global uncertainty (including Middle East risks) are driving safe-haven flows into the dollar 🛡️🌏. DXY typically strengthens during periods of geopolitical stress.
Positioning: CFTC data shows USD long positioning at multi-month highs, which could mean the market is crowded and vulnerable to short-term corrections ⚠️ (IG).
Trade Idea (Bullish Bias, Targeting Previous High) 💡💵
Setup:
Bias: Bullish, in line with the prevailing trend and macro backdrop 🟢.
Entry: Consider buying on a minor pullback to the 98.20–98.40 support zone, or on a confirmed breakout above the recent high 🛒.
Target: Previous swing high near 99.60, with a stretch target at 100.00 🎯.
Stop: Below 97.60 (recent swing low/support) ⛔.
Risk Factors:
Overbought positioning could trigger a short-term pullback ⚠️.
Any dovish surprise from the Fed or rapid de-escalation in global tensions could cap further gains 🕊️.
In summary: The DXY’s bullish trend is underpinned by resilient US data, a hawkish Fed, and global risk aversion. Your bullish bias is well-supported, with the previous high as a logical target. Watch for short-term pullbacks, but the broader trend remains up unless key support is lost. 🚦
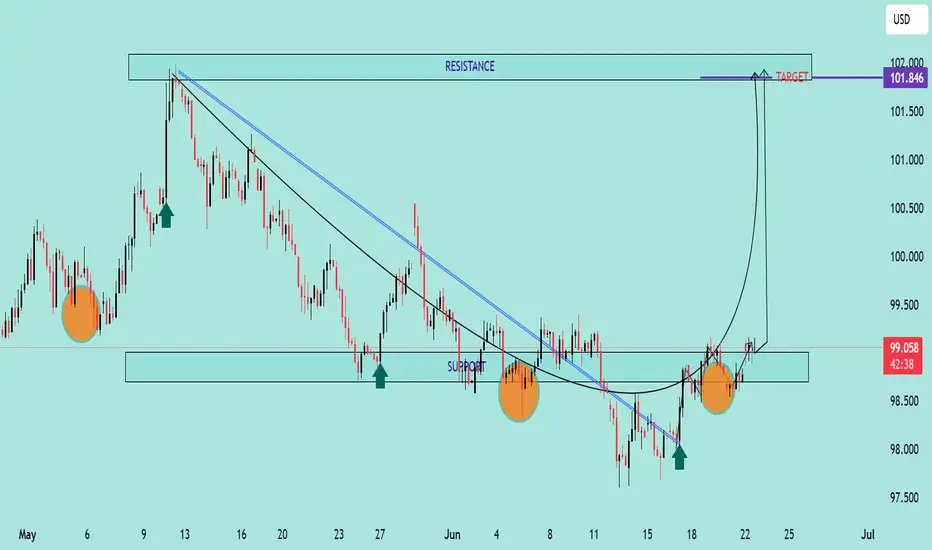
DXY Bullish Reversal & Cup Formation The DXY (US Dollar Index) is exhibiting a strong bullish reversal pattern, with multiple technical signals suggesting upward momentum:
🔍 Technical Analysis Summary:
✅ Support Holding Strong:
Price has respected the horizontal support zone around 98.00–98.50 on multiple occasions (highlighted by orange circles and green arrows), forming a solid base.
✅ Breakout from Downtrend:
A clear breakout above two descending trendlines (black and blue) indicates a shift from bearish to bullish sentiment.
✅ Cup Pattern Formation ☕:
A textbook Cup pattern is visible, where price formed a rounded bottom — a bullish continuation formation. The handle is minor and price has broken above the neckline (around 99.00), signaling a potential continuation toward the target.
✅ Bullish Target 🎯:
Based on the cup pattern and prior resistance, the projected target is around 101.846, aligning with previous major resistance.
📌 Key Levels to Watch:
Support Zone: 98.00 – 98.50
Immediate Resistance: 99.50 – 100.00
Major Resistance/Target: 101.846
🧭 Outlook:
As long as the price remains above the 98.50 zone, the bullish scenario remains intact. The cup breakout indicates strong buying pressure, and momentum could push DXY toward the 101.846 target in the coming sessions.
DXY Technical Outlook – Strong Support Test and Bullish Reversa Chart Summary
The DXY (U.S. Dollar Index) chart illustrates a significant technical structure between strong historical support and resistance zones, with potential for a bullish reversal after a key level retest.
🟢 Key Support Zone: 99.000 – 98.000
📍 Labeled as "STRONG SUPPORT", this zone has held multiple times:
Previous bounce: Early 2023 ✅
Mid-2024 rebound ✅
Current price action once again shows a reaction from this level with a bullish candle forming 🔥
📌 EMA Confluence:
The 200 EMA (blue) sits at 102.401
The 50 EMA (red) at 103.725
Price is currently below both EMAs but near the 200 EMA, suggesting potential for a mean reversion bounce 📈
🔴 Resistance Zones to Watch:
Resistance Zone: 109.000 – 110.000
⛔ Historically rejected in late 2023 and again in early 2025
🧱 Acting as a supply zone — watch for rejection or breakout
ATH Supply Zone: 113.000 – 114.000
🚨 This is a major psychological and technical barrier
🫡 Marked as “NEW ATH” – would need strong momentum and fundamentals for a breakout above this level
📈 Price Action Expectations:
With strong support respected again, a bullish reversal toward 109.000 – 110.000 appears likely (as illustrated by the arrow).
If momentum continues, a retest of ATH zone is on the cards 🔭
However, a failure to hold support could lead to breakdown below 98.000 – watch closely 🔍
🧭 Strategic Insight
Bullish Bias while above support (98.000 zone)
Reversal Confirmation needed above 102.401 (200 EMA) and 103.725 (50 EMA)
Watch for rejection near 110.000 resistance before ATH test
📌 Final Note:
🧊 World Eyes on this Level – As highlighted on the chart, the current support area is under global observation, reinforcing its importance.
🕵️♂️ Stay alert for breakout volume and fundamental catalysts (e.g., Fed decisions, CPI, jobs data).

DXY USD INDEX FORECAST Q2 W18 Y25DXY USD INDEX FORECAST Q2 W18 Y25
Professional Risk Managers👋
Welcome back to another FRGNT chart update📈
Diving into some Forex setups using predominantly higher time frame order blocks alongside confirmation breaks of structure.
✅ U.S. dollar index is a measure of the value of the dollar against a basket of six foreign currencies.
✅The currencies are the Euro, Swiss franc, Japanese yen, Canadian dollar, British pound, and Swedish krona.
💡Here are some trade confluences📝
✅ Break an d close below July 2023 key 100.00 levels.
✅ Foresee a pull back to, weekly imbalance, daily order block, daily 50ema, weekly order block and or weekly 50 ema.
✅ Awaiting to identify a significant break of structure bullish to use the DXY as confluence for our trading week 18 of Q2 toward key points of interest mentioned above.
✅ Forecasting continued bearish pressure long term.
✅Initially bullish outlook however upon price turn around. DXY to break 100.000 level again.
🔑 Remember, to participate in trading comes always with a degree of risk, therefore as professional risk managers it remains vital that we stick to our risk management plan as well as our trading strategies.
Pairs to look out for -
EURUSD
USDCHF
USDJPY
USDCAD
GBPUSD
📈The rest, we leave to the balance of probabilities.
💡Fail to plan. Plan to fail.
🏆It has always been that simple.
❤️Good luck with your trading journey, I shall see you at the very top.
🎯Trade consistent, FRGNT X

DXYDXY Index
- Completed " 12345 " Impulsive Waves
- Break of Structure
- RSI - Divergence
- Bullish Channel as an corrective pattern in Short Time Frame
- Support Level
