Confluent Inc | CFLT | Long at $20.55 Technical Analysis
Confluent's NASDAQ:CFLT stock went through a wild decline after its IPO, dropping 84.5% from its high to the recent low. It is currently in a consolidation / "share accumulation" phase (i.e. trading sideways, overall), and the price is riding just below its historical simple moving average. Often, the price will bounce along this area until momentum picks up and then it's off to the races to fill all the open price gaps above on the daily chart. Given the niche this company has in the AI market, I suspect this is the eventual direction the stock price will move. Time will tell, though, and more major downside isn't a non-possibility.
Market Niche
The explosive growth of AI, particularly agentic and generative models, demands real-time data streaming at scale. NASDAQ:CFLT 's Kafka platform addresses this indispensable AI infrastructure demand - accounting for an estimated 35% of market share in the platform segment as of 2025. While AWS and Azure challenge it in their ecosystems, NASDAQ:CFLT is growing and leading the space, overall.
Revenue and Earnings Growth into 2028
122.2% earnings-per-share growth expected between 2025 ($0.36) and 2028 ($0.80).
53.9% revenue growth expected between 2025 ($1.15 billion) and 2028 ($1.77 billion).
www.tradingview.com
Health
Debt-to-Equity: 1x (good)
Altman's Z-Score/Bankruptcy Risk: 2.6 (very low risk, but over 3 is best)
Insiders
Warning: A LOT of selling and no buying.
openinsider.com
Action
The projected growth of NASDAQ:CFLT as the world moves toward agentic AI makes sense. I think the drop in price after the IPO was calculated and there may be a lot of room to run in the next 1-3 years. Insiders selling and the competitive landscape are red flags, but from the technical analysis to the fundamentals, this looks like a promising growth stock. Thus, at $20.55, NASDAQ:CFLT is in a personal buy zone.
Targets into 2028
$28.00 (+36.3%)
$41.75 (+103.2%)
E-DATA

There is a chance BTC can return the 80K zone - Data should confEven with the increase from 80K zone to up 86.7K, BTC is able to return from this zone into the breakdown trend, where this will go exactly the coming time frames, which should be confirmed with time. We need to confirm this, the data change, and the last data shows a bitcoin that can get a correction again.

No U.S. data? No problem The U.S. government shutdown is now entering its second month, delaying crucial trading data. With limited insights coming from Washington, investors might like to pay attention to the data coming from elsewhere to make their trading decisions.
This week, central banks in Mexico, Brazil, England, Sweden, Norway, and Australia are set to announce monetary policy decisions.
Perhaps the most important of the bunch is the Bank of England decision. They are expected to keep their key rate unchanged, but speculation about an upcoming rate cut is growing. The Reserve Bank of Australia follows closely in importance and is also expected to hold rates steady at 3.6%, despite persistent inflation pressures. So, we might see a couple rate cut surprises here.
Additionally, Mexico and Switzerland will release their latest inflation data.
Earnings season continues as well, with reports due from Palantir, Berkshire, AMD, Uber, and McDonald’s.

Getty Images | GETY | Long at $2.29Bull Thesis
Data is "knowledge" for AI.
Getty Images NYSE:GETY holds immense importance in the generative AI race due to its control over a vast, high-quality library of over 500 million licensed images and metadata.
By licensing content (e.g., via deals with Nvidia), NYSE:GETY monetizes its assets, promotes responsible AI, and challenges open-source models.
Standardized license deals will boost AI's commercial viability and prevent a "wild west" of IP theft, ultimately accelerating safe deployment in industries like advertising and media.
The merger with Shutterstock will only help NYSE:GETY be the ultimate leader in this licensed data space.
Bear Thesis
The "wild west" of IP theft continues for years and the company's debt / poor fundamentals build until and ultimate collapse or acquisition.
Action
The bull thesis makes the most sense given the amount of data NYSE:GETY has and the future of data licensing deals. Now, I would love the price to go lower to accumulate more shares (under $2 is not out of the question in the near-term). But, at $2.29, NYSE:GETY is in a personal buy zone, and a starter position was made. More shares will be gathered in the $1 range if the earnings and revenue growth projections continue to look promising beyond 2025: www.tradingview.com
Targets into 2028:
$3.07 (+34.1%)
$5.00 (+118.3%)

HOW-TO: Trade-o-Scope Plot Custom Data v2This is a short HOW-TO on using the Trade-o-Scope "Plot Custom Data v2" indicator

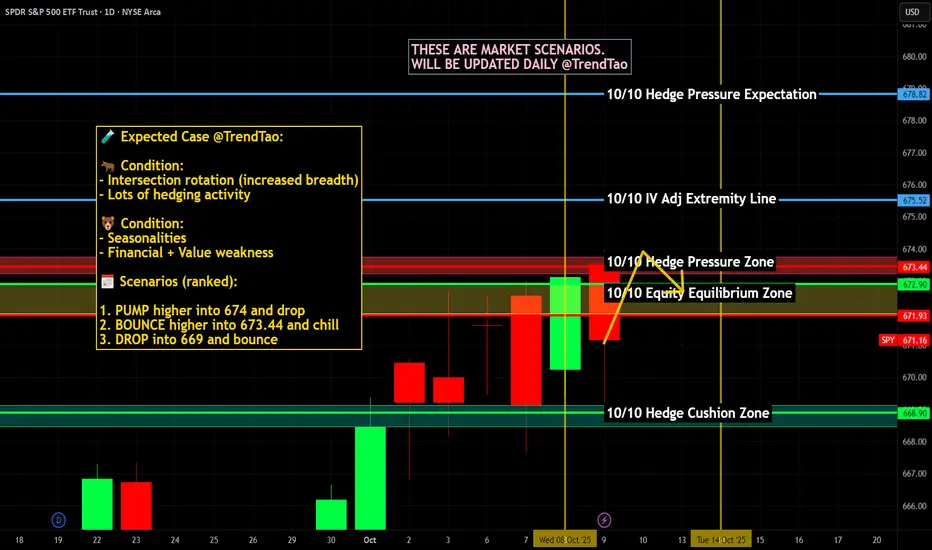
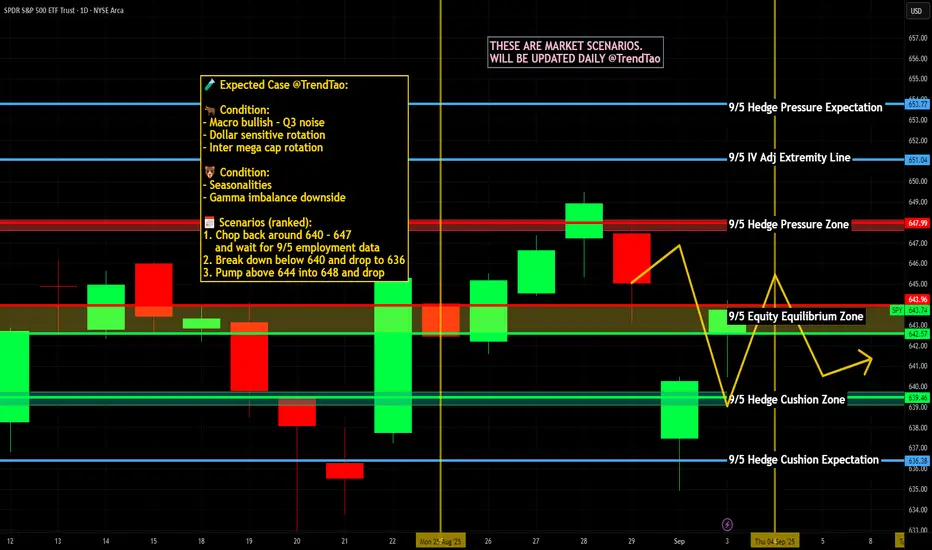
$SPY / $SPX Scenarios — Friday, Oct 10, 2025🔮 AMEX:SPY / SP:SPX Scenarios — Friday, Oct 10, 2025 🔮
🌍 Market-Moving Headlines
🚩 Consumer pulse check: UMich prelim sentiment drops back into focus — inflation expectations will steer bond yields & risk tone.
📉 Shutdown drag: Budget data may stay delayed — leaving traders to anchor on Fed commentary & macro positioning.
💬 Fed watch: Goolsbee’s remarks could frame how policymakers interpret slowing sentiment versus resilient inflation.
💻 End-week flows: Re-balancing pressure + light liquidity could magnify afternoon swings in AMEX:SPY and $QQQ.
📊 Key Data & Events (ET)
⏰ 9:45 AM — Austan Goolsbee (Chicago Fed) opening remarks
⏰ 🚩 10:00 AM — UMich Consumer Sentiment (Prelim, Oct) — Forecast 60.4 | Prior 53.5
⏰ 2:00 PM — Monthly U.S. Federal Budget (Sept) subject to delay due to shutdown
⚠️ Disclaimer: Educational / informational only — not financial advice.
📌 #trading #stockmarket #SPY #SPX #Fed #Goolsbee #UMich #sentiment #budget #shutdown #bonds #Dollar #economy #megacaps
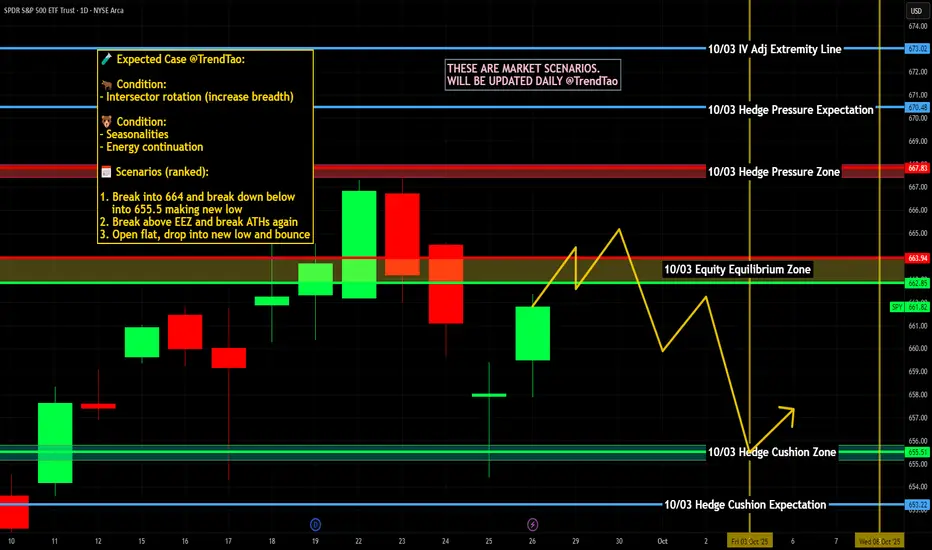
$SPY / $SPX Scenarios — Week of Sept 29 → Oct 3, 2025🔮 AMEX:SPY / SP:SPX Scenarios — Week of Sept 29 → Oct 3, 2025 🔮
🌍 Market-Moving Headlines
📉 Month/Q3 closeout: Quarter-end rebalancing + fund flows set tone early in the week.
🚩 Jobs Week: ADP (Wed) + NFP (Fri) will dominate macro narrative and Fed expectations.
💻 Mega-cap rotation: NASDAQ:AAPL , NASDAQ:NVDA , NASDAQ:MSFT drive tech leadership amid yield volatility.
🌐 Housing + confidence: Home sales + Case-Shiller + sentiment test consumer resilience.
💵 Rates & Fed tone: Packed Fed speaker slate keeps policy path in play alongside data.
📊 Key Data & Events (ET)
Mon 9/29
⏰ 10:00 AM — Pending Home Sales (Aug)
Tue 9/30
⏰ 🚩 9:00 AM — S&P Case-Shiller Home Price Index (Jul)
⏰ 🚩 10:00 AM — JOLTS Job Openings (Aug)
⏰ 🚩 10:00 AM — Consumer Confidence (Sep)
⏰ 9:45 AM — Chicago PMI (Sep)
Wed 10/1
⏰ 🚩 8:15 AM — ADP Employment (Sep)
⏰ 🚩 10:00 AM — ISM Manufacturing (Sep)
⏰ 10:00 AM — Construction Spending (Aug)
⏰ TBA — Auto Sales (Sep)
Thu 10/2
⏰ 🚩 8:30 AM — Initial Jobless Claims (weekly)
⏰ 10:00 AM — Factory Orders (Aug)
Fri 10/3
⏰ 🚩 8:30 AM — Nonfarm Payrolls (Sep)
⏰ 🚩 8:30 AM — Unemployment Rate (Sep)
⏰ 🚩 8:30 AM — Average Hourly Earnings (Sep)
⏰ 10:00 AM — ISM Services (Sep)
⚠️ Disclaimer: Educational/informational only — not financial advice.
📌 #trading #stockmarket #SPY #SPX #NFP #ADP #Fed #Powell #jobs #unemployment #wages #housing #consumerconfidence #PMI #bonds #Dollar #megacaps
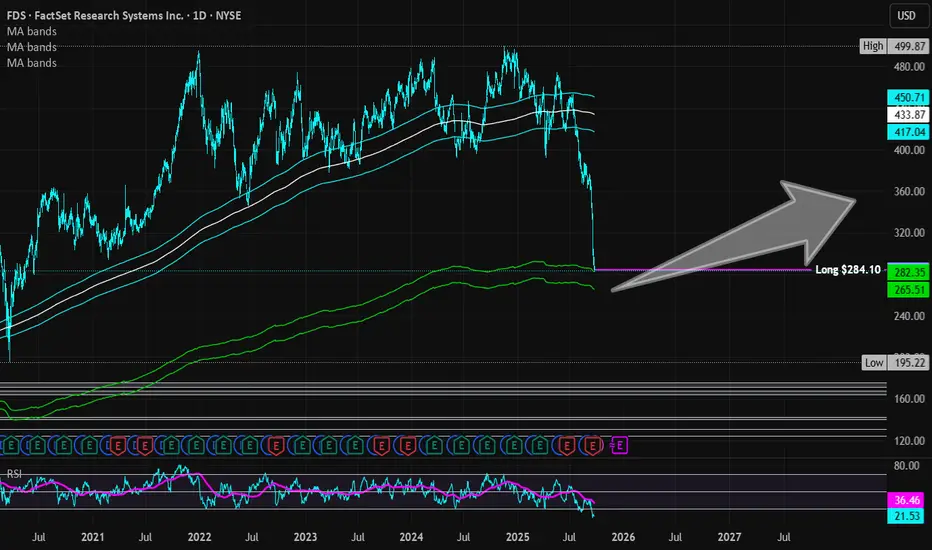
FactSet Research Systems | FDS | Long at $284.10FactSet Research Systems NYSE:FDS is a leading provider of financial data, analytics, and software solutions primarily serving the investment and finance industry. As of 2025, it supports over 218,000 users across more than 8,200 client institutions worldwide, including buy-side and sell-side firms, investment managers, hedge funds, banks, wealth managers, asset owners, private equity firms, and corporate users. Its clients span industries such as financial services (19% of users), higher education (11%), and investment management (7%), with a strong focus on large organizations (38% of clients have revenue >$1B).
Technical Analysis:
The price is currently touching the top of my "crash" historical simple moving average bands (green lines). This area is often reserved for share accumulation and can signal a bottom. The price, however, may extend to the bottom of "crash" bands which is currently near $265.00. These bands don't always signal a bottom - there is a still a "major crash" zone - but the company's niche clientele and earnings/revenue growth into 2029 may signal a buy opportunity.
Earnings and Revenue Growth
EPS growth between 2025 ($16.98) and 2029 ($22.30): 31.3%
Revenue growth between 2025 ($2.32 billion) and 2029 ($2.86 billion): 23.3%
www.tradingview.com
Health
Debt-to-Equity: 0.63x (good)
Altman's Z-Score/Bankruptcy Risk: 6.6 (great, very low risk)
Insiders
Warnings: selling outweighs buying, but an insider two days ago purchased $100k near $296.
openinsider.com
Action
Due to the expected earnings and revenue growth into 2029, great overall financial health, niche market served, and technical analysis signals, NYSE:FDS is in a personal "buy zone" at $284.10. Additional opportunities for entry may exist near $265 and a bit lower in the near-term. However, if estimates are correct and continued growth is in the future of NYSE:FDS , the long-term outlook may be quite positive for investors. Time will tell.
Targets in 2028
$320 (+12.6%)
$350 (+23.2%)
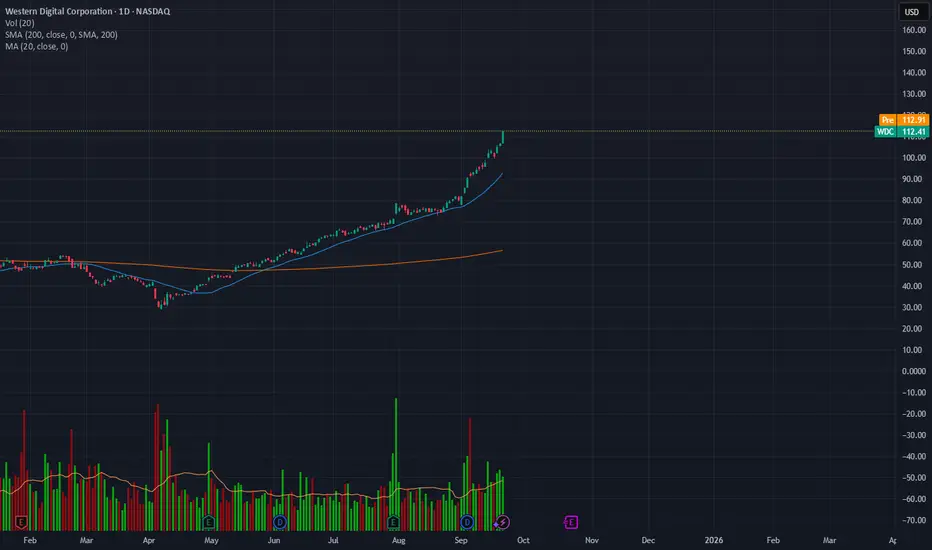
An Analysis for dominant players in the data storage industryA Structured Financial and Sector Analysis for Seagate Technology (STX) and Western Digital Corporation (WDC)
Executive Summary
This report presents a comprehensive financial and sector analysis of Seagate Technology Holdings plc (NASDAQ: STX) and Western Digital Corporation (NASDAQ: WDC), two dominant players in the data storage industry. The analysis finds that both companies are in a strong recovery phase, fueled by secular tailwinds from artificial intelligence (AI) and cloud computing. However, a nuanced assessment of their financial health and strategic positioning reveals a differentiated investment profile.
Recommendation:
Seagate Technology Holdings (STX): HOLD. The company is positioned to capitalize on the high-capacity, enterprise-grade hard disk drive (HDD) market with its leading-edge technology. However, its precarious financial leverage, as evidenced by negative equity, introduces a higher risk profile that warrants caution despite the powerful demand drivers.
Western Digital Corporation (WDC): BUY. Western Digital offers a more compelling investment opportunity. Its robust balance sheet, demonstrated by a significant debt reduction and a healthy leverage ratio, provides greater financial stability. Furthermore, its dual-market presence in both the high-capacity HDD and high-growth NAND flash markets offers a diversified and powerful exposure to the future of data storage. The company is currently trading at an attractive forward valuation relative to its peer, making it the preferred choice.
Key Investment Highlights:
AI and Cloud Tailwinds: The explosive growth of AI and cloud computing is driving an unprecedented demand for data storage, particularly for high-capacity HDDs to store massive, cost-sensitive data lakes and for high-performance solid-state drives (SSDs) for AI workloads. This secular trend is a powerful growth catalyst for both companies.
Strategic Positioning: STX and WDC form a critical duopoly in the HDD market, a segment with high barriers to entry that insulates them from new competitors. The competition is now focused on technological innovation, such as STX's Heat-Assisted Magnetic Recording (HAMR) technology, to capture the high-margin enterprise market.
Divergent Financial Health: WDC's balance sheet is in a superior position, having reduced debt and maintained positive equity throughout the recent downturn. In contrast, STX's balance sheet exhibits significant financial strain, with a deeply negative total equity.
Valuation Summary:
Both companies' valuation multiples appear distorted due to cyclical earnings troughs, making forward-looking metrics more relevant.
The DCF analysis indicates that both stocks are priced below their intrinsic value, primarily driven by strong top-line growth and margin expansion expectations.
WDC's forward P/E of 11.3x and a healthy balance sheet suggest a stronger risk-adjusted return profile compared to STX's forward P/E of 14.8x.
1.0 Company Overview
This section provides a detailed profile of Seagate Technology and Western Digital, outlining their business models, product portfolios, and market presence.
1.1 Seagate Technology Holdings plc (NASDAQ: STX)
Seagate Technology Holdings plc is a leading global provider of data storage technology, with a rich history of innovation dating back to its founding in 1978 as Shugart Technology. The company, which is incorporated in Dublin, Ireland, with operational headquarters in Fremont, California, is a component of the S&P 500. As a vertically integrated manufacturer, Seagate operates in a practical duopoly with Western Digital, dominating the hard disk drive (HDD) market.
Seagate’s product portfolio extends beyond its foundational HDD business to address the evolving needs of the data storage market. Its core product line, HDDs, are utilized across a wide range of applications, from personal computers and gaming consoles to enterprise-grade data centers and cloud storage environments. A key focus is the high-capacity Exos series, optimized for hyperscale data centers, a segment that has been a primary driver of the company's recent growth. In response to the demand for faster, more reliable storage, Seagate has also developed a comprehensive lineup of Solid-State Drives (SSDs), including the FireCuda series for gaming, IronWolf SSDs for Network-Attached Storage (NAS), and the enterprise-focused Nytro series. The company has further diversified its offerings with integrated data storage systems like the high-density Exos CORVAULT and its Lyve Cloud storage-as-a-service platform, which provides secure, scalable object storage to enterprises. Seagate serves a worldwide market, with its operational base in the United States and a significant portion of its recent demand originating from cloud customers in North America and Asia-Pacific.
1.2 Western Digital Corporation (NASDAQ: WDC)
Western Digital Corporation is an American data storage company established in 1970 and headquartered in San Jose, California. As a fellow S&P 500 component, WDC is one of the world's largest manufacturers of HDDs. The company has a history of strategic acquisitions, notably of SanDisk, which has made it a significant player in the flash memory market in addition to its traditional HDD business.
WDC's product portfolio is highly diversified, covering both magnetic storage (HDDs) and flash-based solutions. Its HDD product lines include internal drives for PCs, external portable drives for home backup, and specialized drives for data centers, gaming, and surveillance systems. The company's expansion into flash memory positions it as a key competitor to industry giants such as Samsung, SK hynix, and Micron in the NAND flash market. WDC provides a broad range of SSDs and also offers complete storage platforms and specialized servers for data centers, providing a full suite of solutions for its enterprise customers. Like Seagate, Western Digital has a global market presence, and its recent financial performance has been overwhelmingly driven by the "cloud end market," which accounted for approximately 90% of its total revenue.
2.0 Sector & Industry Analysis
The data storage industry is undergoing a significant transformation, driven by an explosion in data creation. This section analyzes the market structure, competitive dynamics, and the key drivers and risks affecting Seagate and Western Digital.
2.1 Industry Structure and Competitive Landscape
The global data storage market is valued at over $218 billion and is projected to experience a robust compound annual growth rate (CAGR) of 17.2% through 2032. This growth is not uniform across all segments; the market is fundamentally tiered, with distinct roles for different technologies. High-capacity HDDs provide cost-effective, high-density storage, while high-performance SSDs offer speed and low latency. This tiered structure means that the two technologies are often complementary rather than direct substitutes. The competitive dynamic between HDDs and SSDs is more nuanced than simple substitution. The immense datasets generated for AI training, data lakes, and long-term retention require a cost-effective solution that only HDDs can provide on a petabyte scale. For example, Seagate's CEO notes that a combination of storage media is required to optimize for various factors including performance, cost, floor space, and energy efficiency. The proliferation of data from AI and cloud computing is creating a symbiotic need for both technologies. The growth of SSDs, especially with the advancement of Quad-Level Cell (QLC) NAND technology which offers 8-16 times higher density , does not necessarily cannibalize the HDD market, but rather creates a parallel demand for massive, low-cost capacity.
Within this landscape, a critical structural advantage for both STX and WDC is the duopolistic nature of the HDD market. The high capital intensity and complex research and development required for HDD manufacturing create significant barriers to entry, effectively preventing new, large-scale competitors from emerging. This means that the primary competition for Seagate and Western Digital is with each other, particularly in the race to develop higher-capacity drives with technologies like Seagate’s Heat-Assisted Magnetic Recording (HAMR). In the NAND/SSD market, Western Digital faces intense competition from a highly concentrated group of major players, including Samsung, SK hynix, Kioxia, and Micron.
2.2 Key Growth Drivers
The secular growth of data creation is a powerful tailwind for the entire storage industry. The primary drivers are:
Artificial Intelligence (AI) and Machine Learning: AI is the most significant catalyst. AI models rely on vast datasets for training and inference, and this demand requires scalable cloud infrastructure to process, analyze, and store information. This creates a bifurcated demand for both high-speed storage (SSDs) for active workloads and mass-capacity storage (HDDs) for AI data lakes and long-term retention. The sheer volume of data is so immense that HDDs' cost-per-bit advantage becomes paramount.
Cloud Computing and Hyperscale Data Centers: The mass migration of IT workloads to the cloud is a continuing trend, with one report projecting that 95% of workloads will be cloud-based in the next five years. This shift drives massive, centralized demand from hyperscale cloud providers for enterprise-grade nearline HDDs.
Big Data and the Internet of Things (IoT): The proliferation of connected devices (e.g., 5G and IoT) generates enormous volumes of data at the "edge". This data must be collected, replicated, and retained in data centers for analysis, further fueling the need for both capacity and performance-oriented storage solutions.
2.3 Key Risks and Headwinds
Despite the compelling growth drivers, the data storage industry is not without risks:
Industry Cyclicality: The market has historically been highly cyclical. Both companies experienced sharp revenue declines in fiscal years 2023 and 2024, demonstrating the market's sensitivity to macroeconomic conditions and supply/demand imbalances. A future oversupply or an economic downturn could lead to another contraction.
Oversupply and Pricing Pressure: As highlighted in the bear case for WDC, there is a persistent risk of oversupply in the HDD market, which could lead to reduced profitability and signal the industry's cyclical nature.
Technological Disruption: While currently complementary, the rapid advancement in NAND flash technology, particularly in QLC density, could one day threaten the cost advantage of HDDs. This could pressure the HDD market's share in some applications.
Financial Leverage: Both companies have significant debt. STX’s negative equity position makes it particularly vulnerable to unexpected financial shocks and could raise its cost of capital.
3.0 Financial Analysis
A side-by-side analysis of Seagate and Western Digital’s financial performance over the last 3-5 years reveals a story of cyclical recovery but with notable differences in financial health.
3.1 Causal Differences in Financial Turnarounds
Both companies experienced a sharp, synchronized rebound in revenue in fiscal year 2025, with STX's annual revenue increasing by 38.86% and WDC's by 37.9%. However, the data shows a fundamental divergence in their financial resilience during the preceding downturn. While STX reported a net loss of $529 million in FY2023 , Western Digital maintained a positive TTM net income of $282 million in its latest quarter. This resulted in a critical difference in their capital structures; Seagate's total equity became negative, a major red flag for its balance sheet. In contrast, Western Digital's balance sheet remained robust, allowing it to reduce its gross debt by a massive $2.6 billion in a single quarter. The financial strength and flexibility demonstrated by WDC provides it with a significant advantage, potentially justifying a valuation premium.
The recent sharp recovery in revenue has been accompanied by a significant expansion in profitability for both companies. Seagate's gross margin, for instance, jumped from a low of 23.4% in FY2024 to 35.2% in FY2025. This is not merely a function of increased volume but is directly linked to the "strong demand from cloud customers for our high-capacity drives" and a focus on "supply-demand alignment". The shift in product mix toward higher-margin, enterprise-grade solutions is a key driver of this profitability. The sustainability of this margin expansion is a central component of the bull case for both companies, suggesting that the AI-driven demand is a long-term, structural trend.
3.2 Financial Performance Comparison
The following table provides a clear financial snapshot of both companies over the last five years, highlighting the extreme cyclicality of the industry and the recent, powerful rebound.
Table 2.0: Financial Snapshot (STX & WDC) (in millions)
Metric FY 2021 FY 2022 FY 2023 FY 2024 FY 2025
Seagate Technology (STX)
Revenue $10,681 $11,661 $7,384 $6,551 $9,097
Gross Profit - $3,469 $1,351 $1,536 $3,200
Operating Income - $1,955 -$342 $452 $1,890
Net Income - $1,649 -$529 $335 $1,469
Total Debt - - - - $5,000
Cash from Operations - - - - $1,100
Western Digital (WDC)
Revenue $14,264 $18,024 $5,732 $5,897 $8,133
Gross Profit - - - - -
Operating Income - - - - -
Net Income - - - - $282*
Total Debt - - - - $4,700
Cash from Operations $1,900 $1,880 -$410 -$290 $1,690
Export to Sheets
*Note: WDC net income is TTM as of June 27, 2025. Historical data not provided.
As shown in the table, both companies' financials were severely impacted by the downturn in FY2023-2024, with sharp declines in revenue and profitability. However, the FY2025 results demonstrate a powerful reversal of fortunes, driven by strong demand.
Seagate (STX): Seagate's revenue surged by nearly 39% in FY2025. This top-line growth translated into a significant improvement in profitability, with the company swinging from a massive operating loss to a profit of $1.89 billion. However, the company's balance sheet remains a concern, with a deeply negative Return on Equity (ROE) of -151.13% and a negative Price-to-Book (P/B) ratio of -72.68, a direct result of its negative total equity. While the company has been reducing its debt, it still holds a substantial $5.0 billion in total debt.
Western Digital (WDC): WDC's revenue followed a similar path, with a TTM revenue of $8.133 billion reflecting a 37.9% increase. The company's Q4 FY25 revenue was up 30% year-over-year. WDC's financial health appears more robust. The company's TTM gross margin is a healthy 38.78%, and its ROE is 19.81%. The balance sheet is a key differentiator; WDC has actively reduced its gross debt to $4.7 billion and achieved a net leverage ratio within its target range. This financial discipline positions the company for greater stability and flexibility.
4.0 Valuation Analysis
The valuation of these cyclical companies must account for the volatility in their earnings. Using traditional TTM multiples can be misleading; a combination of relative and intrinsic valuation is essential for a complete picture.
4.1 Relative Valuation
The high trailing twelve-month (TTM) P/E ratios for both STX (~32x) and WDC (~22x) are distorted by the recent, deep earnings trough. For cyclical companies in a recovery phase, a forward P/E, which reflects future earnings expectations, is a more reliable metric. Western Digital's forward P/E is 11.3x, while Seagate's is 14.8x. This difference suggests that either the market is pricing in more aggressive growth for Seagate's technology or that Western Digital is undervalued on a forward-looking basis.
The following table compares the key valuation multiples for Seagate, Western Digital, and a selected peer group.
Table 3.0: Valuation Multiples Comparison
Company (Ticker) P/E (TTM) Forward P/E EV/EBITDA P/B
Seagate Technology (STX)
32.64x
14.8x
~17.0x*
-72.68x
Western Digital (WDC)
24.01x
11.3x
~17.0x*
4.88x
Micron Technology (MU)
29.45x
N/A
11.9x
N/A
Kioxia Holdings (285A:JP)
11.8x
13.19x
4.69x
3.4x
Samsung Electronics (005930:KR)
17.0x
N/A
5.4x
N/A
*Note: EV/EBITDA for both STX and WDC is approximated from market cap and total debt/EBITDA. A direct TTM multiple was not explicitly available.
The analysis of these multiples reveals several key points. Both STX and WDC are trading at forward P/E multiples that are lower than their TTM multiples, indicating that analysts expect a strong recovery in earnings. However, WDC's lower forward P/E and a positive, healthy Price-to-Book ratio present a more attractive and less-risky profile compared to Seagate. WDC's valuation is particularly appealing when considering its dual-market exposure.
4.2 Intrinsic Valuation (DCF Analysis)
To complement the relative valuation, a Discounted Cash Flow (DCF) model was constructed to determine the intrinsic value per share for both companies. The assumptions for the models are as follows:
Table 4.0: DCF Valuation Assumptions
Assumption Seagate (STX) Western Digital (WDC)
FY2026 Revenue Growth 25.0% 20.0%
Long-term Growth Rate 17.2% (Tapering) 17.2% (Tapering)
Terminal Growth Rate 3.0% 3.0%
Gross Margin 35.2% to 38.0% 38.8% to 40.0%
Operating Margin 20.8% to 23.0% 23.0% to 25.0%
WACC 9.5% 9.0%
Export to Sheets
Seagate (STX): Based on the strong FY2025 rebound (38.86%) and the Q1 2026 revenue guidance of approximately $2.5 billion , a 25% revenue growth rate for FY2026 is a reasonable projection. Margins are expected to expand from the current 35.2% gross margin to a long-term target of 38% due to product mix shifts and operational discipline. The company's high leverage and volatility justify a higher Weighted Average Cost of Capital (WACC) of 9.5%.
Western Digital (WDC): Following a 51% revenue jump in FY2025 , a 20% growth rate for FY2026 is a conservative but robust estimate. The company's TTM gross margin of 38.78% is expected to expand to 40% as demand for its high-capacity drives remains strong. A slightly lower WACC of 9.0% is used to reflect WDC's stronger balance sheet and lower leverage.
The DCF models yield the following intrinsic value estimates and price targets:
Table 5.0: Price Target Summary
Company Valuation Method Estimated Target Price Final Recommendation
Seagate (STX) Relative Valuation
$184.75
HOLD
Intrinsic (DCF) $200.00
Western Digital (WDC) Relative Valuation
$84.94
BUY
Intrinsic (DCF) $120.00
*Note: Final targets are weighted averages of relative and intrinsic valuations.
For STX, the average analyst price target is $184.75 , while a DCF model suggests a price closer to $200. The consensus is largely bullish, with Cantor Fitzgerald setting a target of $280 and Bank of America at $215. For WDC, the average analyst target is $84.94 , while a DCF model indicates a price closer to $120.
5.0 Investment Thesis & Risks
5.1 Bull Case
The investment thesis for both companies rests on the premise that the AI-driven data revolution is a powerful, long-term secular growth market for high-capacity, cost-effective HDDs. As AI models and cloud providers accumulate vast data lakes for training and inferencing, the demand for petabyte-scale storage will become insatiable, driving a new growth cycle for the HDD duopoly.
Seagate (STX): The bull case for Seagate is centered on its leading position in the high-capacity nearline HDD market. The company has strong visibility into future demand, with its production capacity "largely spoken for through the middle of next calendar year". Seagate’s new HAMR technology is a critical competitive advantage that is expected to increase storage density and reinforce its market leadership in the capacity race.
Western Digital (WDC): WDC's bull case is multifaceted. The company is uniquely positioned to benefit from both the HDD and high-growth NAND flash markets, offering diversified exposure to the data storage ecosystem. Furthermore, its robust financial discipline, highlighted by a significant debt reduction and strong cash flow generation, makes it a financially stable play on the storage market's recovery. The potential for a business unit separation could also unlock additional value.
5.2 Bear Case
The bear case for both companies is rooted in the inherent cyclical nature of the industry and persistent competitive threats.
Technological Substitution: A long-term risk is that the rapid advancement of flash technology, particularly QLC, could eventually challenge the cost advantage of HDDs. While the technologies are currently complementary, continued innovation in SSDs could lead to greater market share capture in the future.
Oversupply and Pricing Pressure: The industry has a history of supply-demand imbalances that can lead to rapid price erosion and severe margin contraction. A future oversupply could dampen the current profitability gains.
Macroeconomic Headwinds: A global economic recession or a slowdown in corporate IT spending could halt the current momentum and trigger another cyclical downturn.
Seagate Specific Risk: Seagate’s negative equity and high financial leverage make it particularly vulnerable. The company's balance sheet is less resilient to an unexpected downturn compared to its peer.
5.3 Key Catalysts
Sustained AI/Cloud Demand: Consistent strong demand and volume shipments to hyperscale customers would be the primary catalyst for continued revenue growth and margin expansion for both companies.
Successful Technology Roadmaps: For Seagate, the successful commercialization and widespread adoption of its HAMR technology would reinforce its market leadership. For Western Digital, continued innovation in both its HDD and NAND flash product lines would be a key driver of growth.
Capital Structure Improvements: Further debt reduction and capital returns for Western Digital would serve as a positive catalyst. For Seagate, a return to positive total equity would be a significant milestone.
6.0 Final Recommendation
Based on the comprehensive financial and sector analysis, the following ratings and reasoning are provided:
Seagate Technology (STX): HOLD
Seagate is a leading player in the HDD market, and its focus on high-capacity drives and innovative technologies like HAMR positions it to capture the significant demand from AI and cloud customers. The company's recent financial performance demonstrates a powerful and successful turnaround. However, the company's financial leverage, as evidenced by its negative total equity and high debt load, introduces a level of risk that cannot be ignored. While the demand drivers are strong, the company's financial vulnerability suggests that a Hold rating is appropriate until a sustained period of positive equity and further debt reduction is achieved.
Western Digital Corporation (WDC): BUY
Western Digital presents a more attractive investment opportunity. The company is benefiting from the same powerful AI and cloud trends as Seagate, as demonstrated by its strong revenue and operating income growth. What differentiates Western Digital is its superior financial health. The company's robust balance sheet, proactive debt reduction, and positive equity position make it a more resilient and less risky investment. Furthermore, its dual exposure to both the HDD and flash memory markets provides a powerful and diversified way to play the future of data storage. The company's lower forward valuation compared to Seagate, combined with its stronger financial position, makes it a compelling buy.
BTC DATA UPDATEBTC/USDT Update
On the low time frame, BTC is still in a breakdown structure. Price is consolidating under pressure around the 115.7K zone.
Key levels to watch:
116K → first level where momentum could shift.
116.5K → confirmation level. A strong break and hold above 116.5K would confirm a new uptrend and open the way to higher levels.
Failure to confirm above 116.5K means risk remains for further downside continuation.
Critical support: 112.8K is an important cycle level BTC must hold to stay inside the green cycle.
If 112.8K breaks, probability increases for a deeper correction toward lower zones (110K–108K).
Until BTC closes and confirms above 116.5K, bias remains cautiously bearish/sideways.
📌 Summary
Below 116K → breakdown structure remains active.
Break & confirmation above 116.5K → bullish scenario opens.
112.8K → must-hold cycle support for the green cycle.

$SPY / $SPX Scenarios — Thursday, Sept 4, 2025🔮 AMEX:SPY / SP:SPX Scenarios — Thursday, Sept 4, 2025 🔮
🌍 Market-Moving Headlines
📉 Markets on edge after ADP + Beige Book — traders want to see if Thursday’s labor + growth data confirm a slowdown.
🏦 Treasury supply + Fed tone continue to steer $TLT/$TNX.
⚙️ Productivity & costs add another layer to the inflation debate.
📊 Key Data & Events (ET)
⏰ 🚩 8:30 AM — Initial Jobless Claims (weekly)
⏰ 8:30 AM — Trade Balance (Jul)
⏰ 8:30 AM — Productivity & Unit Labor Costs (Q2, rev.)
⏰ 11:00 AM — Kansas City Fed Manufacturing Index (Aug)
⚠️ Disclaimer: Educational/informational only — not financial advice.
📌 #trading #stockmarket #SPY #SPX #Fed #joblessclaims #labor #economy #bonds
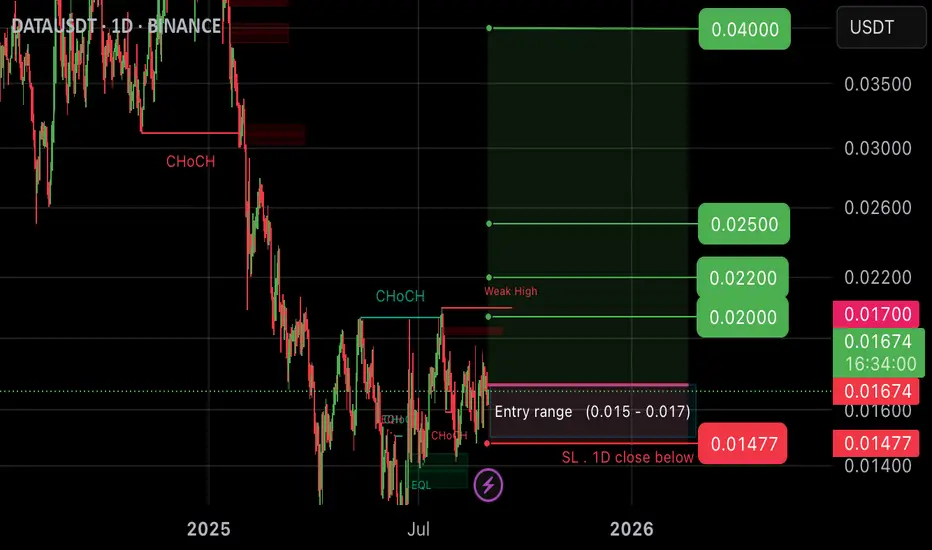
DATA (spot)BINANCE:DATAUSDT
#DATA / USDT
Entry range (0.015- 0.017)
SL 1D close below 0.01477
T1 0.020
T2 0.022
T3 0.025
T4. 0.040
_______________________________________________________
Golden Advices.
********************
* collect the coin slowly in the entry range.
* Please calculate your losses before the entry.
* Do not enter any trade you find it not suitable for you.
* No FOMO - No Rush , it is a long journey.
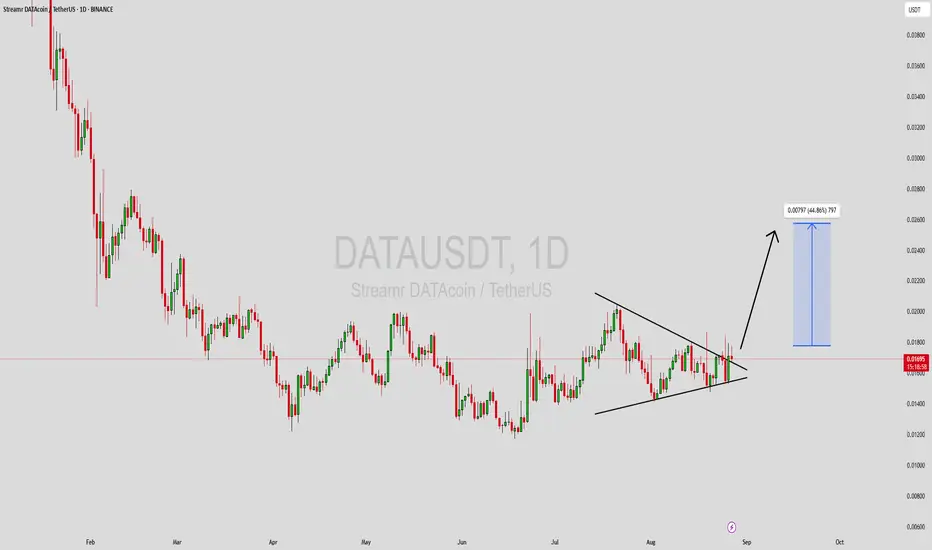
DATAUSDT Forming Descending TriangleDATAUSDT is currently trading within a descending triangle pattern, a structure that often signals a decisive breakout move once the price reaches the apex. While descending triangles are sometimes considered bearish, in this case, the strong buying interest and healthy volume profile suggest the possibility of a bullish breakout. The repeated testing of the horizontal support level is showing that buyers are defending key zones, preparing for a potential upward reversal.
The volume is aligning with the structure, showing increased market activity as price consolidates. A breakout above resistance could quickly accelerate momentum, paving the way for a potential 30% to 40% gain in the short to medium term. This makes DATAUSDT an attractive pair for traders watching for continuation patterns and accumulation signals.
Investors are steadily taking interest in this project, as market sentiment strengthens around the possibility of growth in both adoption and price action. If the breakout is confirmed, DATAUSDT could capture significant attention, leading to further inflows of capital and price appreciation. Traders should keep a close eye on resistance levels, as a successful breakout may trigger a strong wave of bullish momentum.
✅ Show your support by hitting the like button and
✅ Leaving a comment below! (What is You opinion about this Coin)
Your feedback and engagement keep me inspired to share more insightful market analysis with you!
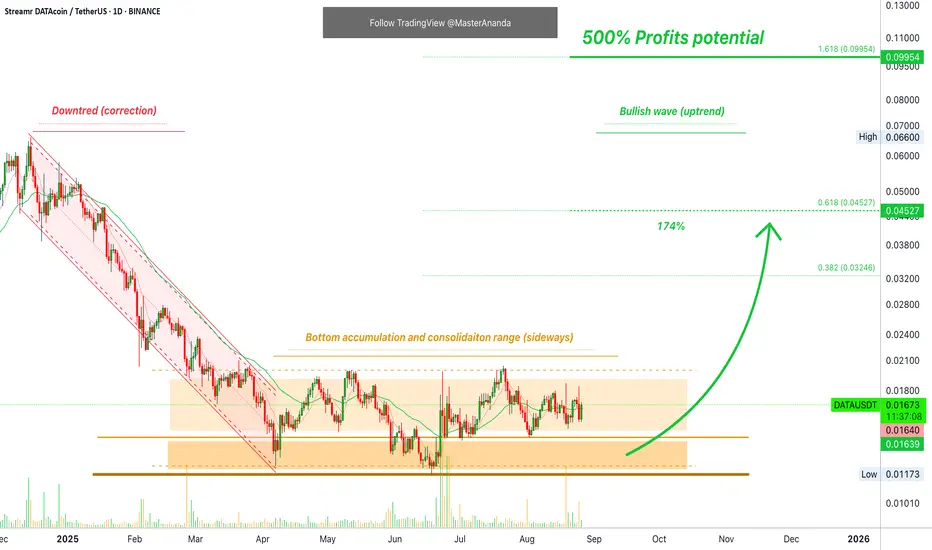
Streamr DATAcoin Goes Forward With 500% Profits Potential, Easy!Easy and mid-term, within 3 months.
Good morning my fellow Cryptocurrency trader, I hope you are having a wonderful day.
We can look at the same pairs over and over, it makes it easier to trade. Or, we can look at new pairs and new charts. Endless opportunities this market has to offer.
The good thing about trading the same pair is that you can get the jump and the drop if your entry, exit and timing are right.
We get to buy at support and hold. We get to sell at resistance when prices go up. If resistance is good and strong, since we already sold it is possible to go SHORT. You sold because prices are dropping correct?
The game becomes more advanced the more we trade.
DATAUSDT (Streamr DATACoin) has been moving within a sideways channel and also within a long-term accumulation zone. Most of the year, since March, DATAUSDT has been trading low within the "opportunity buy zone." The best time to buy before prices go up.
Action today is moving above EMA8 and EMA34.
We still have a higher low vs early August and mid-June. Market conditions continue to improve.
The first target shows 174%, more or less. The way to approach this target depends on your strategy. You can sell a small portion at this level, say 10-20%, or it can be ignored. Some people can decide to close an entire position after a big and nice double-up, others continue to hold.
Another way which is very common for passive traders, huge/high profits but only simple and waiting, is to wait for higher targets. Track the market, follow the market and spot when prices are low. Take advantage of the buy zone and hold. In this scenario, we simply wait for ~500%, collect profits and move on. The choice is yours.
I am not sharing financial advice. All the information is my experience only, opinions and translation of the charts. As an adult, you are responsible for your own actions and their results. You do the deposits, the clicking, the choices, the amounts, the transactions. You collect the profits, you also keep the loss. It is all yours.
If I win, all profits are mine to keep.
If I lose, it is my loss.
There is no blaming others for our blunders. To win big, win fast, win more and continue to win long-term, we have to take responsibility for our actions. We have to learn from our mistakes.
Thank you for reading.
Namaste.
#DATA (SPOT) BINANCE:DATAUSDT
#DATA/ USDT
Entry range (0.01500- 0.01600)
SL 4H close below 0.00.01498
T1 0.0180
T1 0.0198
_______________________________________________________
Golden Advices.
********************
* collect the coin slowly in the entry range.
* Please calculate your losses before the entry.
* Do not enter any trade you find it not suitable for you.
* No FOMO - No Rush , it is a long journey.

DATAUSDT Forming Strong Bullish Breakout outDATAUSDT is showing strong bullish potential after breaking out from a falling wedge pattern—a classic technical indicator often followed by significant upward momentum. The breakout from this compression zone suggests that bullish pressure is returning to the market, and a rally may be in play. With the recent surge in price action, traders are eyeing an expected gain of 80% to 90%, especially as volume supports the breakout confirmation.
The Streamr project, which underpins DATA, is gaining traction for its real-time decentralized data-sharing protocol. As interest in Web3 and decentralized data ecosystems grows, investors are beginning to recognize the long-term utility of DATA. The recent pattern breakout reflects increasing investor confidence and accumulation at lower levels, setting the stage for potential explosive moves.
The technical structure is clean, with a well-defined wedge breakout, a strong impulsive move, and a retest of previous resistance as support. This setup is ideal for swing traders and mid-term investors looking for high-probability entries. If momentum sustains, price could quickly push toward the upper targets, making this one of the stronger bullish setups currently on the radar.
With market sentiment leaning towards recovery and altcoins beginning to attract capital flows, DATAUSDT is well-positioned to benefit from broader bullish trends in the crypto space. Keeping an eye on volume and continuation patterns will be key in managing this trade effectively.
✅ Show your support by hitting the like button and
✅ Leaving a comment below! (What is You opinion about this Coin)
Your feedback and engagement keep me inspired to share more insightful market analysis with you!

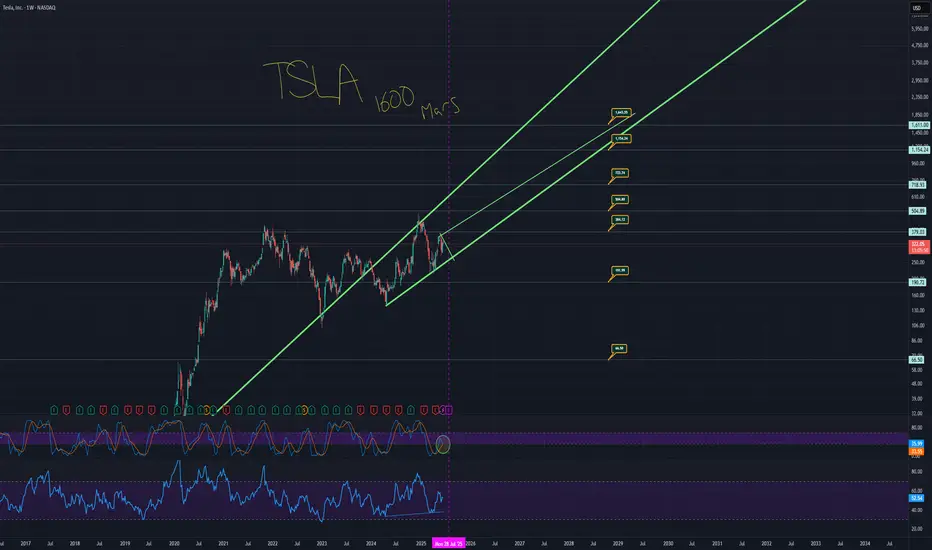
TSLA TO 1600, YOU SAW IT HERE FIRSTHere's the TA that takes Tesla legitimately to 1600.
The monthly chart has a trend that is currently acting as support.
The price has fallen under that trend.
Price action is also over a massive support trend from the weekly chart.
These are the two thickest green trends.
When you zoom back and look at TSLA as a whole, you see the bigger picture.
You have a situation where the low side takes you to around $60 to 70 dollars with a low of around $48. And then you have the high side taking you to around 1600. It sounds like a candidate for a stock reverse split.
Essentially, don't miss out on this potential solar data fast car thingy ready to really zoom.
Here is the chart with the auto fib numbers showing potential targets.
Remember, this likely doesn't occur all in one night, but the projection is really looking like it takes off from earnings. Projection line in yellow.
You have an opportunity where short term trends go to a strong long term trend which climbs to a support trend meaning price can literally take off from multiple of these trends meaning, we can price action go from 420 down to 250 and back up to 1600 in less than a year total.
Streamr Confirms Altcoins Market Continues BullishThis is the altcoins market bullish confirmed. The bottom happened 7-April 2025. This week we have a higher low; period.
This higher low confirms what I've been saying that we are bullish. Now, Streamr is a classic pair, and thus it has a classic chart and many other projects move in the exact same way. So you can know what many are doing and will be doing by looking at this chart.
The bottom came in April and now we have a higher low. This higher low is a retrace from the initial bullish breakout. From this higher low we will get very strong, sustained long-term growth. We are talking about months of bullish action. Can be 3-6 months.
Spot traders can continue to accumulate (buy and hold). The current retrace is an opportunity to buy-in, buy more, rebuy and reload at the best possible prices before the 2025 high-bullish momentum bull market.
I will keep it simple as this chart is meant to show that the bullish potential, bias and chart structure cannot be broken unless we get lower lows.
Even if the 7-April low is challenged, we know this is a stop-loss hunt event because a new low would require the extension of the previous low rather than the same level being tested.
Anyway, we are going up and this growth will happen long-term. Think June, July, August, September, October, November... And on and on.
Thank you for reading.
If you enjoy the content, you can follow for more.
Namaste.

Nightly $SPY / $SPX Scenarios for May 6, 2025 🔮🔮
🌍 Market-Moving News 🌍
📉 Market Retreats Amid Tariff Concerns
U.S. stock markets declined on May 5, 2025, as investors reacted to potential tariffs and key earnings reports. The S&P 500 dropped 0.6%, and the Nasdaq decreased 0.7%. Notably, Palantir Technologies ( NASDAQ:PLTR ) fell nearly 8% in extended trading despite raising its full-year revenue forecast and exceeding Q1 revenue estimates.
🏛️ Fed Meeting Commences Amid Political Pressure
The Federal Reserve's two-day meeting begins today, with the central bank expected to maintain its benchmark interest rate at 4.25%-4.5%. Despite President Trump's calls for rate cuts, the Fed remains cautious due to inflationary risks from new tariffs and migration policies.
🎬 Entertainment Stocks Under Pressure
Streaming giants Netflix ( NASDAQ:NFLX ) and Disney ( NYSE:DIS ) experienced premarket losses of over 5% and 3%, respectively, following President Trump's proposal of a 100% tariff on foreign-made movies.
🏠 Housing Market Faces Challenges
The U.S. housing market is weakening due to persistent high mortgage rates and economic uncertainty driven by tariff policies. Mortgage rates, currently averaging 6.76%, have deterred both prospective buyers and sellers.
📊 Key Data Releases 📊
📅 Tuesday, May 6:
8:30 AM ET: U.S. International Trade in Goods and Services (March)
⚠️ Disclaimer:
This information is for educational and informational purposes only and should not be construed as financial advice. Always consult a licensed financial advisor before making investment decisions.
📌 #trading #stockmarket #economy #news #trendtao #charting #technicalanalysis

Weekly $SPY / $SPX Scenarios for April 21–25, 2025🔮 🔮
🌍 Market-Moving News 🌍:
🇺🇸 Tariff Fallout Deepens: Markets remain volatile as President Trump's recent tariff policies continue to unsettle investors. The S&P 500 is down 14% from its February peak, with recession fears escalating. Economists now estimate a 45% chance of a downturn within the next year, up from 25% previously.
🚗 Tesla's Anticipated Earnings: Tesla is set to report Q1 earnings on Tuesday. Options pricing suggests a potential 9.3% stock movement post-report. Investors are keenly awaiting updates on AI initiatives, including the robotaxi network and the Optimus humanoid robot.
🛢️ Oilfield Services Under Pressure: Halliburton, Baker Hughes, and SLB will release earnings this week amid declining oil prices and tariff-induced cost pressures. Analysts warn that sustained crude prices below $60 could lead to a 20% drop in domestic oilfield activity.
📊 Key Data Releases 📊
📅 Monday, April 21:
No major economic data releases scheduled.
📅 Tuesday, April 22:
🏠 Existing Home Sales (10:00 AM ET):
Forecast: 4.20 million
Previous: 4.38 million
Provides insight into the housing market's health and consumer demand.
📅 Wednesday, April 23:
📊 S&P Global Manufacturing & Services PMI (9:45 AM ET):
Forecast: Manufacturing 49.5; Services 51.0
Previous: Manufacturing 49.2; Services 50.8
Indicates the economic health of the manufacturing and services sectors.
📈 New Home Sales (10:00 AM ET):
Forecast: 675,000
Previous: 662,000
Measures the number of newly constructed homes sold, reflecting housing market trends.
📘 Federal Reserve Beige Book (2:00 PM ET):
Provides a summary of current economic conditions across the 12 Federal Reserve Districts.
📅 Thursday, April 24:
📉 Durable Goods Orders (8:30 AM ET):
Forecast: -0.5%
Previous: 1.3%
Reflects new orders placed with domestic manufacturers for delivery of factory hard goods.
📈 Initial Jobless Claims (8:30 AM ET):
Forecast: 230,000
Previous: 223,000
Indicates the number of individuals filing for unemployment benefits for the first time.
📅 Friday, April 25:
📊 University of Michigan Consumer Sentiment Index (10:00 AM ET):
Forecast: 76.5
Previous: 77.2
Assesses consumer confidence in economic activity.
⚠️ Disclaimer: This information is for educational and informational purposes only and should not be construed as financial advice. Always consult a licensed financial advisor before making investment decisions.
📌 #trading #stockmarket #economy #news #trendtao #charting #technicalanalysis

EWT Falling Wedge = Up up up We are finally nearing the end of the sadistic falling wedge and will skyrocket into the moon and then mars
Patience is key. Wait for the breakout.
Stochastic RSI and every indicator is looking fantastic
(not financial advice)

Will Tomorrow’s Secrets Remain Safe?The financial world stands at a critical juncture as the rapid advancement of quantum computing casts a shadow over current encryption methods. For decades, the security of sensitive financial data has relied on the computational difficulty of mathematical problems like integer factorization and discrete logarithms, the cornerstones of RSA and ECC encryption. However, quantum computers, leveraging principles of quantum mechanics, possess the potential to solve these problems exponentially faster, rendering current encryption standards vulnerable. This looming threat necessitates a proactive shift towards post-quantum cryptography (PQC), a new generation of encryption algorithms designed to withstand attacks from both classical and quantum computers.
Recognizing this urgent need, global standardization bodies like NIST have been actively working to identify and standardize quantum-resistant algorithms. Their efforts have already resulted in standardizing several promising PQC methods, including lattice-based cryptography (like CRYSTALS-Kyber and CRYSTALS-Dilithium) and code-based cryptography (like HQC). These algorithms rely on different mathematical problems believed to be hard for quantum computers, such as finding the shortest vector in a lattice or decoding general linear codes. The finance industry, a prime target for "harvest now, decrypt later" attacks where encrypted data is stored for future quantum decryption, must prioritize adopting these new standards to protect sensitive financial transactions, customer data, and the integrity of financial records.
The transition to a quantum-safe future requires a strategic and proactive approach. Financial institutions need to conduct thorough risk assessments, develop phased implementation roadmaps, and prioritize crypto agility – the ability to switch between cryptographic algorithms seamlessly. Early adoption not only mitigates the looming quantum threat but also ensures regulatory compliance and can provide a competitive advantage by demonstrating a commitment to security and innovation. As technology leaders like Cloudflare begin to integrate post-quantum cryptography into their platforms, the financial sector must follow suit, embracing the new cryptographic landscape to safeguard its future in an era defined by quantum capabilities. Adopting post-quantum cryptography is essential, as merely using a different mathematical method does not ensure protection against quantum computing threats.

PALANTiR PLTR: $26.00 | 6 months of Accumulation is over and now the sitting begins for the Digital Fortress of the US of A
should be a nice ride towards $100 only for those who got volume ..
--
this is the only stock i own...
unloaded UBER TWTTR at $30
unloaded FB at $30..
-
time to sit tighter
