EUR/USD Rejection at Resistance Bearish Move AheadPrice rejected the 1.1550–1.1590 resistance zone and failed to hold support. If momentum continues, a drop toward 1.1500 looks likely. Watching for bearish confirmation on lower timeframes.
E-signal

EURJPY Massive Short! SELL!
My dear followers,
This is my opinion on the EURJPY next move:
The asset is approaching an important pivot point 178.30
Bias - Bearish
Technical Indicators: Supper Trend generates a clear short signal while Pivot Point HL is currently determining the overall Bearish trend of the market.
Goal - 177.50
About Used Indicators:
For more efficient signals, super-trend is used in combination with other indicators like Pivot Points.
Disclosure: I am part of Trade Nation's Influencer program and receive a monthly fee for using their TradingView charts in my analysis.
———————————
WISH YOU ALL LUCK

USDCHF What Next? BUY!
My dear followers,
I analysed this chart on USDCHF and concluded the following:
The market is trading on 0.8037 pivot level.
Bias - Bullish
Technical Indicators: Both Super Trend & Pivot HL indicate a highly probable Bullish continuation.
Target - 0.8048
Safe Stop Loss - 0.8031
About Used Indicators:
A super-trend indicator is plotted on either above or below the closing price to signal a buy or sell. The indicator changes color, based on whether or not you should be buying. If the super-trend indicator moves below the closing price, the indicator turns green, and it signals an entry point or points to buy.
Disclosure: I am part of Trade Nation's Influencer program and receive a monthly fee for using their TradingView charts in my analysis.
———————————
WISH YOU ALL LUCK

GBPJPY Technical Analysis! SELL!
My dear friends,
Please, find my technical outlook for GBPJPY below:
The instrument tests an important psychological level 202.90
Bias - Bearish
Technical Indicators: Supper Trend gives a precise Bearish signal, while Pivot Point HL predicts price changes and potential reversals in the market.
Target - 201.75
About Used Indicators:
Super-trend indicator is more useful in trending markets where there are clear uptrends and downtrends in price.
Disclosure: I am part of Trade Nation's Influencer program and receive a monthly fee for using their TradingView charts in my analysis.
———————————
WISH YOU ALL LUCK

EURGBP My Opinion! BUY!
My dear friends,
EURGBP looks like it will make a good move, and here are the details:
The market is trading on 0.8775 pivot level.
Bias - Bullish
Technical Indicators: Supper Trend generates a clear long signal while Pivot Point HL is currently determining the overall Bullish trend of the market.
Goal - 0.8787
Recommended Stop Loss - 0.8768
About Used Indicators:
Pivot points are a great way to identify areas of support and resistance, but they work best when combined with other kinds of technical analysis
Disclosure: I am part of Trade Nation's Influencer program and receive a monthly fee for using their TradingView charts in my analysis.
———————————
WISH YOU ALL LUCK

AUDUSD Under Pressure! SELL!
My dear followers,
This is my opinion on the AUDUSD next move:
The asset is approaching an important pivot point 0.6535
Bias - Bearish
Technical Indicators: Supper Trend generates a clear short signal while Pivot Point HL is currently determining the overall Bearish trend of the market.
Goal - 0.6506
About Used Indicators:
For more efficient signals, super-trend is used in combination with other indicators like Pivot Points.
Disclosure: I am part of Trade Nation's Influencer program and receive a monthly fee for using their TradingView charts in my analysis.
———————————
WISH YOU ALL LUCK

USDCAD - Bulls Preparing to Reload!📈USDCAD has been moving within a clear ascending channel, maintaining a well-defined bullish structure over the past months.
After rejecting the upper bound, price is now pulling back toward a key confluence area, the intersection of the orange support zone and the lower trendline of the channel.
🏹This zone is crucial, as it has acted as a strong demand area in the past, where buyers consistently regained control. From here, I’ll be looking for long setups, aiming for a continuation toward the upper bound of the channel once more.
⚔️As long as the price holds above the orange zone, the overall bullish momentum remains intact.
⚠️ Disclaimer: This is not financial advice. Always do your own research and manage risk properly.
📊All Strategies Are Good; If Managed Properly!
~Richard Nasr

BTCUSDT.P - November 11, 2025BTCUSDT.P is showing potential for a short-term bullish reversal after rebounding from the $100,238–$100,616 support zone. A buy limit is positioned near $100,983, targeting a move toward the $112,833 partial profit zone and the $121,599 profit level. A confirmed breakdown below the $94,111–$98,115 stop zone would invalidate this bullish setup and indicate renewed downside momentum.
Risk Assessment: Moderate — Price action suggests early bullish recovery signs, but confirmation depends on holding above $100,900 and sustaining momentum past $112,800.

XRPUSDT.P - November 7, 2025XRPUSDT.P is showing early signs of a short-term bullish reversal after rebounding from the ascending trendline support near the $2.16–$2.18 zone. A buy limit is positioned around $2.219, aiming for a move toward the $2.283 partial profit zone and the $2.336 profit level.
A confirmed breakout above $2.283 would validate bullish continuation, while a drop below $2.158 would invalidate this setup and signal renewed downside pressure.
Risk Assessment: Moderate — structure leans bullish, but sustained strength above the partial profit level is needed for confirmation.

AUDCAD: Bearish Continuation & Short Trade
AUDCAD
- Classic bearish formation
- Our team expects fall
SUGGESTED TRADE:
Swing Trade
Sell AUDCAD
Entry Level - 0.9158
Sl - 0.9169
Tp - 0.9138
Our Risk - 1%
Start protection of your profits from lower levels
Disclosure: I am part of Trade Nation's Influencer program and receive a monthly fee for using their TradingView charts in my analysis.
❤️ Please, support our work with like & comment! ❤️

BTCUSDT.P - November 10, 2025BTCUSDT.P is currently consolidating near the $106,300 area, showing potential for a short-term bearish retracement. A rejection from this zone could trigger a move lower toward the $105,440 support and the $104,300 profit level (short). However, a decisive breakout and close above $106,660 would invalidate the short setup and open the path for a continuation higher toward the $108,280 profit level (long).

USDJPY: Short Signal with Entry/SL/TP
USDJPY
- Classic bearish formation
- Our team expects pullback
SUGGESTED TRADE:
Swing Trade
Short USDJPY
Entry - 154.03
Sl - 154.30
Tp - 153.56
Our Risk - 1%
Start protection of your profits from lower levels
Disclosure: I am part of Trade Nation's Influencer program and receive a monthly fee for using their TradingView charts in my analysis.
❤️ Please, support our work with like & comment! ❤️

GOLD A Fall Expected! SELL!
My dear subscribers,
This is my opinion on the GOLD next move:
The instrument tests an important psychological level 4078.3
Bias - Bearish
Technical Indicators: Supper Trend gives a precise Bearish signal, while Pivot Point HL predicts price changes and potential reversals in the market.
Target - 4050.7
My Stop Loss - 4094.1
About Used Indicators:
On the subsequent day, trading above the pivot point is thought to indicate ongoing bullish sentiment, while trading below the pivot point indicates bearish sentiment.
Disclosure: I am part of Trade Nation's Influencer program and receive a monthly fee for using their TradingView charts in my analysis.
———————————
WISH YOU ALL LUCK

GBPCAD Will Collapse! SELL!
My dear friends,
Please, find my technical outlook for GBPCAD below:
The price is coiling around a solid key level - 1.8524
Bias - Bearish
Technical Indicators: Pivot Points High anticipates a potential price reversal.
Super trend shows a clear sell, giving a perfect indicators' convergence.
Goal - 1.8464
About Used Indicators:
The pivot point itself is simply the average of the high, low and closing prices from the previous trading day.
Disclosure: I am part of Trade Nation's Influencer program and receive a monthly fee for using their TradingView charts in my analysis.
———————————
WISH YOU ALL LUCK

EURGBP Set To Fall! SELL!
My dear subscribers,
My technical analysis for EURGBP is below:
The price is coiling around a solid key level - 0.8812
Bias - Bearish
Technical Indicators: Pivot Points High anticipates a potential price reversal.
Super trend shows a clear sell, giving a perfect indicators' convergence.
Goal - 0.8800
My Stop Loss - 0.8819
About Used Indicators:
By the very nature of the supertrend indicator, it offers firm support and resistance levels for traders to enter and exit trades. Additionally, it also provides signals for setting stop losses
Disclosure: I am part of Trade Nation's Influencer program and receive a monthly fee for using their TradingView charts in my analysis.
———————————
WISH YOU ALL LUCK

EURUSD Buyers In Panic! SELL!
My dear subscribers,
This is my opinion on the EURUSD next move:
The instrument tests an important psychological level 1.1552
Bias - Bearish
Technical Indicators: Supper Trend gives a precise Bearish signal, while Pivot Point HL predicts price changes and potential reversals in the market.
Target - 1.1510
About Used Indicators:
On the subsequent day, trading above the pivot point is thought to indicate ongoing bullish sentiment, while trading below the pivot point indicates bearish sentiment.
Disclosure: I am part of Trade Nation's Influencer program and receive a monthly fee for using their TradingView charts in my analysis.
———————————
WISH YOU ALL LUCK

EURUSD Trading Opportunity! SELL!
My dear subscribers,
EURUSD looks like it will make a good move, and here are the details:
The market is trading on 1.1567 pivot level.
Bias - Bearish
Technical Indicators: Both Super Trend & Pivot HL indicate a highly probable Bearish continuation.
Target - 1.1523
About Used Indicators:
The average true range (ATR) plays an important role in 'Supertrend' as the indicator uses ATR to calculate its value. The ATR indicator signals the degree of price volatility.
Disclosure: I am part of Trade Nation's Influencer program and receive a monthly fee for using their TradingView charts in my analysis.
———————————
WISH YOU ALL LUCK

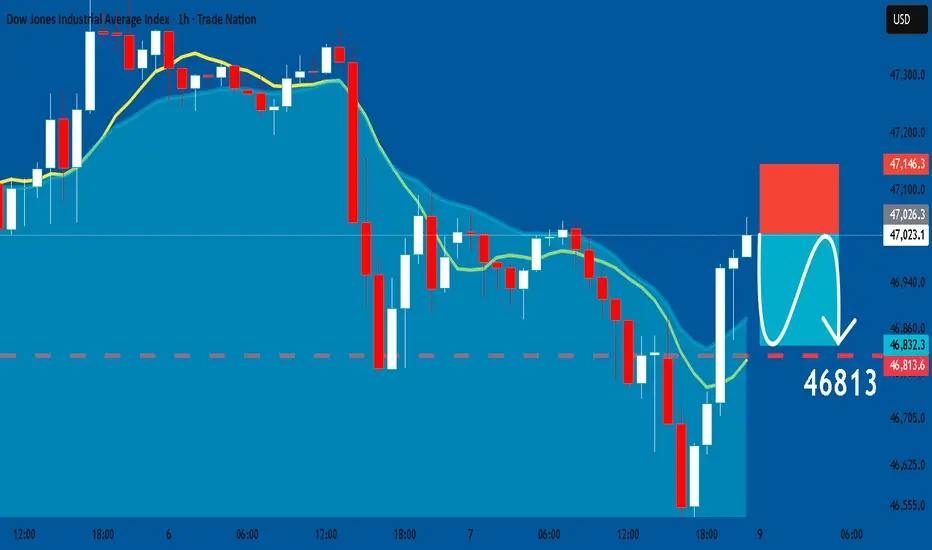
US30: Short Signal Explained
US30
- Classic bearish pattern
- Our team expects retracement
SUGGESTED TRADE:
Swing Trade
Sell US30
Entry - 47023
Stop - 47146
Take - 46813
Our Risk - 1%
Start protection of your profits from lower levels
Disclosure: I am part of Trade Nation's Influencer program and receive a monthly fee for using their TradingView charts in my analysis.
❤️ Please, support our work with like & comment! ❤️
BTCUSD: Bearish Continuation & Short Signal
BTCUSD
- Classic bearish setup
- Our team expects bearish continuation
SUGGESTED TRADE:
Swing Trade
Short BTCUSD
Entry Point - 10376
Stop Loss - 10482
Take Profit - 10200
Our Risk - 1%
Start protection of your profits from lower levels
Disclosure: I am part of Trade Nation's Influencer program and receive a monthly fee for using their TradingView charts in my analysis.
❤️ Please, support our work with like & comment! ❤️

NATGAS Set To Grow! BUY!
My dear friends,
Please, find my technical outlook for NATGAS below:
The price is coiling around a solid key level - 4.324
Bias - Bullish
Technical Indicators: Pivot Points Low anticipates a potential price reversal.
Super trend shows a clear buy, giving a perfect indicators' convergence.
Goal - 4.368
Safe Stop Loss - 4.295
About Used Indicators:
The pivot point itself is simply the average of the high, low and closing prices from the previous trading day.
Disclosure: I am part of Trade Nation's Influencer program and receive a monthly fee for using their TradingView charts in my analysis.
———————————
WISH YOU ALL LUCK

QQQ Will Explode! BUY!
My dear followers,
This is my opinion on the QQQ next move:
The asset is approaching an important pivot point 609.75
Bias - Bullish
Technical Indicators: Supper Trend generates a clear long signal while Pivot Point HL is currently determining the overall Bullish trend of the market.
Goal - 622.40
About Used Indicators:
For more efficient signals, super-trend is used in combination with other indicators like Pivot Points.
Disclosure: I am part of Trade Nation's Influencer program and receive a monthly fee for using their TradingView charts in my analysis.
———————————
WISH YOU ALL LUCK

APPLE The Target Is UP! BUY!
My dear friends,
My technical analysis for APPLE is below:
The market is trading on 268.53 pivot level.
Bias - Bullish
Technical Indicators: Both Super Trend & Pivot HL indicate a highly probable Bullish continuation.
Target - 271.24
Recommended Stop Loss - 266.96
About Used Indicators:
A pivot point is a technical analysis indicator, or calculations, used to determine the overall trend of the market over different time frames.
Disclosure: I am part of Trade Nation's Influencer program and receive a monthly fee for using their TradingView charts in my analysis.
———————————
WISH YOU ALL LUCK

ETHUSDT.P - November 9, 2025ETHUSDT.P is showing potential for a short-term bearish reversal after testing resistance near the $3,400 zone. A sell short limit is placed at $3,348, targeting a move down toward the $3,307 partial profit zone and the $3,214 profit level. A sustained move above the $3,416–$3,432 stop level would invalidate this short setup and signal renewed bullish momentum.
Risk Assessment: Moderate to High — Structure leans bearish, but confirmation requires a breakdown below $3,348 and continued weakness toward $3,300.
Note: Do not trade if the price touches the invalidation level first before the sell short limit order.
