GBPUSD - Bears Loading at a Major Confluence???⚔️GBPUSD is approaching a powerful intersection where the upper blue trendline meets the green supply zone. This area has acted as a strong barrier before, and price is now retesting it from below.
📉If this confluence holds, the bearish pressure is likely to kick back in. As long as the rejection is confirmed, we will be looking for trend-following shorts, with the next objective being the lower bound of the rising channel, where buyers may attempt to step in again.
A very clean and technical setup, now we wait for confirmation. 📉🔥
What do you think, will the supply zone hold, or will GBPUSD break higher this time? 👀
⚠️ Disclaimer: This is not financial advice. Always do your own research and manage risk properly.
📚 Stick to your trading plan regarding entries, risk, and management.
Good luck! 🍀
All Strategies Are Good; If Managed Properly!
~Richard Nasr
E-signal

GBPAUD On The Rise! BUY!
My dear friends,
Please, find my technical outlook for GBPAUD below:
The instrument tests an important psychological level 2.0138
Bias - Bullish
Technical Indicators: Supper Trend gives a precise Bullish signal, while Pivot Point HL predicts price changes and potential reversals in the market.
Target - 2.0217
About Used Indicators:
Super-trend indicator is more useful in trending markets where there are clear uptrends and downtrends in price.
Disclosure: I am part of Trade Nation's Influencer program and receive a monthly fee for using their TradingView charts in my analysis.
———————————
WISH YOU ALL LUCK

EURUSD – Testing Channel ResistanceEURUSD has reached the upper boundary of a well-defined ascending channel on the H4 chart, where price is currently showing early signs of exhaustion. As long as buyers fail to secure a clean breakout above this resistance line, the structure favors a potential corrective move back toward the mid-range or even the lower channel support.
One of the supporting factors for this scenario is the recent bullish momentum in the U.S. Dollar Index (DXY). If the DXY continues its upward trend, it could strengthen the bearish pressure on EURUSD and increase the likelihood of a downward reaction from this resistance zone.
I’ll be watching for rejection patterns, a shift in structure, or lower-timeframe sell confirmations before considering deeper downside targets.
This is not financial advice—just sharing my analysis.

AUDNZD: Long Signal Explained
AUDNZD
- Classic bullish setup
- Our team expects bullish continuation
SUGGESTED TRADE:
Swing Trade
Long AUDNZD
Entry Point - 1.1432
Stop Loss - 1.1424
Take Profit - 1.1446
Our Risk - 1%
Start protection of your profits from lower levels
Disclosure: I am part of Trade Nation's Influencer program and receive a monthly fee for using their TradingView charts in my analysis.
❤️ Please, support our work with like & comment! ❤️

GBPCHF A Fall Expected! SELL!
My dear subscribers,
GBPCHF looks like it will make a good move, and here are the details:
The market is trading on 1.0672 pivot level.
Bias - Bearish
Technical Indicators: Both Super Trend & Pivot HL indicate a highly probable Bearish continuation.
Target - 1.0639
About Used Indicators:
The average true range (ATR) plays an important role in 'Supertrend' as the indicator uses ATR to calculate its value. The ATR indicator signals the degree of price volatility.
Disclosure: I am part of Trade Nation's Influencer program and receive a monthly fee for using their TradingView charts in my analysis.
———————————
WISH YOU ALL LUCK

CADJPY Will Explode! BUY!
My dear friends,
CADJPY looks like it will make a good move, and here are the details:
The market is trading on 111.25 pivot level.
Bias - Bullish
Technical Indicators: Supper Trend generates a clear long signal while Pivot Point HL is currently determining the overall Bullish trend of the market.
Goal - 111.43
Recommended Stop Loss - 111.15
About Used Indicators:
Pivot points are a great way to identify areas of support and resistance, but they work best when combined with other kinds of technical analysis
Disclosure: I am part of Trade Nation's Influencer program and receive a monthly fee for using their TradingView charts in my analysis.
———————————
WISH YOU ALL LUCK

BTCUSDT.P - December 4, 2025Bitcoin is in a short‑term uptrend on the 15‑minute chart, respecting a rising trendline from the recent swing low and currently pausing in a shallow pullback after an impulsive advance. Price is trading just above a key support band around 90,500–91,000, with a higher consolidation zone projected near 96,000–97,000 and major resistance and upside target identified in the 113,000 area. A clean bounce from the trendline and a sustained move above 92,000–93,000 would confirm continuation momentum toward the 96,000–97,000 range, while a decisive break below the trendline and 90,500 would invalidate the immediate bullish structure and open room for a deeper retracement toward 88,500–86,500 before any new long setups are considered.

GOLD: Bearish Continuation & Short Signal
GOLD
- Classic bearish pattern
- Our team expects retracement
SUGGESTED TRADE:
Swing Trade
Sell GOLD
Entry - 4217.9
Stop - 4226.7
Take - 4201.0
Our Risk - 1%
Start protection of your profits from lower levels
Disclosure: I am part of Trade Nation's Influencer program and receive a monthly fee for using their TradingView charts in my analysis.
❤️ Please, support our work with like & comment! ❤️

GBPCAD Trading Opportunity! SELL!
My dear followers,
This is my opinion on the GBPCAD next move:
The asset is approaching an important pivot point 1.8586
Bias - Bearish
Technical Indicators: Supper Trend generates a clear short signal while Pivot Point HL is currently determining the overall Bearish trend of the market.
Goal - 1.8525
About Used Indicators:
For more efficient signals, super-trend is used in combination with other indicators like Pivot Points.
Disclosure: I am part of Trade Nation's Influencer program and receive a monthly fee for using their TradingView charts in my analysis.
———————————
WISH YOU ALL LUCK

EURUSD What Next? SELL!
My dear subscribers,
This is my opinion on the EURUSD next move:
The instrument tests an important psychological level 1.1662
Bias - Bearish
Technical Indicators: Supper Trend gives a precise Bearish signal, while Pivot Point HL predicts price changes and potential reversals in the market.
Target - 1.1641
My Stop Loss - 1.1675
About Used Indicators:
On the subsequent day, trading above the pivot point is thought to indicate ongoing bullish sentiment, while trading below the pivot point indicates bearish sentiment.
Disclosure: I am part of Trade Nation's Influencer program and receive a monthly fee for using their TradingView charts in my analysis.
———————————
WISH YOU ALL LUCK

SILVER - The ATH Retest Opportunity!!!🚀Silver has officially broken above its all-time high - a major milestone for the metal. But nothing moves in a straight line, and healthy trends always correct before continuing higher.
📉Price is now on its way to retest the previous ATH zone in red, which aligns perfectly with the rising trendline. This creates a powerful confluence area where buyers have historically stepped back in with strength.
⚔️As Silver taps into this intersection, we will be looking for trend-following longs, expecting the bulls to defend the zone and push toward new highs.
🏹The structure is bullish. The trendline is intact. The level is clean.
Now we wait for the reaction… will the bulls reload here? 🤔
⚠️ Disclaimer: This is not financial advice. Always do your own research and manage risk properly.
📚 Stick to your trading plan regarding entries, risk, and management.
Good luck! 🍀
All Strategies Are Good; If Managed Properly!
~Richard Nasr

US100 / NASDAQ TodayNasdaq 100 (NDX) Analysis - December 3, 2024
Based on today's market data, here's a comprehensive analysis of the Nasdaq 100:
Today's Performance
The Nasdaq 100 is currently trading around 25,513 points. The index closed at 25,555.86, gaining 213.01 points (+0.84%) as of 5:16 PM EST on December 2.
Today's Trading Range:
Opening: 25,449.87
High: 25,622.58
Low: 25,369.36
Volume: 380,862,001
52-Week Performance
Over the past 52 weeks, the index has ranged from 16,542.20 to 26,182.10, representing an 18.91% gain over the past 12 months.
Technical Signals
Based on technical indicators and moving averages, the daily buy/sell signal is "Strong Buy".
2024 Performance Context
The Nasdaq-100 finished 2024 higher by 25% following a return of nearly 54% in 2023—its best two-year stretch since 1998 and 1999—and eclipsed 20,000 for the first time.
However, December saw a reversal with approximately three out of every five indexes experiencing losses, averaging down 4.0%. This followed the Fed's hawkish tone, as it reduced the number of expected rate cuts in 2025 to two from four.
Recent Index Reconstitution
On December 13, 2024, Nasdaq announced that Palantir Technologies, MicroStrategy, and Axon Enterprise will be added to the index effective December 23, 2024, while Illumina, Super Micro Computer, and Moderna will be removed.
Market Context
The index is currently navigating a period of consolidation after reaching near-record highs. Key factors influencing the market include Federal Reserve interest rate policy, valuations of mega-cap tech stocks (particularly the "Magnificent 7"), and ongoing developments in AI technology.
DISCLAIMER: This analysis is for informational purposes only and should not be considered financial advice. Trading in financial instruments involves significant risk, including the potential loss of principal. Past performance does not guarantee future results. Market conditions can change rapidly, and the information provided may not reflect real-time market movements. Always conduct your own research and consider consulting with a qualified financial advisor before making any investment decisions. The author is not a financial advisor and assumes no responsibility for any investment decisions made based on this analysis.

Gold (XAUUSD) – Eyeing a Sweep Toward 4273–4281Gold continues to show intraday strength after holding above recent higher-low structure.
The current bullish leg appears corrective in nature, with price aiming toward the
4273–4281 supply zone highlighted on the chart.
From a fundamental perspective, demand for gold remains supported as markets weigh
the possibility of softer U.S. economic data and expectations of future Fed easing in 2026.
Risk-off flows have also kept buyers active on dips. As long as price holds its internal
bullish structure, a push into the overhead imbalance remains likely.
I’ll be watching how price reacts once it reaches the 4273–4281 zone — this area could
offer a reaction or potential short-term reversal depending on order flow.

BTCUSDT.P - December 3, 2025Bitcoin is attempting to reverse from a prior downtrend, trading above a short-term rising trendline and pushing into a key resistance band around 93,000–94,300. The chart highlights a bullish scenario targeting the 112,000 area if price can clear this resistance and hold above the stop zone near 97,800. A failure to break and sustain above resistance, coupled with a break below the trendline, would favor a corrective move back toward the 87,300 profit level marked on the chart. Momentum is improving but remains vulnerable around resistance, making this a pivotal area for trend confirmation.

EURAUD: Long Signal with Entry/SL/TP
EURAUD
- Classic bullish formation
- Our team expects growth
SUGGESTED TRADE:
Swing Trade
Buy EURAUD
Entry Level - 1.7713
Sl - 1.7703
Tp - 1.7731
Our Risk - 1%
Start protection of your profits from lower levels
Disclosure: I am part of Trade Nation's Influencer program and receive a monthly fee for using their TradingView charts in my analysis.
❤️ Please, support our work with like & comment! ❤️

NZDUSD Under Pressure! SELL!
My dear subscribers,
NZDUSD looks like it will make a good move, and here are the details:
The market is trading on 0.5745 pivot level.
Bias - Bearish
My Stop Loss - 0.5751
Technical Indicators: Both Super Trend & Pivot HL indicate a highly probable Bearish continuation.
Target - 0.5733
About Used Indicators:
The average true range (ATR) plays an important role in 'Supertrend' as the indicator uses ATR to calculate its value. The ATR indicator signals the degree of price volatility.
Disclosure: I am part of Trade Nation's Influencer program and receive a monthly fee for using their TradingView charts in my analysis.
———————————
WISH YOU ALL LUCK

EURJPY What Next? BUY!
My dear followers,
I analysed this chart on EURJPY and concluded the following:
The market is trading on 180.19 pivot level.
Bias - Bullish
Technical Indicators: Both Super Trend & Pivot HL indicate a highly probable Bullish continuation.
Target - 180.71
About Used Indicators:
A super-trend indicator is plotted on either above or below the closing price to signal a buy or sell. The indicator changes color, based on whether or not you should be buying. If the super-trend indicator moves below the closing price, the indicator turns green, and it signals an entry point or points to buy.
Disclosure: I am part of Trade Nation's Influencer program and receive a monthly fee for using their TradingView charts in my analysis.
———————————
WISH YOU ALL LUCK

GOLD Trading Opportunity! BUY!
My dear friends,
My technical analysis for GOLD is below:
The market is trading on 4192.2 pivot level.
Bias - Bullish
Technical Indicators: Both Super Trend & Pivot HL indicate a highly probable Bullish continuation.
Target - 4210.4
Recommended Stop Loss - 4182.6
About Used Indicators:
A pivot point is a technical analysis indicator, or calculations, used to determine the overall trend of the market over different time frames.
Disclosure: I am part of Trade Nation's Influencer program and receive a monthly fee for using their TradingView charts in my analysis.
———————————
WISH YOU ALL LUCK

USDJPY: Short Trading Opportunity
USDJPY
- Classic bearish setup
- Our team expects bearish continuation
SUGGESTED TRADE:
Swing Trade
Short USDJPY
Entry Point - 156.06
Stop Loss - 156.38
Take Profit - 155.51
Our Risk - 1%
Start protection of your profits from lower levels
Disclosure: I am part of Trade Nation's Influencer program and receive a monthly fee for using their TradingView charts in my analysis.
❤️ Please, support our work with like & comment! ❤️

BTCUSDT.P - December 2, 2025Bitcoin remains in a broader downtrend but is currently consolidating between resistance around 87,400–87,700 and support near 83,400. The chart outlines a potential breakout toward 91,375 if price can reclaim and hold above the consolidation range, with that level marked as the primary profit target. Conversely, a failure at resistance and a break below 83,400 would confirm renewed bearish momentum toward the lower profit zone around 80,000. Trend structure is neutral-short term within this range, and a decisive move outside the highlighted consolidation band is needed to confirm the next directional leg.

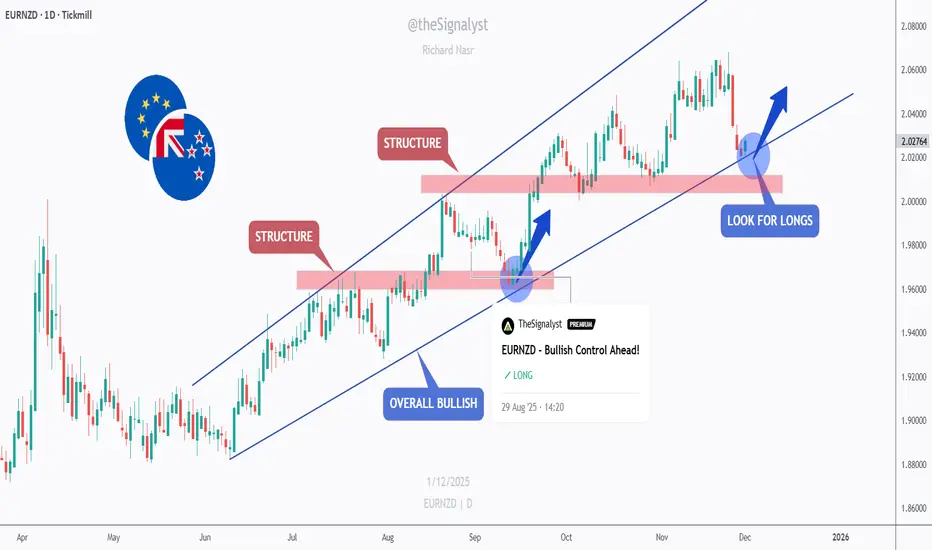
EURNZD - Bulls Eyeing the Structure Zone... Again!📈EURNZD remains overall bullish, moving cleanly inside its rising channel. Each dip toward the lower bound has acted as a strong continuation zone, with buyers consistently stepping in to drive the next upward wave.
🏹As price approaches the lower trendline and the red structure zone, we will be looking for trend-following longs. This area has served as a key support multiple times, making it a high-probability level for the bulls to re-enter the market.
⚔️As long as EURNZD holds above this structure, the bullish trend remains intact and a new push toward higher highs becomes the most likely scenario. Only a confirmed break below the structure would weaken the bullish outlook.
Now we wait for the reaction at structure… will the bulls defend it once again? 🤔
⚠️ Disclaimer: This is not financial advice. Always do your own research and manage risk properly.
📚 Stick to your trading plan regarding entries, risk, and management.
Good luck! 🍀
All Strategies Are Good; If Managed Properly!
~Richard Nasr
GBPUSD: Short Trade Explained
GBPUSD
- Classic bearish formation
- Our team expects fall
SUGGESTED TRADE:
Swing Trade
Sell GBPUSD
Entry Level - 1.3272
Sl - 1.3284
Tp - 1.3245
Our Risk - 1%
Start protection of your profits from lower levels
Disclosure: I am part of Trade Nation's Influencer program and receive a monthly fee for using their TradingView charts in my analysis.
❤️ Please, support our work with like & comment! ❤️

BITCOIN - PRESSURE BUILDING - SHORT SQUEEZE INCOMING?Traders,
Bitcoin might be preparing a short squeeze. Let’s walk through the flow, structure, math, and correlations step-by-step so you understand what is happening and why it matters.
1. What Happened
Bitcoin dumped from 96k → 80.6k last week. Price then bounced and is now trading around 87k.
Under the surface:
Stablecoin-Margined Futures (USDT-M)
Since 27 Oct:
OI increased from 225k → 280k contracts
That’s +55k contracts (~24% increase)
CVD went down, not up
Meaning:
These new positions were mostly shorts
The market added leveraged short exposure during the dump
Interpretation:
USDT-M traders attacked the move lower aggressively. Increasing OI + dropping CVD = new sellers dominating, not buyers.
Coin-Margined Futures (BTC-M)
Since 27 Oct:
OI and CVD both dropped from 7.41B → 5.90B
BTC-M is usually “higher conviction” demand
A drop in BTC-M CVD means
Longs closing
Capitulation
Reduced bullish positioning
Interpretation:
Native BTC longs stepped aside. Short-term leverage traders pressed the downside.
Spot + Futures CVD (27 Oct → 21 Nov)
Spot CVD ↓
Futures CVD ↓
Price ↓
All making lower lows and lower highs
This was a clean, correlated downtrend.
2. The First Major Shift: Spot CVD Divergence
Since 21 November:
Spot CVD:
Higher highs
Higher lows
Rising together with price
Indicates real demand stepping in
Stablecoin Futures (USDT-M):
Still making lower lows
Still pressing shorts
Still fighting the spot buyers
This is the key:
Spot = real money
Futures = leveraged speculation
Rising spot CVD vs falling futures CVD = absorption pattern
Meaning:
Strong hands buy
Weak shorts keep selling
Price rises anyway
The pressure builds
Shorts eventually run out
The squeeze begins
This is one of the cleanest pre-squeeze structures you can get.
3. The Math: Fibonacci Rotation Logic
Let’s break down the structure.
(A → B → C Structure)
A = 116k (27 Oct)
B = 98.710
C = 107.403 (retracement)
The retrace sits at 0.5.
The reciprocal extension is 2.0
The 2.0 extension lands exactly at the 21 Nov wick (~81k)
This is a perfect harmonic rotation.
(X → Z → A Extension)
X = 06 Oct high
Z = 18 Oct low
A = 27 Oct high
Fibonacci extension from X → Z → A:
1.618 extension = 80.544
It matches the 2.0 from the ABC structure
It matches the 0.886 retracement on the HTF
Three independent mathematical signals hitting the same level. This is extremely rare and confirms the 81k zone as a rotation completion.
4. Structure Break
Since the 10 Nov low:
4H is making higher highs & higher lows
The descending trendline from 11 Nov is broken
Trend shifted from controlled downtrend → early reversal
Structure now favors continuation upwards as long as higher lows hold
Interpretation:
Sellers who relied on the trendline no longer have control.
4.5 Intermarket Correlation: Why Bitcoin Dumped When ES Dumped
Another important factor:
Bitcoin dumped because ES dumped.
From 12 Nov → 21 Nov:
S&P500 (ES)
Dropped from 6900 → 6525
–5.43% correction
Bitcoin:
Dropped from 107k → 80.5k
–24.77% correction
BTC acted as a ~4.5× levered version of ES.
BTC acted as a ~4.5× levered version of ES.
Correlation Data:
Rolling BTC/ES correlation increased from 0.38 → 0.74
Meaning BTC traded almost in sync with equities during the selloff
Why?
Risk-Off Mechanics
When ES sells off:
Equity funds de-risk
Macro algos rotate out of high beta
Volatility spikes
Systematic funds reduce exposure
Crypto is treated as “high beta tech”
BTC amplifies the move by a factor of 3–5×
Bitcoin didn’t dump because crypto was weak — It dumped because macro markets were risk-off.
Why this matters now
ES has stabilized
BTC stopped following ES lower
Spot demand started rising
BTC/ES correlation is dropping again (from 0.78 → ~0.55)
USDT-M shorts didn’t adjust
This is exactly when short squeezes start on BTC:
Macro stabilizes
Crypto regains independence
Shorts remain positioned for risk-off
Spot buyers take control
Price accelerates upward
This is a classic intermarket correlation unwind.
5. USDT Dominance (USDT.D) Confirms Risk Rotation
USDT dominance has turned down, which means:
Traders are deploying capital
Less stablecoin sitting idle
More risk-on appetite
Historically aligns with BTC beginning new legs up after HTF rotations
When USDT.D falls at the same time spot CVD rises, the market is shifting capital into crypto.
6. Targets: 118.5k → 124k
These are the next liquidity magnets.
Target #1: 118.5k
Confluences with:
1.141 extension of the 11 Nov → 12 Nov move
First major liquidity pool
First real “decision point” for the market
Target #2: 124k
Confluences with:
A weak high that will be swept
1.618 extension of the same 11→12 Nov move
Natural squeeze exhaustion zone
Perfect location for a Swing Fail Pattern
Rotation Logic
Shallow retraces → larger extensions (1.618 → 2.0)
Deep retraces → smaller extensions (1.272 → 1.414)
BTC currently fits the shallow retrace profile → favors strong extension
7. Other Pivot Points
Marked on the chart:
Minor LVNs
Minor-imbalances
CME Gaps
Expect reaction at each point.
8. Invalidation & Bearish Pathway
My invalidation is clear:
Trading below 80k invalidates the squeeze setup.
Below 80k, the absorption breaks.
If 80k is lost, the downside extension levels become:
74k
70k
64k
These levels are:
The natural downside extension pathways from the 11 Nov → 21 Nov swing
They form the mirrored rotation of the bullish structure
Final View
We dumped because macro went risk-off
Bitcoin amplified the ES selloff
Shorts loaded heavily into the move
Spot buyers stepped in first
A clean absorption pattern formed
Mathematical rotation completed at ~81k
Structure flipped
Risk metrics like USDT.D turned down
Correlation with ES is now unwinding
If Bitcoin continues to hold above 80k and spot keeps leading, the squeeze toward 118.5k → 124k becomes the most likely path.
Abbreviation List
BTC – Bitcoin
ES – S&P500 E-Mini Futures
OI – Open Interest
CVD – Cumulative Volume Delta
USDT-M – Stablecoin-Margined Futures
BTC-M – Coin-Margined Futures
HTF – Higher Timeframe
LVN – Low Volume Node
AVWAP – Anchored Volume-Weighted Average Price
PRZ – Potential Reversal Zone
SFP – Swing Fail Pattern
Fib – Fibonacci
CTA – Commodity Trading Advisor (systematic trend-following funds)
VIX – Volatility Index
Beta – Sensitivity of an asset’s movement relative to a benchmark
Risk-Off – Market environment where investors reduce exposure to risky assets
Risk-On – Market environment where investors increase exposure to risky assets
-----
If you enjoy this type of deep, data-driven breakdown—spot vs futures, CVD flow, intermarket correlation, and rotation math—drop a like and leave a comment. It helps me see whether these higher-level analyses bring value, and it motivates me to keep sharing them for free.
