GOLD Set To Fall! SELL!
My dear subscribers,
This is my opinion on the GOLD next move:
The instrument tests an important psychological level 4196.3
Bias - Bearish
Technical Indicators: Supper Trend gives a precise Bearish signal, while Pivot Point HL predicts price changes and potential reversals in the market.
Target - 4171.1
My Stop Loss - 4210.0
About Used Indicators:
On the subsequent day, trading above the pivot point is thought to indicate ongoing bullish sentiment, while trading below the pivot point indicates bearish sentiment.
Disclosure: I am part of Trade Nation's Influencer program and receive a monthly fee for using their TradingView charts in my analysis.
———————————
WISH YOU ALL LUCK
E-signal

EURGBP: Bearish Continuation & Short Signal
EURGBP
- Classic bearish formation
- Our team expects pullback
SUGGESTED TRADE:
Swing Trade
Short EURGBP
Entry - 0.8708
Sl - 0.8716
Tp - 0.8692
Our Risk - 1%
Start protection of your profits from lower levels
Disclosure: I am part of Trade Nation's Influencer program and receive a monthly fee for using their TradingView charts in my analysis.
❤️ Please, support our work with like & comment! ❤️

AUDJPY Massive Long! BUY!
My dear subscribers,
AUDJPY looks like it will make a good move, and here are the details:
The market is trading on 98.180 pivot level.
Bias - Bullish
Technical Indicators: Both Super Trend & Pivot HL indicate a highly probable Bullish continuation.
Target - 98.364
About Used Indicators:
The average true range (ATR) plays an important role in 'Supertrend' as the indicator uses ATR to calculate its value. The ATR indicator signals the degree of price volatility.
Disclosure: I am part of Trade Nation's Influencer program and receive a monthly fee for using their TradingView charts in my analysis.
———————————
WISH YOU ALL LUCK

AUDNZD Technical Analysis! BUY!
My dear friends,
Please, find my technical outlook for AUDNZD below:
The price is coiling around a solid key level - 1.1328
Bias -Bullish
Technical Indicators: Pivot Points Low anticipates a potential price reversal.
Super trend shows a clear buy, giving a perfect indicators' convergence.
Goal - 1.1361
Safe Stop Loss - 1.1311
About Used Indicators:
The pivot point itself is simply the average of the high, low and closing prices from the previous trading day.
Disclosure: I am part of Trade Nation's Influencer program and receive a monthly fee for using their TradingView charts in my analysis.
———————————
WISH YOU ALL LUCK

GOLD: Long Trading Opportunity
GOLD
- Classic bullish setup
- Our team expects bullish continuation
SUGGESTED TRADE:
Swing Trade
Long GOLD
Entry Point - 4137.6
Stop Loss - 4123.3
Take Profit - 4164.5
Our Risk - 1%
Start protection of your profits from lower levels
Disclosure: I am part of Trade Nation's Influencer program and receive a monthly fee for using their TradingView charts in my analysis.
❤️ Please, support our work with like & comment! ❤️

NZDJPY Expected Growth! BUY!
My dear followers,
This is my opinion on the NZDJPY next move:
The asset is approaching an important pivot point 86.487
Bias - Bullish
Technical Indicators: Supper Trend generates a clear long signal while Pivot Point HL is currently determining the overall Bullish trend of the market.
Goal - 87.374
About Used Indicators:
For more efficient signals, super-trend is used in combination with other indicators like Pivot Points.
Disclosure: I am part of Trade Nation's Influencer program and receive a monthly fee for using their TradingView charts in my analysis.
———————————
WISH YOU ALL LUCK

BITCOIN – WAIT FOR ARBITRAGE TO BALANCE SPOT MARKETSTraders,
What a week it’s been. A lot of people got rekt, and I hope you were on the right side of the move. If not, it’s fine: this is how markets reset. I’ve been getting a lot of questions about what comes next, so here’s my current view.
The Situation
Binance/USDT wicked down to 102,000
Binance/USD wicked to 107,485.59
Coinbase/USD wicked to 107,000
That’s roughly a $5,000 difference, or about 5%, which is huge for major spot markets.
Under normal conditions, spreads between top venues like Coinbase and Binance are usually below 1% (Bitwise, 2019 SEC Study on Real Bitcoin Trading Volume - for the nerds interested ;)).
Why It Matters
Both Binance and Coinbase printed round-number lows (102k and 107k).
Round-number lows are considered “bad lows” because they attract clustered stop-loss orders and create obvious liquidity pools underneath.
Studies on market microstructure (e.g., Osler 2003; Kamps & Klein 2018) confirm that price clustering at round numbers is a real behavioral bias in FX and crypto markets.
Real market bottoms are messy, chaotic, and rarely form at clean, even levels.
These “perfect” lows often get revisited or swept later as the market clears liquidity and finds true balance.
How the Flush Works in Spot Markets
Even though spot markets don’t have leverage liquidations, they still experience stop cascades and panic selling.
When price breaks below a clean low, it triggers stops, sending a surge of sell orders into thin liquidity.
Market makers step in to absorb those orders and rebuild liquidity from a more stable base.
This is what traders call a spot flush — the market removing weak hands and resetting liquidity.
Conceptually, it’s the same as a liquidation flush in futures, just without forced margin calls.
What Arbitrage Does
Arbitrage keeps prices between exchanges in check.
When Bitcoin trades cheaper on Binance than on Coinbase, arbitrage traders buy on Binance and sell on Coinbase.
This pushes the cheap venue’s price up and the expensive one down until they align.
Makarov & Schoar (2020, NBER) showed that cross-exchange price deviations in Bitcoin are temporary and mean-reverting, driven by arbitrage capital restoring equilibrium.
Kaiko research (2021–2023) also found that USD and USDT pairs often decouple during stress events, especially when stablecoin liquidity or banking rails get disrupted, and later realign once volatility settles.
That’s exactly what we’re seeing now: a temporary dislocation that arbitrage will eventually close.
What I Expect
Binance already swept liquidity down to 102k.
Coinbase still has a clean 107k low that hasn’t been tested.
To rebalance both exchanges, I expect Coinbase to trade within 1% of the Binance 102k low, meaning roughly 103k–104k.
That would bring both markets back into alignment and complete a proper spot flush.
This isn’t a guaranteed move, but it’s a logical rebalancing target supported by historical arbitrage behavior.
What Could Happen Before That
We could still see Bitcoin move back toward 118k–120k before a potential drop.
After major liquidation events, markets often retrace sharply as liquidity rebuilds and shorts get squeezed.
A move higher doesn’t invalidate the idea of a later sweep; it could just be part of the natural reset phase before the market finds true equilibrium.
What I’m Watching
The spread between Coinbase/USD and Binance/USDT narrowing from around 5% to about 1%.
Coinbase breaking below 107k and testing the 104–102k zone.
A liquidity sweep followed by a strong reclaim and visible buy volume.
If we move up first, I’ll watch price behavior around 118k–120k for signs of exhaustion.
My Plan (Not Financial Advice)
I’m staying patient and letting the market mechanics reset.
If Coinbase trades into the 103k–102k zone, that’s my “let’s see what’s going on now” trigger.
That doesn’t mean I’ll instantly go long — it means I’ll start watching the data:
Volume and delta (are buyers stepping in?)
Strength of reclaim (is the recovery fast and decisive?)
Order book depth (is liquidity returning?)
What is Open Interest doing?
Do we see absorption? Or maybe a continuation pattern even?
Only if those metrics confirm strength will I consider entering.If not, I’ll stay flat and wait for the next confirmation.
So, TLDR;
Both Binance and Coinbase printed clean, round-number lows that are likely to be swept again. Arbitrage will eventually bring the spot markets back into balance, which should pull Coinbase closer to Binance’s 102k low. We might even see a push toward 120k first as liquidity resets. Either way, patience is key: let arbitrage, liquidity, and order flow do their job before taking any position.
And remember: Patience in trading isn’t about doing nothing, it’s about waiting for the odds to align in your favor. Chasing every move might feed the ego, but patience compounds the account. The market always rewards the trader who can sit still when everyone else is reacting.
Trade safe!

EURUSD On The Rise! BUY!
My dear friends,
My technical analysis for EURUSD is below:
The market is trading on 1.1559 pivot level.
Bias - Bullish
Technical Indicators: Both Super Trend & Pivot HL indicate a highly probable Bullish continuation.
Target - 1.1580
Recommended Stop Loss - 1.1547
About Used Indicators:
A pivot point is a technical analysis indicator, or calculations, used to determine the overall trend of the market over different time frames.
Disclosure: I am part of Trade Nation's Influencer program and receive a monthly fee for using their TradingView charts in my analysis.
———————————
WISH YOU ALL LUCK

TESLA My Opinion! BUY!
My dear friends,
Please, find my technical outlook for TESLA below:
The instrument tests an important psychological level 413.27
Bias - Bullish
Technical Indicators: Supper Trend gives a precise Bullish signal, while Pivot Point HL predicts price changes and potential reversals in the market.
Target - 428.09
Recommended Stop Loss - 405.57
About Used Indicators:
Super-trend indicator is more useful in trending markets where there are clear uptrends and downtrends in price.
Disclosure: I am part of Trade Nation's Influencer program and receive a monthly fee for using their TradingView charts in my analysis.
———————————
WISH YOU ALL LUCK

EURUSD The Target Is DOWN! SELL!
My dear subscribers,
My technical analysis for EURUSD is below:
The price is coiling around a solid key level - 1.1618
Bias - Bearish
Technical Indicators: Pivot Points Low anticipates a potential price reversal.
Super trend shows a cler sell, giving a perfect indicators' convergence.
Goal - 1.1584
My Stop Loss - 1.1637
About Used Indicators:
By the very nature of the supertrend indicator, it offers firm support and resistance levels for traders to enter and exit trades. Additionally, it also provides signals for setting stop losses
Disclosure: I am part of Trade Nation's Influencer program and receive a monthly fee for using their TradingView charts in my analysis.
———————————
WISH YOU ALL LUCK

EURUSD: Long Trade with Entry/SL/TP
EURUSD
- Classic bullish formation
- Our team expects pullback
SUGGESTED TRADE:
Swing Trade
Long EURUSD
Entry - 1.1574
Sl - 1.1560
Tp - 1.1598
Our Risk - 1%
Start protection of your profits from lower levels
Disclosure: I am part of Trade Nation's Influencer program and receive a monthly fee for using their TradingView charts in my analysis.
❤️ Please, support our work with like & comment! ❤️

GBPNZD Under Pressure! SELL!
My dear friends,
Please, find my technical outlook for GBPNZD below:
The instrument tests an important psychological level 2.3302
Bias - Bearish
Technical Indicators: Supper Trend gives a precise Bearish signal, while Pivot Point HL predicts price changes and potential reversals in the market.
Target - 2.3210
About Used Indicators:
Super-trend indicator is more useful in trending markets where there are clear uptrends and downtrends in price.
Disclosure: I am part of Trade Nation's Influencer program and receive a monthly fee for using their TradingView charts in my analysis.
———————————
WISH YOU ALL LUCK

GBPCHF Trading Opportunity! SELL!
My dear subscribers,
GBPCHF looks like it will make a good move, and here are the details:
The market is trading on 1.0720 pivot level.
Bias - Bearish
My Stop Loss - 1.0729
Technical Indicators: Both Super Trend & Pivot HL indicate a highly probable Bearish continuation.
Target - 1.0704
About Used Indicators:
The average true range (ATR) plays an important role in 'Supertrend' as the indicator uses ATR to calculate its value. The ATR indicator signals the degree of price volatility.
Disclosure: I am part of Trade Nation's Influencer program and receive a monthly fee for using their TradingView charts in my analysis.
———————————
WISH YOU ALL LUCK

NZDUSD Trading Opportunity! BUY!
My dear subscribers,
My technical analysis for NZDUSD is below:
The price is coiling around a solid key level - 0.5733
Bias - Bullish
Technical Indicators: Pivot Points High anticipates a potential price reversal.
Super trend shows a clear buy, giving a perfect indicators' convergence.
Goal - 0.5760
About Used Indicators:
By the very nature of the supertrend indicator, it offers firm support and resistance levels for traders to enter and exit trades. Additionally, it also provides signals for setting stop losses
Disclosure: I am part of Trade Nation's Influencer program and receive a monthly fee for using their TradingView charts in my analysis.
———————————
WISH YOU ALL LUCK

GOLD Will Collapse! SELL!
My dear followers,
This is my opinion on the GOLD next move:
The asset is approaching an important pivot point 4070.7
Bias - Bearish
Safe Stop Loss - 4088.9
Technical Indicators: Supper Trend generates a clear short signal while Pivot Point HL is currently determining the overall Bearish trend of the market.
Goal - 4039.4
About Used Indicators:
For more efficient signals, super-trend is used in combination with other indicators like Pivot Points.
Disclosure: I am part of Trade Nation's Influencer program and receive a monthly fee for using their TradingView charts in my analysis.
———————————
WISH YOU ALL LUCK

USDCAD Technical Analysis! BUY!
My dear subscribers,
This is my opinion on the USDCAD next move:
The instrument tests an important psychological level 1.3986
Bias - Bullish
Technical Indicators: Supper Trend gives a precise Bullish signal, while Pivot Point HL predicts price changes and potential reversals in the market.
Target - 1.4010
My Stop Loss - 1.3973
About Used Indicators:
On the subsequent day, trading above the pivot point is thought to indicate ongoing bullish sentiment, while trading below the pivot point indicates bearish sentiment.
Disclosure: I am part of Trade Nation's Influencer program and receive a monthly fee for using their TradingView charts in my analysis.
———————————
WISH YOU ALL LUCK

GBPUSD Massive Long! BUY!
My dear friends,
My technical analysis for GBPUSD is below:
The market is trading on 1.3273 pivot level.
Bias - Bullish
Technical Indicators: Both Super Trend & Pivot HL indicate a highly probable Bullish continuation.
Target - 1.3337
About Used Indicators:
A pivot point is a technical analysis indicator, or calculations, used to determine the overall trend of the market over different time frames.
Disclosure: I am part of Trade Nation's Influencer program and receive a monthly fee for using their TradingView charts in my analysis.
———————————
WISH YOU ALL LUCK

SPY: Bullish Continuation & Long Trade
SPY
- Classic bullish formation
- Our team expects growth
SUGGESTED TRADE:
Swing Trade
Buy SPY
Entry Level - 653.12
Sl - 649.92
Tp - 659.88
Our Risk - 1%
Start protection of your profits from lower levels
Disclosure: I am part of Trade Nation's Influencer program and receive a monthly fee for using their TradingView charts in my analysis.
❤️ Please, support our work with like & comment! ❤️

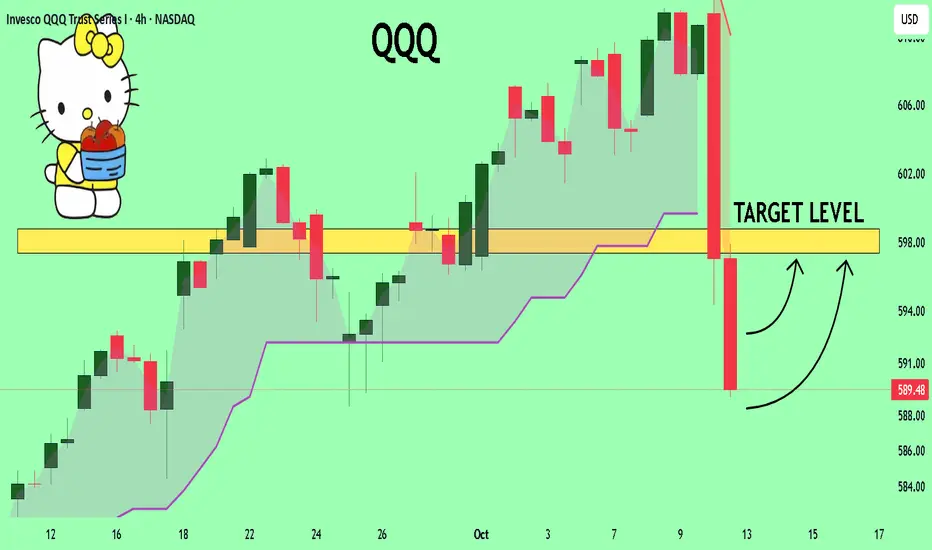
QQQ Set To Grow! BUY
My dear friends,
QQQ looks like it will make a good move, and here are the details:
The market is trading on 569.48 pivot level.
Bias - Bullish
Technical Indicators: Supper Trend generates a clear long signal while Pivot Point HL is currently determining the overall Bullish trend of the market.
Goal - 597.36
About Used Indicators:
Pivot points are a great way to identify areas of support and resistance, but they work best when combined with other kinds of technical analysis
Disclosure: I am part of Trade Nation's Influencer program and receive a monthly fee for using their TradingView charts in my analysis.
———————————
WISH YOU ALL LUCK
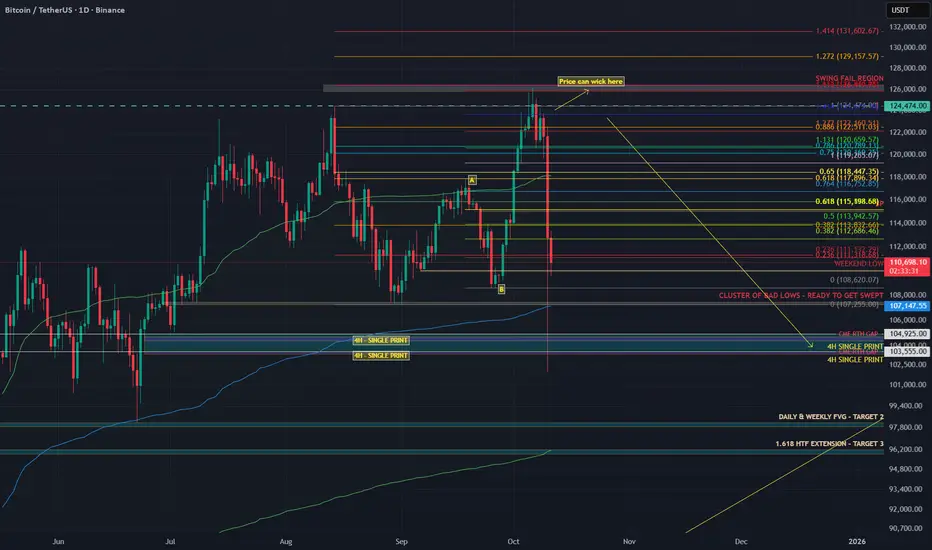
BITCOIN – THE REAL REASON BEHIND THE FALLWhen I started trading someone told me something I’ll never forget: “If you can predict tomorrow’s newspaper headline, you understand the market.”
He didn’t mean I should chase news. He meant I should read structure so well that I know what kind of headline the market is already writing, before the mass even see it.
And now, looking around online, I see the complete opposite. Everywhere you look, there’s another “confluencer” talking about crypto with big words and zero understanding.
People selling dreams, memberships, and indicators, while they don’t even know what open interest or CVD means.
I’m not here to sell anything. I’m here to help people actually learn how to read data and see through the noise. Because what most of these so-called experts call “analysis” is just emotional guessing wrapped in confidence.
What I called and what happened
Last week I posted my “Big Dump” thesis.
I said Bitcoin would swing fail above the highs, then drop into the 104K region. That is exactly what happened.
Price ran the sweep into 126K, trapped the late buyers, and dumped straight into 104K.
People blamed tariffs. The tariff headline was the spark. The fuel was crypto’s own positioning.
Why the structure was ready to snap
Before the crash, the data told the story clearly.
Stablecoin OI went from 257K to 285K contracts (+10.9%). That is new leveraged exposure.
Coin-margined OI dropped during the breakout, then rose again near the highs. Shorts were fading strength.
Spot CVD stayed flat to slightly negative. Real buyers were missing.
The long/short ratio fell from 2.05 to 1.02 even while price kept climbing.
That’s what distribution looks like. Buyers on leverage pushing price up while stronger hands sell into them. No real spot demand, just futures exposure.
You don’t need a macro event to fall. You only need a reason for those leveraged buyers to stop bidding. Think of it like a crowded elevator. Everyone keeps piling in as it moves up, feeling safe because it hasn’t stopped yet. But the moment one person hesitates, the weight shifts. When the next person panics, the whole thing drops.
That’s what happens when a market is driven by leverage instead of conviction. You don’t need bad news, you just need hesitation.
Look back at similar events.
In May 2021, funding rates were insane, perps overloaded, and spot volume thin. Elon Musk tweeted about Bitcoin’s energy use. That tweet didn’t cause the dump. It just made leveraged longs pause. The bids disappeared and the cascade started.
In August 2023, Evergrande headlines hit. Bitcoin was sitting at resistance with flat spot CVD and rising OI. Equities wobbled, crypto longs hesitated, and the structure collapsed within hours.
In March 2020, when COVID panic hit, Bitcoin had already been stretched thin. Funding was high, leverage was heavy, and liquidity was weak. The virus didn’t break the market, leverage did.
Leverage creates confidence until it doesn’t. Price doesn’t fall because people start selling. It falls because nobody steps in to buy. Headlines decide when the drop starts. Structure decides how far it goes.
Why 104K was my first target
I didn’t pick 104K out of thin air. That level was built on confluence.
1) AVWAP from the April 7 auction
That swing low kicked off with massive volume. When a move starts with that kind of participation, the anchored VWAP becomes a key reference for institutional flow. It represents the average cost of that whole auction, and when extended forward, it acts as a dynamic area where liquidity and algorithms interact.
That blue AVWAP line from April has been running right through the 104K region.
It’s not that price revisited that auction, it’s that the anchored VWAP from that event still marks the fair value area for that entire move.When price traded back down into that region, it met that same volume-weighted anchor, creating a major confluence zone that algos and larger players watch closely.
2) The June 22 breakout left an LVN
A new auction started on June 22 and pushed higher, leaving a Low Volume Node behind.
An LVN is a thin zone on the volume profile where the market moved quickly with little trade.
Markets often revisit these thin areas later to find balance or test unfinished business.
3) HTF Fibonacci cluster
Multiple higher timeframe Fibonacci retracements and extensions overlapped near the same 104K area. When several fib levels align with structure, that’s a strong confluence zone watched by both human traders and algorithms.
The 104K region was where the AVWAP line, LVN, and fib cluster all met. That’s not a random target. It’s a structurally defined area where liquidity concentrates and where markets tend to react sharply. And that’s exactly what happened.
The spark versus the structure
The tariff headline didn’t cause the drop. It triggered it.
The structure was already unstable. Leverage was maxed. Spot demand was flat. Funding was positive and rising. When the tariff news hit, traditional markets pulled back and crypto followed instantly. It wasn’t correlation, it was liquidity contagion.
Traders managing multiple books de-risk across assets when volatility spikes. That creates a gap in liquidity. When the bids vanish, the market falls into the first real pool of resting orders — in this case, the 104K zone.
You saw the same mechanics during the March 2020 crash and the 2021 deleverage. External shocks trigger internal liquidation cascades. That’s why saying “this had nothing to do with crypto is completely wrong.
This had everything to do with crypto. It’s like blaming the thunder for breaking a window when the glass was already cracked. Or saying the iceberg sank the Titanic when the captain was already steering through a sea of warnings.
Crypto was structurally weak. Leverage was stretched, spot demand was gone, and funding was positive. When the headline hit, it didn’t cause the collapse. It just gave the market permission to do what it was already set up to do — unwind.
Crypto is built on leverage.
Perpetual futures dominate volume.
Stablecoin collateral drives exposure.
When external risk events change funding conditions or risk appetite, the crypto market reacts instantly because its structure is fragile by design.
Example:
When yields spike, the dollar strengthens and funding costs rise. Leveraged longs become more expensive to hold, so traders unwind positions.
When equities dump, cross-asset desks reduce risk globally, which pulls liquidity out of crypto perps too.
Intermarket correlation always matters. Macro sets the mood. But the speed and violence of crypto moves always come from leverage inside the system.
How you can spot it next time
Compare Spot CVD vs Stablecoin CVD. If stablecoin CVD rises while spot stays flat or negative, the rally is leverage-driven.
Track Open Interest vs Price. Both rising together usually means exposure is building. Confirm with spot flow.
Watch the Long/Short ratio. If it drops while price rises, shorts are entering and the move may be getting absorbed.
Anchor VWAPs to real pivots like swing lows, breakouts, or liquidation spikes. Those levels attract institutional flow.
Study Volume Profiles. LVNs are thin and often retested. HVNs are balance zones that attract price.
Map HTF fib clusters for confluence. Reactions are stronger when multiple timeframes agree.
Note single prints and thin brackets on TPO or volume profiles. These often act as magnets.
When these factors line up, you don’t need to predict headlines.
You’ll already most likely know which headline will break the market.
TLDR
The rally was leverage-driven: Stablecoin OI up 10.9%, Spot CVD flat, Long/Short ratio down from 2.05 to 1.02
The swing fail at 126K was the final liquidity grab
104K was the target due to AVWAP + LVN + HTF fib cluster
The tariff headline was the spark, not the cause
The crash was caused by leverage and missing spot demand
Crypto didn’t fall because of politics. It fell because the market was already begging for an excuse to reset.
The data showed it clearly weeks before the drop.
If this helped you see the market a little clearer or made you think differently about how price really moves, please leave a like and drop a reaction. It keeps me motivated to keep posting real analysis, not the copy-paste bullshit hype that floods your feed every day.
Check the Order Flow Data from 6 October here: ibb.co
BTCUSD Will Explode! BUY!
My dear subscribers,
This is my opinion on the BTCUSD next move:
The instrument tests an important psychological level 11668
Bias - Bullish
Technical Indicators: Supper Trend gives a precise Bullish signal, while Pivot Point HL predicts price changes and potential reversals in the market.
Target - 12007
About Used Indicators:
On the subsequent day, trading above the pivot point is thought to indicate ongoing bullish sentiment, while trading below the pivot point indicates bearish sentiment.
Disclosure: I am part of Trade Nation's Influencer program and receive a monthly fee for using their TradingView charts in my analysis.
———————————
WISH YOU ALL LUCK

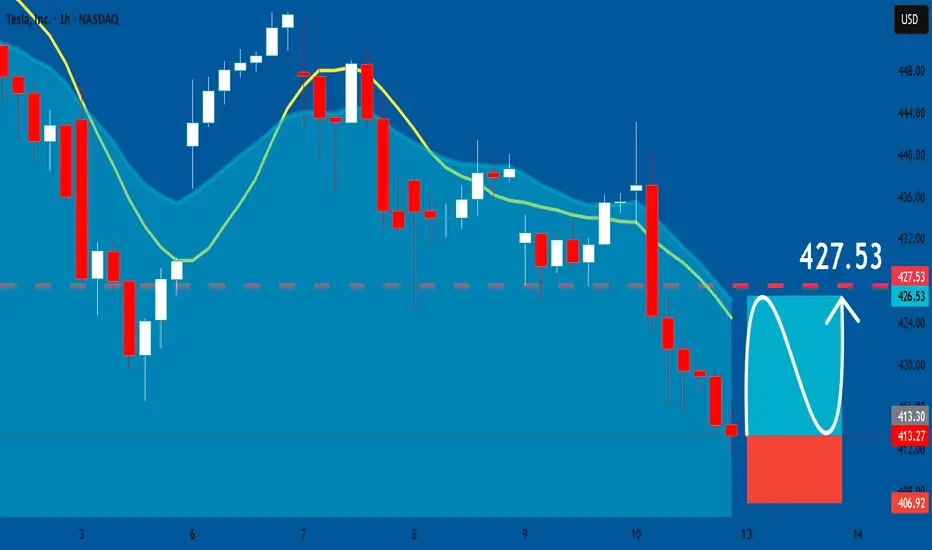
TESLA: Long Signal Explained
TESLA
- Classic bullish formation
- Our team expects pullback
SUGGESTED TRADE:
Swing Trade
Long TESLA
Entry - 413.27
Sl - 406.92
Tp - 427.53
Our Risk - 1%
Start protection of your profits from lower levels
Disclosure: I am part of Trade Nation's Influencer program and receive a monthly fee for using their TradingView charts in my analysis.
❤️ Please, support our work with like & comment! ❤️
EURUSD: Bearish Continuation & Short Trade
EURUSD
- Classic bearish formation
- Our team expects fall
SUGGESTED TRADE:
Swing Trade
Sell EURUSD
Entry Level - 1.1618
Sl - 1.1639
Tp - 1.1580
Our Risk - 1%
Start protection of your profits from lower levels
Disclosure: I am part of Trade Nation's Influencer program and receive a monthly fee for using their TradingView charts in my analysis.
❤️ Please, support our work with like & comment! ❤️
