Maintaining Clarity in Market ViewHello, traders of the Trading View community! Today, I wanna emphasize the importance of maintaining your own perspective on the market and trading, while avoiding being overwhelmed by information noise.
Here are a few strategies to help you steer clear of this trap:
✔️ Define Your Own Approach: Develop your own trading strategy and plan. Don't conform to the standards set by bloggers or experts—determine what works best for you.
✔️ Choose Sources Carefully: Select a handful of trusted information sources. Don't immerse yourself in the multitude of opinions from various authors, as this can lead to confusion.
✔️ Set a Time Limit: Allocate specific time for analyzing resources and blogs. Use this time mindfully, preventing information overload.
✔️ Fact-check Information : Always fact-check information before incorporating it into your strategy. Don't solely rely on the opinions of others.
✔️ Focus on Education : Enhance your own market analysis and trading skills. The more you understand, the less you'll depend on others' opinions.
✔️ Review Opinions Critically : If you've already gathered information from others, always conduct your own analysis before making a decision.
✔️Track Your Own Results: Remember that the results of your personal strategy are more important than others' recommendations.
✔️ Implement Information Gradually : Don't attempt to incorporate all new approaches at once. Test them gradually and cautiously.
May your strategy and approach to trading be grounded in your own analysis and common sense. Maintain your market sense even in the face of overwhelming information.
Share which methods help you avoid information overload. It will be very interesting to read!
Don't forget to subscribe so you don't miss out. And give it a like – it motivates me to create consistent and high-quality content for you.
Sincerely yours, Kateryna💙💛
EDU

Fundamental vs Technical Analysis📊🔍 Fundamental vs Technical Analysis: Unveiling the Differences and Advantages 🔍📊
In the exciting world of trading, two distinct yet equally important methodologies dominate the landscape: Fundamental Analysis and Technical Analysis.
Both approaches provide valuable insights, but they stem from different philosophies and offer unique advantages.
Let's dive into the heart of this debate to explore the contrasting attributes of these two analytical powerhouses.
Fundamental Analysis: Delving into the Essence
Fundamental analysis revolves around the study of a company's intrinsic value by assessing its financial statements, economic indicators, and market trends.
This approach examines the broader economic context that influences the asset's price, making it a staple for long-term investors. By scrutinizing earnings reports, balance sheets, and macroeconomic factors, fundamental analysis seeks to identify whether an asset is overvalued, undervalued, or fairly priced.
🔍 Advantages of Fundamental Analysis:
• Provides a holistic view of the asset's health and potential future growth.
• Useful for long-term investment decisions.
• Helps investors understand market trends driven by economic events.
Technical Analysis: Unveiling Price Patterns
Technical analysis, on the other hand, is all about decoding price patterns and historical data. It relies on charts, indicators, and patterns to predict future price movements.
The emphasis is on understanding market sentiment, trends, and psychological factors that impact buying and selling decisions.
Technical analysts believe that historical price data can indicate potential future price direction.
🔍 Advantages of Technical Analysis:
• Well-suited for short-term trading decisions.
• Helps traders identify entry and exit points more precisely.
• Focuses on price action, which reflects market sentiment and behavior.
The Synergy of Both Approaches: A Balanced Strategy
While fundamental and technical analysis may seem to belong to separate worlds, combining both can yield powerful insights. Successful traders often utilize a hybrid approach, leveraging fundamental analysis to understand the broader context and technical analysis to fine-tune entry and exit points. This combined approach can enhance decision-making and help traders navigate the complexities of the market more effectively.
🌟 Conclusion: The Path to Informed Trading
Fundamental analysis and technical analysis are like two sides of the same coin, each offering distinct benefits. The choice between them often depends on your trading style, time horizon, and risk tolerance.
As you delve deeper into the world of trading, consider incorporating elements of both approaches to develop a more comprehensive understanding of the market dynamics and make more informed trading decisions.
Remember, understanding the nuances of both fundamental and technical analysis can be a valuable asset on your trading journey. Stay curious, stay informed, and keep refining your analytical toolkit.
Happy trading! 💙💛
Feel free to share your thoughts and experiences in the comments below. Let's support and inspire each other on this exciting trading path.
Your Kateryna💙💛

The Quest for the Trading "Holy Grail": A Realistic PerspectiveDiscover why the concept of a trading "holy grail" is more myth than reality. Why successful trading involves understanding market uncertainties, human behavior, and adaptable strategies?
Experienced traders know: there's no magical "holy grail" guaranteeing 100% profits. In truth, consistent traders recognize losses as much a part of trading as gains. Despite this, a stream of novice traders still seek the one-size-fits-all path to profitability.
Consider these three reasons why discovering a trading "holy grail" is as likely as reaching the sun:
Unpredictable Market Uncertainties: The market's complexity thwarts all-knowing predictions. Influences are countless, making extended manipulation improbable. Unless you've got superpowers foreseeing central banker statements or impending crises, the holy grail remains elusive.
Human Behavior Influences Markets: Human decisions continue to shape market dynamics. While automated systems play a role, it's human actions that cause market fluctuations. Trading opportunities emerge from discrepancies between price and value, often influenced by individual interpretations. Variations in approaches, like Nick vs. Mike, and factors like John's hesitance to cut losses, contribute to market complexities.
Adaptable Strategies are Essential: Market patterns echo human behavior, but shifting conditions render "surefire" systems obsolete. The ebb of trend-following tools demonstrates adaptability's importance. Profits hinge on discretion, recognizing pattern shifts, and mastering risk management.
Remember, a holy grail isn't essential for trading success. Full-time and part-time traders alike profit with prudent risk management. Understanding of risk management — your keys to sustainable trading success.

Overview of the Elliott Wave TheoryThe theory of Elliott Waves, an intricate subject we've delved into in previous posts, beckons me once more to distill its essence. Let's gather the pivotal elements anew, unraveling the complexities to forge a deeper understanding.
Elliott Waves exhibit fractal characteristics. Each wave possesses segments that closely resemble the entire wave, a quality known in mathematics as "self-similarity."
A trending market adheres to a distinct 5-3 wave structure.
The initial 5-wave pattern is termed the impulse wave.
One among the three impulse waves (1, 3, or 5) always extends, with Wave 3 typically being the elongated one.
The subsequent 3-wave pattern is recognized as the corrective wave, denoted by letters A, B, and C in lieu of numbers for tracking the correction.
Waves 1, 3, and 5 consist of smaller 5-wave impulse patterns, while Waves 2 and 4 are comprised of lesser 3-wave corrective sequences.
While there exist 21 varieties of corrective patterns, they fundamentally stem from three straightforward and comprehensible formations.
These core corrective wave shapes encompass zig-zags, flats, and triangles.
Three fundamental principles define the labeling of waves within the Elliott Wave Theory:
First Principle: Wave 3 must NEVER be the shortest impulse wave.
Second Principle: Wave 2 must NEVER surpass the commencement point of Wave 1.
Third Principle: Wave 4 must NEVER overlap with the price region of Wave 1.
Upon thorough chart analysis, you'll observe that the market indeed advances in waves.
Since the market seldom conforms precisely to theoretical models, honing your ability to analyze waves requires extensive practice over numerous hours before you find yourself at ease with Elliott waves.
🙌🏻Persevere diligently and remain steadfast in your pursuit!Happy trading!
Your Kateryna💙💛

Explanations for Not Following Your TPHi! Have you ever abandoned your trading plan?🧐
If not, you should still read this, because you might be deceiving yourself!😉
If you have, why do you think you've been "unfaithful" to it?
It's about you.
Do you attribute it to your personality? Temporary loss of reason? Or perhaps, you see it as an inherent part of trading?
Several factors could contribute to your lack of discipline. Depending on your personality, background, training, and experience with markets, you may struggle to control impulsive actions.
For some, impulsiveness is ingrained. They find it challenging to concentrate, easily get bored, and seek quick thrills for relief.
For others, impulsive behavior is linked to emotional vulnerability. Some individuals have difficulty managing their emotions, leading them to act impulsively out of frustration.
Temporary setbacks are inevitable in trading.
When highly emotional traders face these setbacks, they become overly distressed, leading them to close positions prematurely or make major trading errors in a frantic state, which can only be rectified by closing the position.
No trader is perfect; any trader can be impulsive at times. Research has indicated that tiredness can impair concentration.
As much as your conscious mind cares about adhering to your trading plan, your unconscious mind might think, "Who cares? I just want to get this over with and relax."
Your psychological resources get depleted. Pushing yourself to the limit makes it difficult to concentrate on and adhere to your trading plan.
Other traders may be impulsive due to lack of experience. It's unrealistic to expect adherence to a trading plan when you're uncertain about what you're doing.
If you're new to trading, you may lack confidence and feel uneasy. You might hesitate to act, unwilling to risk your money because you don't have the strong belief in your plan's profitability that seasoned traders exhibit and it’s ok. "Who does nothing makes no mistakes."
It's not you, it's your trading plan.
You can't stick to a trading plan that you can't follow.
If your trading plan is incomplete and crucial aspects remain unclear, you'll have difficulty following it.
A trading plan should have well-defined entry and exit strategies. Monitoring signals that indicate trade progress are also crucial. Underestimating the importance of a clearly mapped-out trading plan is a mistake.
The successful trader is a disciplined trader. Disciplined traders adhere to their trading plans and don't act impulsively.
It's crucial to identify the reasons behind impulsive trading. It might be related to your personality or your trading plan, but whatever it is, gaining awareness of these factors and resolving them is essential.
Once you control the impulse to act, you'll trade more profitably and consistently.
In conclusion, a successful trader is not only someone who achieves consistent profitability but also someone who continuously learns and grows in this dynamic market. Remember to stay disciplined, manage risks effectively, and embrace both wins and losses as opportunities for improvement.
As you continue your trading journey, may the charts align in your favor, and may your strategies be filled with wisdom and insight. Wishing you the best of luck and success in all your trading endeavors!
Feel free to share your thoughts and experiences in the comments below. Let's support and inspire each other on this exciting trading path.
Best regards and happy trading!
Your Kateryna💙💛

The 4 Tips Often Overlooked by BeginnersGreetings, esteemed members of the @TradingView community and all Vesties out there!
Let's explore four timeless pieces of advice that beginners tend to overlook and why we should give them closer attention.
1. Manage your expectations.
Some newcomers fall into the trap of unrealistic expectations, drawn in by "get rich quick" schemes that initially sparked their interest in trading.
Beginner traders may anticipate similar returns to those promised in trendy strategies or TikTok videos, often without fully grasping the methods to achieve those profits.
Consistently profitable traders understand that success in trading requires more than just blindly following "profitable" traders on social media.
It takes time, discipline, and dedication to develop a trading system that suits your personality and the ability to adapt it to varying market conditions.
2. Simplicity is key.
Discovering a multitude of user-friendly education websites (with none better than TradingView, of course) can be enticing, especially when they offer a variety of indicators and trading systems.
Novice traders may find comfort in using fancy indicators and systems, ones that seem to be favored by the "pros," but without proper testing or practice, these technical tools can lead to mixed signals and confusion.
A wise approach is to start with price action and gradually incorporate indicators as you become more comfortable with their functionality.
3. Prioritize risk management.
Both beginners and experienced traders might envy those who achieve substantial gains, often overlooking the complexities behind their success.
While certain trading techniques can yield significant profits, they also carry the risk of wiping out an account in an instant.
Remember, even a good trade idea can turn sour if risk and trade management are neglected.
Proper risk management is crucial for maintaining longevity in the trading game and acquiring the skills needed to become consistently profitable.
4. Stick to your plan.
Trading novices are particularly susceptible to the psychological stresses of the market. Without trading confidence, they are more likely to deviate from their trading plans, even if the odds seem favorable.
Consistency is key in this aspect. After all, what you don't measure, you can't manage or improve upon. Without consistency:
• The trader won't learn how to adapt their system to changing market conditions.
• The trader won't cultivate the right mindset to handle losses, stay focused, and prevent emotional reactions.
• Inconsistent execution can skew the system's expected outcomes, leading to potentially worse results.
Don't hesitate to seek help and learn from a community of traders to avoid repeating the mistakes made by those who have walked your path before.
We would greatly appreciate your feedback on the article! Please feel free to share your thoughts and opinions in the comments section below.

Understanding the Learning CurveWelcome to @Vestinda new article about Learning Curve! We are delighted to share this insightful piece with our valued community on @TradingView !
At Vestinda, we believe in empowering traders with knowledge and tools to navigate the cryptocurrencies and futures trading. In this article, we will explore the concept of the learning curve and its relevance to the trading journey. Whether you are a novice trader or a seasoned professional, understanding the learning curve can be instrumental in your path to success.
If you focus and invest time into a subject, you will eventually reach a level of mastery.
The actual level clearly depends on the amount of invested time and to a significant extent on your inherent abilities to acquire the specific knowledge. I could probably spend a decade on quantum physics and not progress beyond the level of ‘enthusiastic beginner'. However, attaining mastery is seldom a smooth and linear journey. It is more like a curve in the mathematical sense, characterized by uneven ups and downs, reflecting the usual 'bumps in the road' that we all experience when dealing with challenging topics.
There is a pattern in the process of learning something new (knowledge, skills, etc.), which was formulated by the American psychologist Albert Bandura. This pattern is depicted in the form of a graph known as the Bandura curve.
The graph demonstrates the relationship between time (number of attempts), the level of human competence in what they are studying, and their expectations.
If you have ever enthusiastically started a new training, holding high hopes for it, and then quietly gave up, blaming others or anything else, then you are not alone. To avoid repeating this in the future, it's important to understand how human psychology and the system work, and that each of us is part of this system. Below, we will provide recommendations on what to pay attention to.
So, the Bandura curve shows the stages a person goes through when beginning to learn something new.
1. Clueless (You don't know what you don't know)
When you first venture into trading cryptocurrencies and futures, you are essentially clueless about the intricacies of the market. The concepts, strategies, and tools may seem foreign and overwhelming. It's like staring at a vast landscape without a map, unsure of where to even begin.
2. Naively confident (You think you know, but still don't know what you don't know)
As you begin your learning journey, you might gain some basic knowledge and techniques. This newfound understanding might lead to a sense of naively confident. You believe you have a handle on things, but in reality, there's a lot you're still unaware of, and the market can surprise you with unexpected turns.
3. Discouragingly realistic (You know what you don't know)
With more experience, you come to a point of realization that there is much more to learn. The challenges and complexities of trading become evident, and you may face setbacks that test your resolve. It can be a discouraging phase as you grapple with the reality of how much you still need to learn.
4. Mastery achieved (You know it)
Through persistence and a commitment to learning, you gradually achieve mastery in trading cryptocurrencies and futures. You've gained a comprehensive understanding of the market dynamics, developed effective strategies, and learned how to manage risks. You can now navigate the market with confidence and consistently make informed decisions.
Remember: The learning curve in trading is a natural part of the process, and each stage brings its own valuable lessons. Don't be disheartened by challenges or setbacks; they are opportunities to grow and improve your trading skills.
WHAT TO DO?
✅ Embrace the journey of learning and growth, recognizing that mastery takes time.
✅ Stay humble and open-minded, acknowledging that there is always more to learn.
✅ Be patient with yourself during the challenging phases and use them as motivation to improve.
✅ Keep refining your strategies and adapting to the ever-changing market conditions.
Can you identify which stage you are currently in your cryptocurrency and futures trading journey? Remember, each stage brings you closer to becoming a proficient trader.
We hope you found this article on understanding the learning curve in trading cryptocurrencies and futures helpful!
If you have any thoughts, questions, or personal experiences related to the topic, we'd love to hear from you. Please share your feedback in the comments below.
Your input is valuable to us and can help us create more content that resonates with your interests and needs.
Thank you for being part of our community!

The Divergence Cheat Sheet: Your Quick Reference GuideHello dear @TradingView community!
In this guide, we will delve into the concept of divergence and its significance in technical analysis, specifically focusing on its application in the cryptocurrency market, particularly Bitcoin.
Understanding Divergence: A Key Concept in Trading
Divergence occurs when the price of an asset and an indicator, such as the Relative Strength Index (RSI), move in opposite directions. This pattern provides valuable insights into potential price reversals or changes in trends.
The Divergence Cheat Sheet
To help us identify and interpret divergence patterns, a divergence cheat sheet can be an invaluable tool. It provides a concise overview of different divergence patterns and assists us in making timely and accurate decisions.
By having a cheat sheet on hand, you can save time, reduce errors, and ensure they don't miss crucial signals in the fast-paced cryptocurrency market.
Detecting Divergence
Detecting divergence is crucial for identifying lucrative trading opportunities. By using divergence indicators like the RSI, MACD, or Stochastic Oscillator, we can gain significant insights into market trends and potential price reversals.
To pinpoint divergence effectively, follow these steps:
Choose an indicator capable of detecting divergence, such as the RSI, MACD, or Stochastic Oscillator.
Look for discrepancies between the indicator and the price action. Regular divergence occurs when the price and the indicator move in opposite directions, while hidden divergence occurs when they move in the same direction but at different rates.
Monitor the direction of the trend. Divergence can indicate a trend reversal, so keeping track of the current market trend is crucial.
Confirm the divergence signal with other technical analysis tools. Divergence is just one piece of the puzzle, so it's essential to use other indicators to validate your trading decisions.
Examples of Divergence in Trading Charts
Let's examine a few examples of divergence on Bitcoin charts:
Strong Bullish Divergence:
When lows of the price decreases while the RSI increases, a regular bullish divergence occurs. This signals a potential trend reversal and presents an opportunity for a bullish trade.
Strong Bearish Divergence:
When highs the price of an asset is rising while the RSI is falling, it indicates a regular bearish divergence. This suggests a potential trend reversal and presents an opportunity for a bearish trade.
Medium Bullish Divergence:
When the lows of an asset remain equal while the RSI is rising, it indicates a medium bullish divergence. This suggests a potential increase in price, although it may not be a strong upward movement.
Medium Bearish Divergence:
When the highs of an asset remain unchanged while the RSI is decreasing, it indicates a medium bearish divergence. This suggests a potential decline in price, although the downward movement may not be significant.
Weak Bullish Divergence:
When the lows of an asset is decreasing while the RSI lows is equal, it indicates a weak bullish divergence. This suggests a potential increase in price, although it may not be a strong upward movement.
Weak Bearish Divergence:
When the highs of an asset are rising while the RSI remains unchanged, it indicates a moderate bearish divergence. This suggests a potential decline in price, although the downward movement may not be significant.
Hidden Bullish Divergence:
Hidden bullish divergence occurs when the price creates higher lows while the RSI is creating lower lows. This reinforces an existing uptrend and suggests its strength.
Hidden Bearish Divergence:
Hidden bearish divergence is observed when the price forms lower highs while the RSI forms higher highs. This indicates a potential weakening of the current uptrend and might signal a trend reversal or a pullback.
By recognizing these divergence patterns on trading charts, we can gain insights into potential market reversals, entry and exit points, and adjust trading strategies accordingly.
Incorporating Divergence into Your Trading Strategy
To effectively incorporate divergence into your trading, consider the following steps:
Identify the appropriate indicators: Choose reliable indicators such as RSI, MACD, or Stochastic Oscillator that can detect divergence patterns effectively.
Learn to spot divergence: Familiarize yourself with the different types of divergence patterns and practice identifying them on price charts. This will help you develop a trained eye for spotting potential trading opportunities.
Confirm with additional analysis: While divergence can provide valuable signals, it's essential to use other technical analysis tools to confirm your trading decisions. Look for supporting indicators, chart patterns, or trendline breaks that align with the divergence signal.
Set clear entry and exit criteria: Define your entry and exit points based on the divergence signal and your risk tolerance. Consider using stop-loss orders and take-profit levels to manage your trades effectively.
Practice risk management: Implement proper risk management techniques, such as position sizing, to protect your capital. Divergence alone should not be the sole basis for your trading decisions but rather an additional tool in your arsenal.
Backtest and refine your strategy: Test your divergence-based trading strategy on historical price data to assess its effectiveness. Make adjustments as needed and continuously monitor and evaluate your results to improve your trading approach.
Remember, divergence analysis is not foolproof and should be used in conjunction with other technical analysis methods and market factors. Regular practice, continuous learning, and adapting to changing market conditions are crucial for successful trading.
Divergence analysis is a powerful tool that can provide us with an edge in the cryptocurrency market. By understanding and effectively utilizing divergence patterns, we can identify potential trend reversals, improve entry and exit timing, and enhance overall trading strategy. Incorporate divergence analysis into your trading approach and combine it with other technical indicators and risk management techniques for a well-rounded and informed trading strategy.

The Struggle of Consistency: Navigating DCA in Crypto InvestingHello dear @TradingView community! Today let’s focus on what is Dollar Cost Averaging ?
Determining the optimal moment to buy cryptocurrency is often a challenging task due to the high volatility of crypto assets. Prices can fluctuate unpredictably at any given time, leading traders to experience the fear of missing out (FOMO).
This fear is commonly felt when the price of a cryptocurrency, such as Bitcoin (BTC), suddenly surges or plunges. During price drops, individuals tend to panic and sell their holdings in a frantic attempt to avoid further losses. Conversely, when prices rise, panic ensues as people worry they don't possess enough coins to sell.
As evident, making decisions to buy or sell cryptocurrencies is no easy feat. However, if you seek long-term financial gains from cryptocurrencies without succumbing to the anxiety caused by every price spike, it would be wise to consider the Dollar Cost Averaging (DCA) strategy. Let's delve deeper into what DCA entails and how it functions in the realm of cryptocurrencies.
What is Dollar Cost Averaging?
Dollar cost averaging is an investment strategy where fixed amounts are regularly invested at consistent intervals, in contrast to a one-time lump sum investment. This approach involves executing transactions regardless of the asset's current price or market fluctuations. It is highly favored by investors and management funds seeking long-term profits from various assets like ETFs, commodities, cryptocurrencies, stocks, and more.
How does DCA work? To employ the DCA strategy, you first determine the amount of cryptocurrency you wish to invest. In conventional investing, one would typically invest the entire designated sum in a specific asset. However, with DCA, you invest fixed amounts of USD into Bitcoin or any other asset over a designated period. For instance, you may choose to purchase $100 worth of BTC every month for a 10 year period.
When utilizing DCA, the selection of the cryptocurrency becomes crucial. With around 22,904 cryptocurrencies available today, you must pick a coin you believe will appreciate in value and yield profitable returns. You can even choose an ETF which follows the trend (up or down) for any specific asset or basket of assets.
To comprehend how DCA operates, consider the following example:
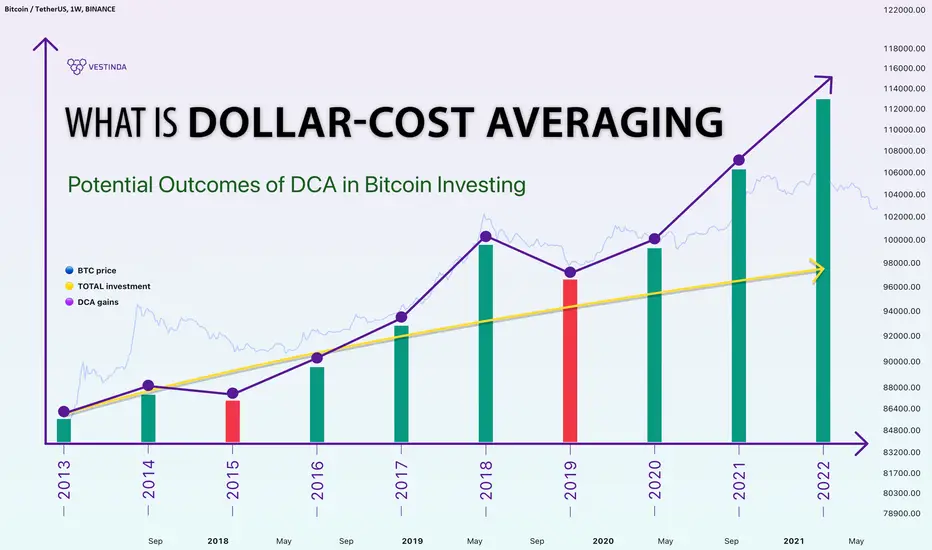
Let's assume it is June of 2014, and Katie decides to allocate $10,000 in BTC. In June of 2014, the price of Bitcoin stood at approximately $560 per coin. Instead of investing the entire sum at once, Katie opts for dollar cost averaging throughout the 9 years.
From June 2014 to May 2022, Katie spent $100 each month on BTC, disregarding market price fluctuations. After 8 years, she spends almost $9,600 and her earnings reflect the following:
The green line in the chart represents Katie’s total investment amount, while the orange line depicts the fluctuation of portfolio size value over the 9-year period. When Katie initiated his investments, both the cost of BTC and his investments were approximately $100. However, as time progressed, the price of Bitcoin underwent changes.
By May of 2022, Katie's $9,600 investment had grown to $287,518 worth of BTC, showcasing a growth rate of 2,895%. With maximum gain of $631,540 at bitcoin ATH.
Online DCA tools are also available to estimate the earnings from purchasing bitcoins over several months. For example, platforms like dcaBTC enable users to customize their DCA strategy according to their preferences, specifying the amount to purchase, investment frequency, and duration.
To successfully implement dollar-cost averaging (DCA) in Bitcoin investing, several key steps need to be followed. These steps involve setting a budget, choosing a reputable cryptocurrency exchange, establishing recurring purchases or utilizing recurring purchases and automated investment platforms (such as Binance, Coinbase, Kraken, Crypto.com or even at Vestinda), and monitoring and adjusting the strategy as necessary.
Pros and Cons of Dollar Cost Averaging
Let's commence with the pros of dollar cost averaging. By making regular and consistent purchases over time, you mitigate the risk associated with poorly timed lump sum investments. Additionally, since you make regular purchases, you alleviate the fear of missing out and impulsive decision-making prompted by price fluctuations.
Cryptocurrency exchanges and platforms charge transaction fees for every trade. While one might assume that DCA would result in higher commission fees, it is essential to remember that this is a long-term strategy. The commission costs are negligible compared to the potential profits that can be realized over several years.
Moreover, DCA does not necessitate substantial investments. This strategy involves smaller and consistent purchases, eliminating the need to determine how best to deploy a large sum in one go. Furthermore, if prices suddenly drop at the time of purchase, you can acquire the cryptocurrency at a lower price.
However, it is important to note that if the cryptocurrency's price is bullish, you may end up buying at a higher price. This is particularly relevant when dealing with BTC or any chosen cryptocurrency. Many crypto enthusiasts and investors prefer to purchase a significant amount at once, fearing a subsequent price surge in the hours, days, weeks, or months to come.
As previously mentioned, with the DCA strategy, you purchase small amounts at regular intervals, regardless of market stability.
Should you utilize the DCA Strategy?
DCA facilitates maximizing profits with relatively low risk. Although this approach is not devoid of drawbacks, it offers numerous advantages that can be leveraged to your benefit.
Hence, is DCA worth your time and money? As always, we recommend thoroughly studying all available information before making any decisions. Save this article to your browser bookmarks for easy reference in the future.
Happy trading!
Edu Just give me a reasonEdu Brokeout and retested the trendline on the 1 hr chart. Prepping for a pump.

EDUUSDTIn the 4H time frame, we see the change of character from bearish to bullish by making higher pivots. I think the 4H time frame can be a better source because of the little data we have available. This is an excellent project that has not been addressed. The price is still below a heavy resistance and breaking this resistance can be the beginning of a rally.
"Daily crypto market analyses I provide are personal opinions & not financial advice. Trading carries risks, so do your own research & seek advisor's help."

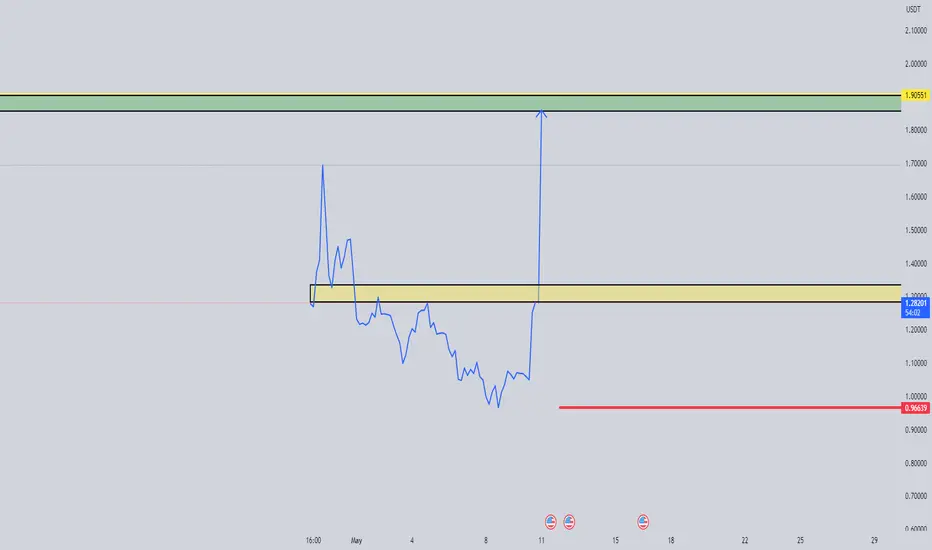
EDUUSDT.4HHello dear friends,
*Mars Signals Team wishes you high profits*
This is a time frame analysis for EDUUSDT.4H
We are in the 4 hour time frame. As you can see, the price is fluctuating on the resistance zone. If it can stabilize above the resistance line, we can advance to the second resistance line. But if it cannot stabilize above the resistance line, it can pull back to its first support line.
Warning: This is just a suggestion and we do not guarantee profits. We advise you to analyze the chart before opening any positions.
Take care

EDU broke crucial support Last time #EDU pumped 28% after trendline resistance breakout (1H)
Currently EDU broke and retested trendline support on 4H TF
It looks bearish but trying to reclaim it's trendline support! Keep an eye on #BTC also

edu can so pumpWe are waiting to receive for long or short, but the reviews give more possibility of growth, so let's be optimistic.

Price Channels — Quick and Easy Guide.Greetings, @TradingView community!
When it comes to analyzing market trends, there's a technique that takes trend theory to the next level: price channels.
This is @Vestinda, bringing you a helpful article on the topic of the price channels, also known as trend channels, offer an exciting way to identify optimal buying and selling opportunities in the market.
Price channels serve as a valuable tool in technical analysis, helping traders determine favorable entry and exit points. By drawing parallel lines that align with the angle of an uptrend or downtrend, we create a channel. The upper trend line acts as resistance, while the lower trend line represents support. These lines highlight potential areas where the market could experience reversals or continue its current trend.
Understanding the sentiment of a price channel is crucial. Channels with a positive slope (upward) are considered bullish, indicating an upward trend, while those with a negative slope (downward) are bearish, pointing to a downward trend. Recognizing the slope of a price channel allows traders to gauge the prevailing market conditions and make informed trading decisions.
Price channels can be categorized into three main types:
Ascending channels
Descending channels
Horizontal channels
Ascending channels display higher highs and higher lows, signaling a bullish sentiment. To create an ascending channel, draw a parallel line touching the most recent peak, aligning it with the angle of the uptrend line.
Conversely, descending channels exhibit lower highs and lower lows, suggesting a bearish sentiment. To create a descending channel, draw a parallel line touching the most recent valley, aligning it with the angle of the downtrend line
Horizontal channels , also known as ranging channels, indicate a consolidation phase with no clear trend direction.
These channels provide insights into potential buying zones when prices hit the lower trend line and selling zones when prices approach the upper trend line. Understanding these channel types empowers traders to adapt their strategies to different market scenarios.
Constructing a price channel requires parallelism between the trend lines. The lower trend line is typically considered a "buy zone," while the upper trend line serves as a "sell zone." It's crucial not to force price action into the drawn channels. When the channel boundaries slope at different angles, the pattern is no longer a price channel but a triangle pattern, requiring a distinct analytical approach.
Remember that price channels don't have to be flawlessly parallel. In reality, it's rare to find price action that perfectly aligns within two trend lines.
As traders, it's important not to solely rely on textbook price patterns but also consider broader market context and other essential cues from price action. Effective price channel analysis involves embracing imperfections and making informed decisions based on the available information.
In conclusion, price channels provide traders with a powerful technique to uncover profitable opportunities in the market. By drawing parallel trend lines and identifying support and resistance levels, traders can gain valuable insights into market sentiment and enhance their trading decisions.
However, it's essential to remember that perfection isn't the goal. Instead, focus on understanding market dynamics and adapting your strategy accordingly.
💜 So there you have it - a quick and easy guide to understanding price channels in trading! 💜

Eduusdt Expecting This Eduusdt
Eduusdt faced faced rejection here on first attempt price is going to retest the resistance level again I am expecting again rejection
Personal opinion not financial advice
Dyor

The Simple Plunge StrategyHello dear @TradingView community!
Welcome to @Vestinda, your trusted trading companion in the ever-changing world of financial markets. Our team is passionate about giving traders like you the tools and knowledge to make smart decisions and achieve your investing and trading goals.
At Vestinda, we know that successful trading involves using effective strategies, analyzing the market, and managing risk. That's why we sharing a strategy that can help you make the most of downward trends — The Simple Plunge Strategy.
This strategy is designed to help you navigate downward movements in the market with confidence. It focuses on spotting specific patterns that occur during sharp drops in cryptocurrency prices. By understanding and applying this strategy carefully, you have the potential to increase your profits.
The Simple Plunge Strategy involves looking for certain signs: a strong and sudden downward movement in price, shown by a big candlestick with high trading volume. After the drop, the price often recovers to levels seen when the candlestick opened. By closely watching how the price moves across certain boundaries, you can find good points to enter trades and set your profit targets and stop-loss levels.
To use the Simple Plunge Strategy effectively, it's important to find the right entry points and manage your risk. You can find entry points by watching the price as it rises above the starting point of the candlestick with a big volume. To determine your profit target, you can use half of the candlestick range. And to manage risk, you can set a stop-loss order above the previous high point.
This strategy can be used with different timeframes, but looking at 15-30 minute intervals can give you opportunities for quick trades. When applying the strategy to cryptocurrencies, look for coins or tokens that have experienced significant drops with high trading volume. Watch how the price moves above and across the starting point of the drop to find potential entry points.
You can also find examples of Simple Plunge patterns on CEX platforms, which list various cryptocurrencies. Take a look at coins such as ETH, DOGE, and others to see instances where the price sharply drops and then rises again, indicating possible entry points.
Remember, the Simple Plunge Strategy can also be used in reverse to identify opportunities during upward movements. A similar pattern often occurs when prices rise.
We'd love to hear your feedback on the Simple Plunge Strategy.
Have you tried this approach in your trading?
Share your thoughts, questions, and experiences in the comments below.
Let's have a lively discussion and support each other in the world of trading.

EDUUSDT 4H Bullish scenario "Daily crypto market analyses I provide are personal opinions & not financial advice. Trading carries risks, so do your own research & seek advisor's help."

EDU : THE ALL TIME HIGH POSSIBLITYEUD showing an interesting view with a high possibility that it can breakout coming time to the ATH.
Our follow will be on this coin in the coming time.
EDU (Y23.P2.Video1).My initial thoughts...bearishHi Traders,
A quick video with initial thoughts based on what we have so far.
Highly speculative to what I'm assuming etc so take it with a grain of salt.
All the best,
S.SAri

Open Campus (EDU) formed bullish Gartley for upto 19% pumpHi dear friends, hope you are well and welcome to the new trade setup of Open Campus (EDU) with US Dollar pair.
On a 1-hr time frame, EDU has formed a bullish Gartley move for next price reversal.
Note: Above idea is for educational purpose only. It is advised to diversify and strictly follow the stop loss, and don't get stuck with trade

Cognitive Behavioral Therapy for Traders, p 1
Cognitive Behavioral Therapy for Traders
If you enter trades out of fear, excitement or depression, it's important for you to know how to change your mindset so you don't fall into this trap again. Let's talk about cognitive behavioral therapy (CBT).
How can trader change himself?
Cognitive Behavioral Therapy (CBT). We typically hear this term from psychologists, who help patients overcome a variety of anxiety and other personality disorders. But CBT can be helpful for anyone, who wants to make adjustments to their behavior. The following are some negative action pattern options that you can modify for trading:
❗️ Inconsistency in trading;
❗️ Violation of the rules of trading system;
❗️ Failure to follow a trading plan;
❗️ Lack of trading discipline;
❗️ Emotional trading;
❗️ Impulsive trading, overtrading;
❗️ Failure to comply with money management rules.
Don't think that it can't be fixed. That's not true. There are various psychological methods for it, and cognitive behavioral therapy is one of them. Of course, that's not an easy process in which a person sets himself a difficult task, but it is quite possible to replace bad habits with good ones. And besides, it doesn't require you deeply dive into your past. A cognitive behavioral approach is about what is happening in your life now and how it can be changed. In some ways, we all remain "Pavlov's dogs" - the more and more often we repeat a certain behavior model, the better it's remembered, eventually reaching almost complete automatism.
HOW DOES CBT WORK?
To understand how you can improve your trading with CBT, you must understand how it works. The main principle of cognitive behavioral therapy is the focus on the present. You will not spend a lot of time analyzing how and under the influence of what particular life circumstances your negative psychological attitudes developed and formed or worry about the distant future. Instead, you will focus on small, realistic, and simple steps you can take today to change your behavior.
🔺TRIANGLE CBT
Cognitive Behavioral Therapy is based on the idea of a constant interaction of three components:
✔️ your thoughts
✔️ emotions
✔️ behavior
All of them are very closely intertwined. If you change one thing, you change everything else. The process of changing our feelings is quite complex in itself, so in this case, cognitive behavioral therapy focuses mainly on transforming your behavior through changing your thoughts (or cognitions).
CHANGING THE WAY YOU THINK
In this self-therapy process, you analyze your core beliefs that drive your behavior. That's the pivot point. By changing these basic mental attitudes, you can change the way you think about trading decisions. For any behavioral problem, you can usually identify a set of underlying attitudes that drive that behavior.
Looking at some specific examples in the next few posts, we will see how you can make changes to your behavior and achieve better results in trading.
If you are interested in such a topic, push <> button and share with your friends, so this post will be seen by more traders, maybe it will help someone.
Thanks for staying with me
Always sincerely Yours
Rocket Bomb🚀💣

EMOTIONAL BURNOUT OF A TRADER Hello, dear friends!
This post goes as a continuation of the previous two, so if you haven't read it, I highly recommend it (link in pinned post)!
Today we are talking about <>. I think it's a pretty relevant topic.
Let's look at more general problem. Burnout, which is characterized by apathy, laziness, loss of interest in trading, and generally reduced vitality, probably most accurately describes state, that most of us well know.
Most traders are always emotionally extremely involved in the trading process, but sometimes even the most psychologically stable can give up.
About a year ago, at the very beginning of active trading, the once active beginner was full of enthusiasm and hopes for a brighter future. The head was slightly spinning from the huge financial prospects, and this gave an additional incentive to work. Such a trader at times could even forget to eat or sleep for the required number of hours.
However, by the end of the first year, the results didn't live up to expectations, and on the contrary, it turned out that were more difficulties than joys. He begins to feel, that all his efforts are in vain and lead nowhere. This causes him to lose interest in trading and become more and more apathetic towards this activity. Thoughts come, does he need it at all, all this trading ...
What hidden negative beliefs drive this trader's growing lack of motivation? The list might look something like this:
🔴 “All my efforts are leading me nowhere. I'm not moving anywhere: one step forward and two steps back."
🔴 "Nothing I've tried to do, didn't works, so my dreams have failed"
🔴 “A trader needs to be born or have a talent for this occupation. I may never be destined to be a trader.”
🔴 “Trading systems and strategies, that work for others don't work for me. There's something wrong with me"
🔴 "Maybe I'm just unlucky"
🔴 “Doing the same thing over and over and expecting a different result is crazy. I'll go crazy if I keep doing this."
It's easy to see how a list of such or similar setups can negatively affect a trader's self-esteem and make him feel negative about his own efforts. He actually spirals into apathy, at least as far as his trade is concerned.
The problem is that the more multidirectional and chaotic efforts such a trader makes in his work, the worse the result becomes and the more he is convinced of his negative statements.
Of course, it is impossible to change your own thoughts in an instant, but you can start working with it systematically.
Thought is the foundation and catalyst of action. By changing the paradigm of thinking, we will inevitably change the quality of our actions.
🟢 “You can quit everything, but that's not the best way. Although I feel, that I'm marking time, but during this time I have learned a lot, learned a lot and continue receive new knowledge every day. Quantity will turn into quality, and I'll be able to move more intensively towards my goal."
🟢 “While things I have tried haven't bring me a results I want, but it doesn't mean my future efforts won't get me what I want. I have a huge knowledge base compared to a year ago. It will help me succeed.”
🟢 “No one is born to be successful at anything, and trading is no exception. If I really like trading, I can find a way to get good results.”
🟢 "I'm alright. Systems and trading algorithms, that don't work for me are systems that I either misapply or may not fit my personality. But there is a trading strategy, that is perfect for me, and I will create it myself.”
🟢 “The factor of luck is certainly present in my life, but it's not decisive. After all, my hard work will help me move forward. My intellectual baggage and everything I have learned during this time will help me gain control of my life."
🟢 “Maybe I should consider some changes in my life and work, but it's not crazy, I believe, that daily hard work eventually leads to success. Anyone who has ever become an expert at something or been successful has experienced failure. In any case, I always have the opportunity to seek qualified help if I need it to move forward faster.”
These new mental attitudes are much healthier and can help the trader to reconfigure their behavior. Thought is the foundation and catalyst of action. By changing the paradigm of thinking, we will inevitably change the quality of our actions. This applies to absolutely any activity. The examples discussed above illustrate how reformulation of internal dialogues can lead us to a change in the quality of attitudes, to a deeper self-awareness. It gives us an opportunity to make more reasonable and accurate decisions during trading, and in general.
I hope you enjoyed this post, write in the comments what else you would like to see in my next posts!
Stay with me, subscribe, for not get lost. I will be glad to see your activity by clicking 👍 like button ♥️
Always Sincerely Yours Rocket Bomb 🚀💣
