💥Strategy in Crypto World 💥In cryptocurrency trading You can't rely on a fate. To become successful trader and effectively open positions and earn income in the future, You need to have a clear strategy.
Trend trading
Asset quotes always move according to the trend, which can be up or down. A trader can open positions in the direction of the trend, i.e. buying when the trend is up and sell when the trend is down.
The most difficult moment for novice investors is the definition of a trend, for that it's necessary to determine the key local lows and highs.
For an uptrend, each next point must be higher than the previous one, and for a downtrend, local highs and lows must be lower than the previous ones. Then we can safely talk about the presence of any trend.
Trend change
This method is more complex and requires basic knowledge in technical analysis. A trend reversal can be used to open new trades, but the difficulty of such a strategy lies in correctly identifying a possible reversal. Several indicators can be used for this.
The first tools are the moving average (MA - Moving Average) and the exponential moving average (EMA - Exponential Moving Average). These indicators determine the current trend from previous values.
There is a high probability, that the price will sharply change the local trend when approaching this line, and the larger the “timeframe” (the time interval enclosed in one candle on the chart), the more significant the resistance at these levels.
The next tool is the Relative Strength Index (RSI), which shows the strength of the current trend. The main signals are the intersection of lines with overbought and oversold zones, i.e. values close to the upper (100) or lower (0) limit. The closer the RSI line is to 0, the more the downtrend weakens, and the closer it is to 100, the less the price growth strength.
One of the most common among novice traders is the MACD moving average convergence/divergence indicator. The main thing to know about this indicator is that it tells you where the market is likely to go next.
To correctly recognize the convergence / divergence of moving averages, you need to open two lines on the chart of a trading pair - a signal line and a MACD line. When the MACD crosses the signal line from below, it forms a bullish crossover, and when it crosses from above, it forms a bearish crossover. That is, when the MACD line is higher, it is a signal of an uptrend; when it is lower, that's a signal of a downtrend. That's indicator is very simple, quite visual, not cluttered with unnecessary data.
Purchase in equal parts
The easiest way to start investing in cryptocurrencies can be a long-term accumulation of digital coins with regular purchases in equal installments. You can invest a fixed amount in favorite coin every month.
The advantage of this strategy is that you can buy an asset regardless of the market situation. If the price of a cryptocurrency start falling, then subsequent purchases at a lower price can average the entry point. This strategy works for those investors, who have a long-term vision for the growth of the asset.
What principles You follow in the cryptocurrency market?Share with me in the comments😉
Are you interested in these kinds of posts? If yes, I'll be glad to see your approval - by pressing the like button 😊
Thank you for staying with me🙏
Always Yours Rocket Bomb🚀💣
EDU

Top Crypto Influencers To Follow In 2021(🔴PART 2)Hi guys
As I promised in the previous post about influencers, I also posted the second part for you, there are 6 other people on my list, and if the number of likes reaches 270, I will post it for you as well.
✨1.Loomdart(@loomdart)
Loomdart is a cryptocurrency analyst and veteran trader who has been actively dishing out well-researched, pertinent trading and investment tips and strategies on Twitter since mid-2014.
✨2.Starbust(@cryptostardust)
Also known as Inversebrah in the crypto community, Starbust can only best perfectly described a crypto memes connoisseur. Much to the amusement of his thousands of followers, Starbust's online persona brings a satirical and comical twist to the often over-serious and overcomplicated debate on cryptocurrencies and his popularity is only rising, so you might want to follow him to a laugh or two
✨3.Lil Bubble(@TheCryptoBubble)
Popularly known for producing parody versions of famous songs by the likes of Blink 182 and Avil Lavigne, Lil Bubble is undoubtedly the biggest satirist in the cryptocurrency space with hits like All Time Lows and Liquidated pushing him into an bigger online stardom. His productions can be found on Instagram and Twitter.
✨4.Altcoin Sara(www.youtube.com)
Sara is a rare female face in the crypto space and one of the community’s biggest advocates through initiatives like the Altcoin Buzz Ladies YouTube channel, where she discusses cryptocurrency news, provides market analysis and offers a platform for alternative perspectives in the world of blockchain.
✨5.Credible Crypto
Your main stop for understanding crypto trades, trends, and the marketplace at large is none other than Credible Crypto. Through his relentless quips on Twitter, Credible Crypto shares market analysis and investing advice with a healthy dose of humor thrown into the mix. He also does a superb job at breaking down key concepts and delivering a simple and approachable strategy to crypto investments and business
✨6.Changpeng Zhao(@cz_binance)
More commonly known as "CZ", this business executive is none other than the founder and CEO of the world's largest cryptocurrency exchange - Binance. With an impressive track record in software development and trading for Bloomberg, CZ also found success while working at Blockchain.info before moving on to found his own startup. He frequently shares his wealth of knowledge on Twitter, earning him a solid spot on this list of crypto influencers.
✨7.Nicholas Merten(@Nicholas_Merten)
Nicholas Merten is the founder of DataDash, the largest and arguably one of the most influential YouTube channels solely dedicated to covering crypto-related news. He's equally active on Twitter.
✨8.Roger Ver(@rogerkver)
Another early investor, Ver has supported a number of cryptocurrency startups and projects over the years, cementing his status as 'Bitcoin Jesus' (as he likes to proclaim himself). He's also a leading digital philanthropist after major donations toward economic education. He currently serves as CEO of Bitcoin.com and you can find him Twitter.
✨9.Vitalik Buterin(@VitalikButerin)
The co-founder of Ethereum (and the world’s youngest known crypto billionaire), boasts a massive online following, in large part due to his outspoken and opinionative views. The Canadian-Russian programmer isn’t exactly shy when it comes to stoking debate over some of the crypto industry’s most controversial aspects and has been praised for tackling sensitive issues head-on. He uses his platform to put pragmatism and principles before crypto politics. Buterin has also become a leading crypto philanthropist, making hefty donations to major causes. Follow him on Twitter, where he tends to drop some pretty big announcements.
✨10.Gavin Andresen(@gavinandresen)
Primarily known for his crucial contribution toward developing Bitcoin during its initial phase, Gavin Andresen was considered Satoshi Nakamoto’s right-hand man, taking over from the Bitcoin founder after his abrupt departure from the project in 2010. Andersen then went on to become the face for Bitcoin as it exploded into mainstream consciousness. He’s since gone into semi-retirement but still plays a big and influential role as Chief Scientist at the Bitcoin Foundation. You can find him on Twitter.

ZME Potential Gap. Curling. Curling here on daily. Used highest volume day as a beacon for potential trendline in green. Gapping on these Chinese Edus is common.

TradingView Hotkeys That I Use The MostHi,
Just wanted to point out some TradingView hotkeys that I use the most:
* ALT + H = Horizontal line - a great way to quickly mark the round numbers on your chart or tight support/resistance areas.
* ALT + V = Vertical line
* ALT + T = Trendline
* ALT + I = Invert the chart - probably the most interesting hotkey. Do you have some trouble taking "SELL" ideas? You are more kinda "BUY-guy" or vice-versa. In TradingView you can turn your chart upside down and see does it look good if you would want to buy it. Sometimes, it is quite a big help.
* ALT + S = Take a screenshot of your chart
* ALT + F = Fibonacci
* ALT + W = Put the chart to the watchlist - seeing something interesting you can add it quickly to your watchlist.
* ALT + A = Set the alert
* SHIFT + CLICK = Measure tool
Regards,
Vaido

EDU a "nonprofit organization"China's crackdown on for-profit education companies was a disaster for traders not using a stop loss.
In the 52 Week Range EDU New Oriental Education & Technology Group Inc. went from 19.9740 to 1.9400usd.
After-school tutoring institutions must transform themselves into "nonprofit organizations".
Jim Cramer (Mad Money) on China's tech crackdown: You can't own Chinese stocks!
ARK Invest dumps Chinese stocks.
It seems dangerous to hold Chinese stocks right now.
US-listed Chinese companies have three years to comply with US accounting oversight, to comply with the rules of accounting and transparency that American public companies must follow, if not they will get delisted.
This looks like the beginning of China`s stock market crash.
I`m looking forward to read your opinion about this!

All About The Trendline.Hi,
Trendlines: if you do not have any rules to draw the trendline (TL) then this is the most subjective technical analysis criterion of all.
Without any rules, you can draw it basically as you want to see it. It is a perfect criterion to talk yourself into the trade or to talk to stay in the bad trade, always there is a new "support" coming. If you do not have any rules to draw it then basically all the time you can find some dots to connect which can seems "perfect" for you.
In this post, I'll talk about buying opportunities from the trendline analyzing crypto and stocks. Some rules to draw it and some typical mistakes you should avoid.
Let's start from the basics. Obviously, you know that to draw a trendline we have to connect two points and waiting for the third one to reject from it. Easy yes!? NB: For me, the third and the fourth touch are the most reliable touches to wait for. The strongest trendline comes from the points which are easily recognizable - a blink of an eye.
If you start looking deeply from where to draw a trendline then keep in mind that it is not the strongest! One second and you will know from where I should draw it!
There are some "experts" who say: you cannot draw a trendline without three touching points. Phh...as you see on the image above, I can, and as said if I have a correct lineup the third touching point is the strongest.
The second myth for me: the more touches you have on the trendline the stronger it is. Yes, the trend is probably stronger, but for me, every next touch increases the odds for a break/trend change.
Sure, I have done great trades from fifth or form the seventh touch but in general, the criteria crossing area has to be quite strong and it has to consists of many strong criteria to do that.
Why I don't like to trade for example fifth or sixth touch? Firstly, the trend is your friend until its end. The market moves up and down, as said the more touching points you have, the odds will go higher for the trend change.
Think like that, basically TL works as a support and the support is hmm...like the 5cm ice on the lake. You cannot break it with one hit, you cannot break it with second or third (ok If you are strong then you can :P). Fourth, fifth it starts to crack, and the sixth...booom...you are in the water. I don't know was it a good parallel but for me, it works the best - the more touches you have the lower chance for sustainable further growth it is.
RULE nr. 1
It is true, that you can draw it in many many ways but let's talk about the first rule. If there aren't any anomalies then the trendline should be drawn "always" from wick to wick (image above) or from body to body. "Always" because there are some cases from where you should draw a bit wider trendline but in general it should be like the prementioned rule.
If you start from the wick and the second point is from the body then this is a mistake. The mistake can lead you into quite an ugly trade/investment. If you trade breakouts then it will be misleading for you, if you trade rejections from TL then it will put you in a thought situation - do I should close it if it falls lower or whatever, simply don't do it.
If you don't have any significant large wicks then go from wicks. Usually, it will give you the most precise price zones from where to grab something. If you can draw the trendline but one touching point consists of large/huge wick (selling panic or whatever it was) but on other hand, it is quite a normal price action then use candle bodies to draw the trendline. This panic-wick can mislead you. Drawing from the bodies just widening the buying area a bit but still, it gives you a good zone to keep an eye on.
If there are a lot of wicks, then there is also a good way to go with a line chart instead candlestick.
Candlestick chart
Line chart
As you see the line chart removes the market noise and you can simply see the closing prices. I use it quite a lot because some altcoins or stocks are quite jumpy and to remove the noise I use a line chart to determine the strongest areas. Stora Enso Idea
Let's jump into rule number two. If we will wait for that third touch then there are quite a lot of small rules to keep an eye on. We want to be perfect so let's find a perfect trendline.
RULE nr. 2
It increases the odds of rejection from TL if the price has made a new higher high (HH) after the previous rejection.
As you see, after the third touch of the trendline, the price has made a new HH and the fourth worked perfectly.
- two touching points, we can draw the trendline, waiting for the third touch and if it comes the market has made a new HH after the second touch and we are ready to take it.
Summary: After the price prints the second point from where to draw the trendline we have to see a new higher highs formation after every touch. This is a great sign that the trend is strong and if everything lines up perfectly we can step in.
RULE nr. 3
It increases the odds of rejection from TL if the touching point timings/length are pretty much equal.
After the price has printed a new higher high and coming back down to make the third one it is great to see symmetric between touching points. At the moment, we have a great symmetric and trendline as a criterion is in place! This simple rule shows you that the market is healthy, moves on decent cycles as it should be, no pumps, no dumps just a simple and clean one.
The second example:
As you see gaps are quite similar and the 4th touch worked almost perfectly. Waited for rejection and stepped in after I saw a decent volume from the trendline.
They cannot be the embarrassingly accurate length, otherwise, they would be extremely few, but they cannot be as in the picture below.
Uuuh...this is ugly and actually, I see it quite often. The first and second points are too-too close considering the third touch. The third touch comes in the middle of nowhere but as said, it is a perfect way to talk you into the trade/investment. This is ugly, it is with a very low success rate so try to avoid it.
The most important rules are in place and now it's a good time to talk about mistakes. I cannot say that they are 100% wrong but in general, these mistakes can be with a very low hit rate.
Sometimes looks like we have all set and ready. We can draw perfectly from wick to wick, we have new higher highs after touches, we have an equal length between touching points but it just doesn't work. Obviously, from time to time it happens but most of the time there are some reasons behind that and one of them can be the angle of the trendline.
It is a bit subjective but for me, the best angle of the trendline stays between +-20 to +-35 degrees (in TradingView you can use it). Then I can trust it the most. I remember that the most common mistake for me I tried to buy too sharp angles 45+ degrees. To long below 20 or above 35 degrees you should have a lot of criteria to match with the trendline to determine the strong setup otherways try to be cautious if it doesn't fit inside my given numbers.
Next common mistakes:
As you see in the image above, after the third touch, we haven't seen a new higher high but the price already touching the trendline. It isn't a good sign for further growth. Does the bulls have lost their momentum or for whatever reasons the market didn't print the new higher high. This can be simply one of the trend reversal signs, bulls have lost their momentum and cannot print new ATH for example. Read between the lines and do not consider buying from the trendline if the market hasn't made a new higher high. Obviously, you can but as said, it can be a bit lower hit rate.
Here is also a second mistake, another no-go criterion for me. Do you know it already? Go and look...
Yes, correct! ;) Firstly, we haven't seen new highs and secondly, the trendline touching points (1 to 2, 2 to 3, 3 to 4) are not at a similar length. The fourth touch comes too early/fast. Another rule which can ruin your "perfect" trade from the trendline.
So, two simple mistakes to avoid. To get a better success rate from the trendline you should wait for a new higher high formation and the market cycles should be quite similar between touching points.
Breakout trades.
If the trendline looks strong but cannot get any support from other criteria then I'll start to look at selling opportunities after the breakout.
As you can assume, this isn't as simple as some guys on YouTube will sharing with you. I have also some rules here to make breakout trades.
Firstly, the price should come from an all-time high or from a mid-term high, print a short-term lower high, and then breaks. This is a good scenario because then there are some FOMO retailers who bought from the top, got a little hope for a bounce upwards, and as you should know, really often they get punished who bought the top.
Secondly, and most importantly, the break must occur with a strong and powerful candle without any significant lower wick. Basically, if you have clean touches from the trendline then it has shown its strength and the strong candle break confirms it even more. How? If the price falls below the trendline just simply with small candles then it doesn't show the strength enough to trust it on the retest. A strong and powerful candle needed! We need to see that power because after the break we start to wait for a retest of it. The strong candle shows that the trendline is still valid but in vice-versa before it acted as support now it starts to act as a resistance. Another example.
Let's talk a little bit about the timeframes. Obviously, the higher is the timeframe the stronger TL is. If I analyze stocks then I trust the most monthly and weekly timeframe. Considering crypto, there I use Daily and 4H but most likely Daily. To be said, 1H is the minimum.
That's about it. The post got quite a big one. uuh...simple trendline yes?! ;) A lot of left unspoken (minor trendlines, how fast it can come to touch it and etc.) but in general you should get at least something from here to add to your analysis. Was fun to write it but this is just the beginning. I have 15 criteria to analyze the charts. Maybe I should write an e-book about technical analysis what you think!? :) Trendline is just one of them and it isn't even the strongest criterion on my list. Doing the analysis I have 15 criteria and depending on the timeframe 3 to 7 of these 15 must be in one strong area together! So don't just go for a trade/investment if you only have one criterion, the trendline.
Hopefully, you like it, all the best!
Vaido

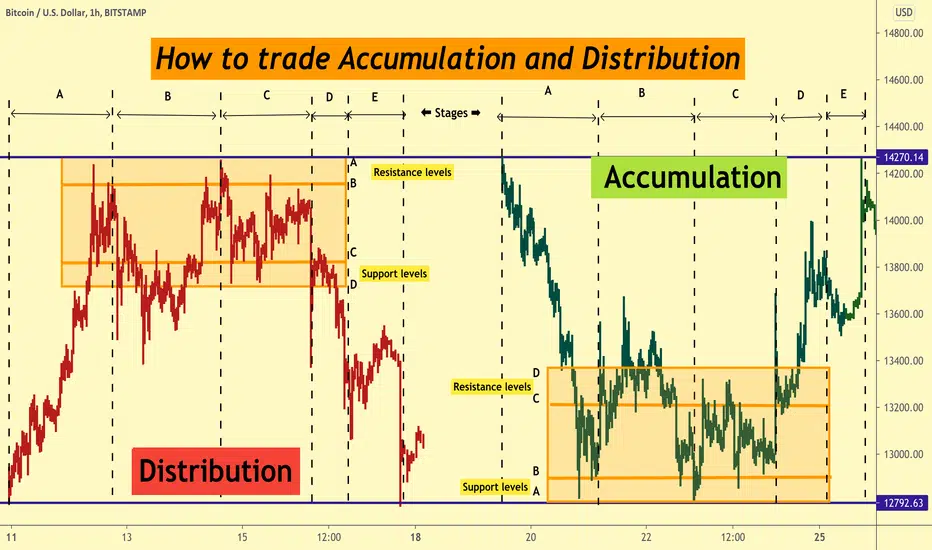
Accumulation and distribution zones!🥸Hello, traders! Today I wanna tell you about accumulation and distribution zones!
⚡Prices always go from balance to balance and no other way!⚡
Wyckoff said that the price always following one of the 4️⃣ phases:
💥the consolidation zone (flat), where the big player is gaining volume , is called accumulation;
💥if after exiting the flat, demand is higher than supply, then the price rises and an up-trend development is observed in the market;
💥the area of consolidation (flat), where large players exit the position, is called distribution;
💥if after the release the supply prevails over demand, then a down-trend is formed.
If you look at these 4 phases of the market, the key problem of forecasting further price behavior will lie in the first of them, in accumulation, when it may not be entirely clear where the price will go after.
Below, based on the Wyckoff and VSA method, I'll show how to correctly assess the situation and take a position in the right direction.
🔋🔋🔋Accumulation🔋🔋🔋
🏹Phase A - Market Stop.
🏹Phase B - Supply and demand balance.
🏹Phase C - False Breakdown.
🏹Phase D - Search for entry points.
🏹Phase E - Beginning of a new trend.
In the ❗distribution❗ phases, everything is similar to the accumulation phase, only upside down.
Important💣💣: don't go into shorts in the accumulation zone; in the distribution area don't go into long!!!!
Guys, if you liked my post, put me 👍🏻 and write a comment✍🏻
Don't forget to subscribe, if you aren't already😆
And of course, stay with me, dear💓💓💓
Your Rocket Bomb🚀💣
Long | EDUNYSE:EDU
Possible Scenario: LONG
Evidence: Price Action
TP1~ 15.5$
Call options, Strike 15$, 05/21/21
This is my idea and could be wrong 100%,

AAD PATTERN1 a price breaks out from support line of the big bearish pattern
2. a price must breakthrough last HL of the bearish pattern
3. entry when small pattern breaks out 4.
look for examples from the realtime charts

EDU (NYSE) - Move UpGreetings
Humbled, we would like to thanks for your support who has already liked, commented and followed us. Your support, strengthens us, to help in analyzing the market. If you have any questions, feel free to send us message (inbox).
Pra Trading :
- Please care for Money Management
- Have a good psychology
- Do not be hurry to open position and do not do nothing if u see opportunity
- Evaluate and upgrade your trading plan
Execution Strategy :
- Know what you want to buy, see the Fundamental
- Decide that you are on investing or speculating
- Consider what your strategy based on Investing/Speculating
- Make Road Map Of Your Trading Plan
- Decide
a. Entry strategy
b. Cut loss
c. Target of Profit
Post Trading :
a. Do not be sad if you loss or do not be very happy if you win
b. Just become a normal without emotion, Do not put emotion into your trading
c. Evaluate your trading
d. Keep on Learning
e. Be Humble
Idea :
EDU (NYSE) - Move Up

⭐ PSYCHOLOGY of TILT⭐ ⭐ LOSING TILT ⭐Hi, My friends! Let's go Forward to knowledge💪🏻Today i made psychological EDU post for You😊
Psychology of Tilt: Losing Tilt
Reaction 1. The desire to recoup with increased risk
It's difficult to find a market player, who has never had a strong desire to recoup and didn't go on rash actions because of this.
When we using the term "tilt" most often we mean precisely this reaction. We can say, that it's the main variety of tilt. And that was given the greatest attention in scientific research, including the desire to recoup is the basis of pathological gambling.
Among the factors contributing to the emergence of the desire to recoup can be identified:
📌- Dispersion of the game
📌- Bet size
📌- game speed
📌- Frequency "near misses"
The last factor needs clarification. “Near Missing” (near misses) is the outcome of a bet in which the player was defeated, but was close to winning.
“Near misses” are less pleasant for a person, than losing without a chance of winning, but at the same time cause a desire to continue the game.
1. Explanation through the theory of perspectives
According to this theory, the function of the subjective value of wins and losses has a specific form, and after losing a person falls into that area of the function, which is characterized by a desire for risk. This is easier to show on the chart.
Suppose, after losing, the player gets to point A.
Due to the features of the left side of the function, any further loss (further movement to the left side) will have less subjective significance for it than a gain (reverse movement to the right side) of the same size. And since potential gains become more significant than potential losses, the desire for risk increases.
This function of subjective value is an empirically established pattern.
Features of the perception of losses and wins are also characteristic of a person's perception of other phenomena.
In other words, a person’s perception of gains and losses in the manner described by them is simply a property of the human psyche. Thus, the desire for risk after losses caused by such a perception is also simply a certain basic characteristic of a person.
2. Explanation through a player error.
Player error is a common misconception in understanding random events. A person who is prone to this error believes that the more often a random event occurred in the past, the less likely it will happen in the future and vice versa. This mistake is based on the belief that random manism should not generate extended series of the same type.
Due to this mistake, the player after a series of failures will consider that the probability of his future wins has increased and as a result will continue the game with special persistence.
It is difficult to argue that the player’s mistake contributes to the desire to recoup with an increased risk.
3. Explanation through the threat of "I".
The emerging threat of "I" causes various protective reactions. One of these defensive reactions is the desire to recoup with increased risk: quickly returning the lost money, the player will retain the idea of himself as a fairly strong plus player.
It is also worth considering that the threat of “I” is a well-known trigger of anger. And anger mobilizes a person’s energy, instills in him a feeling of confidence and strength, and prepares for an attack.
Summing up the consideration of various approaches to explaining the desire to recoup with an increased risk, it is worth noting that these approaches are not mutually exclusive. They rather complement each other. In other words, most people may indeed have some basic tendency to increase risk after losing, which is reinforced by the player’s mistake and perceiving the loss as a threat to “I”.
Reaction 2. A sharp risk reduction
Not all players are characterized by an increase in risk after a significant loss. Having suffered serious losses, some traders can continue trading, but use only the most reliable strategies,
Speaking about the desire to recoup, they almost always assume that this desire is associated with increased risk. However, it is important to understand that lowering the risk does not necessarily mean a complete rejection of attempts to recoup.
A reason for avoiding risk after a defeat may be a hot hand fallacy error. A “hot hand” error is another misconception in understanding random events. The essence of the error lies in the fact that after observing a long series of events of the same type, people cease to believe in random outcomes and predict that a series of events of the same type will continue.
As a result of this mistake, a player after a series of defeats may begin to think that under the circumstances, his chances of winning are objectively underestimated (“they started a twist against me”) and make a logical decision about the need to reduce the risk.
I hope you enjoyed my post. I tried hard for you💋
Stay with me😉
Love you♥️
Your Rocket Bomb🚀💣

Using MA on BTC's example!Hi! Moving averages are one of the most popular technical indicators. They have various types, but they have one purpose - to determine the current trend by smoothing out volatility and noise. Let's look how MA works on price movement of BTC!
The crossing of the slow MA by the fast one from bottom upwards gives a signal to buy, from top to bottom - to sell
- The simplest form of a moving average is known as a simple moving average (SMA). It is found by calculating the arithmetic average prices for a certain period of time;
- Exponential Moving Average (EMA) assigns more weight to the latest data, which is why it is more preferable;
- The main functions of moving averages include identifying trends and pivots, as well as support and resistance levels;
- Moving average can be a risk management tool. Thanks to it, you can set a stop loss and cut a losing position;
- The most popular moving average signals are their intersection with the price or their intersection with each other;
- Crossing of the moving average price upwards gives a signal to buy, downwards - to sell;
- Moving average signals can be false when pairs are trading in flat or when a gap forms;
- Moving averages should be combined with various indicators and oscillators. So their signals will be more accurate, which will lead to the opening of profitable positions.
Hope My post was helpful for You♥️
Stay tuned by Rocket Bomb 🚀💣

How to reduce your fear in #crypto trading?1-Don’t go all in
2-Manage your risk
3-Reduce your position size
4-Trade with a strategy that offers an edge
5-Not more than 50% of your wealth in the cryoto market

Possible scenario on the next fate of Bitcoin!Hi, quick update on mid-term perspective of Bitcoin using Elliot waves!
Take Your profits by growth! Ans stay safe!
If You wanna know more about Elliot waves, read my edu post!👇
Stay tuned by Rocket Bomb🚀💣

😱Types of Fears in Trading😱Hello! There are several types of fears at the market!
There are several main types of fear:
💡- fear of losing all capital in the account. One of the most common fears. The trader clearly understands that the numbers in the terminal are his money, and their reduction limits his financial capabilities in the future. Under fear of losing an even larger sum, a market participant does even more stupid things or even refuses to trade;
💡- fear of losing money in a losing position. Similar concerns arise during the transaction period under the influence of strong market volatility . This kind of fear is easily correctable;
💡- fear in time not to see a signal to enter or exit the market. More often it's faced by newcomers, who will not imagine what risks are in the trader’s deals and how to protect themselves from them;
💡- general fear of working on the market. It can act as a negative background and prevent you from making the right decision. Often, such fears are eliminated by gaining certain knowledge and experience on the exchange;
💡- fear of receiving another disadvantageous deal. Such fear leads to the appearance of excess fuss. As a result, the trader misses a really good deal;
💡- fear of early fixation of income (fear of loss profit). The position could still be kept open, but the trader reduces his risks, closes the deal and receives less profit. For many market participants, the fear of making such a “mistake” is even stronger than the fear of losing trades.
Guys, it's ok to feel all types of fears ! Especially for those , who new at the market !
Everyone went through that. Someone overcame own fears, someone is trying to overcome, but someone hasn't gotten along with emotions and left the market!
Remember, if you have a goal - go forward!💪🏻 Look only ahead and listen only yourself !🙏🏻
If you wanna become successful - you'll surely become that!!!🚀🚀🚀
Let's become better together ♥️
Stay tuned by Rocket Bomb 🚀💣

Maybe it's time to get out of comfort zone?🧐
Have you noticed, that one of the most comfortable sleeping positions is curled up in a ball. The legs are pulled up to the stomach, the head is lowered, the arms are hidden on the chest, the back is slightly arched. Cover yourself with a blanket and sleep. Warm, dark and calm. A sense of safety arises.
And the secret of this protective posture is in subconscious imitation of the fetus in the mother's womb.
There, in the warmth of the mother's womb, is the first comfort zone, that a person leaves when he is born. Subconscious memories of how comfortable, calm and good it was, remain with us for life.
If you wanna live, you have to be born.
For a baby, this jerk is extremely uncomfortable. You find yourself in a cold and unfamiliar place, and some monster slaps on your 🌰🌰 🤣🤣
After a while you want to eat and drink, and you have to do it yourself, and everything around is so huge, loud...really don't wanna repeat that.
Therefore, subconsciously, we always resist leaving our comfort zone. The experience has already been. Didn't like it!
But the stress mechanism, that is triggered during childbirth (and then every time you leave your comfort zone) is a protective function of the body. Stress activates the reserves of the body and brain, forces us to act more actively, to fight the aggressive world.
However, nature also took care of the reward.
If stress doesn't become constant, but is a one-time surge, that activates forces, relaxation and satisfaction follow.
So, we figured out the physiology of the comfort zone. Why going beyond it guarantees stress is understandable. Now the question is: <>
The birth of a trader
In fact, everything new, unknown and unusual is outside the comfort zone. Even if we go to the store in a new way - that's a mini-stress for our brain, forced to work out a different route instead of saving resources while the body is moving on autopilot. Any change of scenery, new job means going beyond the familiar world. And the higher the unknown, the more uncomfortable the path.
For most people, trading is terra incognita. Trading isn't taught at school, it's not taught at universities. Trading forces you to take responsibility. Most importantly, trading is always associated with risk.
Risk is danger and uncertainty, and the brain reacts accordingly. He begins to ask insistently: "Do you really need this? No, are you sure?"
Leaving the comfort zone and becoming a trader is also hindered by social stereotypes. First, society reacts negatively to any attempts to break the system, that is, to do something that goes beyond the standard life path: creativity, politics, business. Secondly, trading is one of the areas, that make most people wary (and statistics, according to which only 5% of traders achieve success, reinforce this feeling). So if you want to become a trader, you are already challenging society.
That's why the birth of a trader so often becomes a struggle with the usual way of life, basic attitudes, other people's opinions and yourself.
What happens, when you become a trader ?
Think your comfort zone problems will end? Nothing like this. Two ambushes await the trader. The first is the inability to cope with responsibility for your life.
The second ambush is stagnation. After overcoming difficulties, learning to trade and starting to receive a stable profit, the trader finds himself ... Right, in a new comfort zone!
After all, what is it? The comfort zone is above all stability.
But the calmness puts you to sleep. Periods of economic stability in history often turn into a stage of stagnation and stagnation. The same in human life. Psychologists Robert M. Yerkes and John D. Dodson established as early as 1908 that performance doesn't improve in a state of comfort. Motivation falls asleep.
In order to become a successful trader, it is not enough to leave your comfort zone. You may have to struggle with its attraction more than once.
Therefore, leaving your comfort zone, take care of your psyche:
✔️Pump up motivation. Be clear about why you are breaking the wall and whether you need it.
✔️Work through your fears so that the body does not engage in self-sabotage mode.
✔️Develop resistance to stress and brain flexibility. Choose non-standard routes more often - in the broadest sense of the word.
✔️Take care of insurance, think over different scenarios for the development of the situation.
If you feel that getting out of your comfort zone is difficult for you, do not take a running ram. Take small steps.
Have you ever tried to leave your comfort zone?
Stay tuned by Rocket Bomb🚀 💣

Things I ask myself before a trade in cryptoThings I ask myself before a trade:
1 What's the market structure, range or trend?
2 Where are the major SR areas?
3 Can I lean my stops against SR?
4 Where would opposing pressure come in?
5 How is price moving, chop or clean?
6 Volatility expanding or decreasing?

Unsure About Your Trading Strategy in #crypto? (Then Do THIS)
1.stop trading
2.4 questions
Where did you learn it from?
Why does it work?
When does it work?
When doesn’t it work?
if you are interested any crypto that you want analyze with me and any questions please do not hesitate and comment below the chart!
if u like it press like-comment and folow me.thx

When should you not buy into support?(only 5% of traders know)1-lower highs into support
-sellers are in control
2-higher timeframe in a down trend
3-unfavorable risk to reward ratio
4-support tested multiple times
if you are interested any crypto that you want analyze with me and any questions please do not hesitate and comment below the chart!
if u like it press like-comment and folow me.thx

Why Most Traders Lose Money #Scalping The Market in #crypto1-caught by news
2-don’t have what it takes
3-cant read price action
4-wrong expectations
5-get killed by commissions
if you are interested any crypto that you want analyze with me and any questions please do not hesitate and comment below the chart!
if u like it press like-comment and folow me.thx

#education #crypto #tutorialHow Many Indicators Should You Use In Trading?
1-Identify a trend
Example:200ma
2-Define an area of value
Trends line-S&R
3-Entry trigger
Price action-stockastic cross
4-Trade management
Example:Parabolic sar
-it depends on what trades you are looking for
if you are interested any crypto that you want analyze with me and any questions please do not hesitate and comment below the chart!
if u like it press like-comment and folow me.thx

How to tame Crypto Market?🤑Hello, dear bottom catchers😉
It's difficult looking at the market correction. Waiting for a strong and prolonged correction is doubly difficult. Fears and concerns are very easy to understand, when we see today's prices 😱
Each of Us wants to catch the very bottom. With a high probability I can say, that's almost impossible!
You can ask me <> I can answer You😉
1. Undervalued buy orders. Trader expects to see price too low and misses the opportunity to buy during the correction
2. The price hits the bottom too quickly and simply "flies" up. That's very typical of Bitcoin
3. Greed. That's a terrible vice. A trader, seeing, that the price goes down for a long time, constantly looks at the movement and tries to predict and grab the bottom, but that's impossible without experience.
I can give You advice for protect Yourself!💥
Split Your buy orders🔥🔥 (that's part of my strategy).
What does it mean?
Using Fibo levels, find the "golden mean" of the retracement and set several buy orders in this zone.
(How to use Fibo levels, You can find in my next EDU post, stay tuned )
What will we get from it?💥
1. We don't have to worry about missing the opportunity to buy at a discounted price. By splitting orders, we can average the average purchase price.
2. You don't have to sit at the computer all day and not spoil your nerves. Take a rest. And You'll forget about greed
What do you say, friends?
I really wanna be useful to you, guys!
I make every post with love and it brings me extraordinary pleasure!🙏🏻
Thank you for staying with me💋
Always sincere with You🧡
Your Rocket Bomb🚀💣

9 Golden Rules of Effective Money Management 9 Rules of Effective Money Management in Trading
1. Choose the correct position size.
The basic rule is one: don't forget to minimize your risk and correctly calculate position size in every deal.
For example, you can invest all initial capital in one trade. But why? After all, you can never be sure, that particular deal is guaranteed to bring profit. Many professionals use the "Rule of 2% " - when in one position a trader risks no more than 2 percent of him deposit. In this case, if the trade is closed at a loss, you'll only lose a small amount of money.
There is also an alternative approach, where the trader risks a fixed amount of money (for example, $ 5), that he would be comfortable with losing.
2. Don't trade too aggressively
One of the biggest mistakes is too aggressively trading . Even a small series of several losses in a row, with an incorrectly selected position size, can lead to a significant decrease in the size of your deposit.
3. Always set Stop Loss
Placing a Stop Loss order for each trade has practically no drawbacks, only advantages. Very often, traders become emotionally attached to their trades, which can be fatal.
For example, if a trade becomes unprofitable, an emotionally involved trader will not want to close it and will believe, that the price can still turn around and go in the right direction. Setting a stop loss helps overcome this problem. Thanks to the stop order, you can strictly control the ratio of profit and risk. You should always follow this rule, so that money management in trading gives you tangible advantages, and the deposit doesn't melt before our eyes.
This is one of the basic principles of risk control. Certainly not the only one.
4. Be careful with leverage
In the cryptocurrency market, many traders use leverage. It can be useful, but using it can also lead to huge losses.
As long as you rationally sizing your position and not using too high leverage, then you are fine, you are safe.
5. Keep your emotions under control
Capital management in the market full of emotions: from excitement and euphoria to fear and frustration. Try to free your mind of emotions - this will help you make rational decisions. The easiest recipe not to lose money is to take control of your emotions. All wrong trading decisions are usually made under the influence of emotions.
6. Take responsibility for your results (both losses and profits)
How to manage capital? First of all, with full awareness and responsibility. Traders must recognize, that their trades can be both profitable and loss-making. Assuming every transaction will be successful you can be wrong. A realistic trader knows that any result is possible and is ready for it, while accepting at the same time what the market will bring to him.
7. Manage your risk and avoid overtrading
A trader should get into the habit of analyzing all types of risks. You should zvoid overtrading, which is often the case for newbies traders , who don't have a plan. With such an approach, the attempt to stick to effective money management in trading often ends in failure.
8. Set the position size and take profit level
It is a key element of money management in trading. Before trading, a trader must determine:
🪄Position size
🪄Stop loss size
🪄Take profit level
9. Cut losses quickly and let profits grow
According to this money management advice, you should close those trades that lead to losses according to your trading system on time and get the most out of winning trades.
Enjoy your trading journey!
I try to be useful to You🧡
Always sincerely with You😊
Your Rocket Bomb🚀💣
