Radio Yerevan: Is Crypto the Biggest Wealth Transfer in History?Answer: Yes. But not in the direction people hope.
In the last decade, crypto marketing has repeated one grand promise:
“This is the biggest wealth transfer in human history!”
And in classic Radio Yerevan fashion, this statement is both true and misleading.
Yes — a historic wealth transfer took place.
No — it did not empower the average investor.
Instead, it efficiently moved wealth from retail… back to the very entities retail thought it was escaping from.
Let’s break it down: structured, clear, and with just the right amount of irony.
1. The Myth: A Decentralized Financial Uprising
The early crypto narrative was simple and beautiful:
- The people would reclaim financial independence.
- The system would decentralize power.
- Wealth would flow from institutions to individuals.
The idea was inspiring — almost revolutionary.
Reality check: Revolutions are expensive.
And someone has to pay the bill.
In crypto’s case, the average investor volunteered enthusiastically.
2. The Mechanism: How the Transfer Actually Happened
To call crypto a wealth transfer is not an exaggeration.
The numbers speak loudly:
Total market cap peaked above $3+ trillion.
Most of the profit was extracted by:
- VCs who bought early,
- teams with massive token allocations,
- exchanges capturing fees on every trade,
- and whales who mastered liquidity cycles.
Retail investors, meanwhile, contributed:
- capital,
- liquidity,
- hope,
- hype
- and a remarkable tolerance for drawdowns.
It was, in essence, the perfect economic loop:
money flowed from millions → to a concentrated few → exactly like in traditional finance, only faster and with better memes.
3. The Irony: A Centralized Outcome From a Decentralized Dream
Here lies the great contradiction:
Crypto promised decentralization. Tokenomics delivered centralization.
When 5 wallets hold 60% of a token’s supply, you don’t need conspiracy theories — you need a calculator.
The “revolution” looked more like:
- Decentralized marketing
- Centralized ownership
- Retail-funded exits
- And a financial system where “freedom” was defined by unlock schedules and vesting cliffs
But packaged correctly, even a dump can look like innovation.
4. Why Retail Was Doomed From the Start
Not because people are unintelligent, but because:
- No one reads tokenomics.
- Unlock calendars sound boring.
- Supply distribution charts kill the romance.
- Liquidity mechanics are not as exciting as „next 100x gem”.
- And hype travels faster than math.
In a speculative market, psychology beats fundamentals until the moment fundamentals matter again — usually when it's too late.
5. The Real Wealth Transfer: From “Us” to “Them”
The slogan said:
“Crypto will redistribute wealth to the people!”
The chart said:
“Thank you for your liquidity, dear people.”
The actual transfer looked like this:
- Retail bought the story.
- Institutions created the tokens.
- Retail bought the bags.
- Institutions sold the bags.
- Retail called it a correction.
- Institutions called it a cycle.
Everyone had a term for it.
Only one group had consistent profits from it.
6. So, Was It the Biggest Wealth Transfer in History?
Yes.
But not because it made the average investor rich.
It was the biggest because:
- no previous financial system mobilized so many people
- so quickly
- with so little due diligence
- to transfer so much capital
- to so few beneficiaries
- under the banner of liberation.
It wasn’t a scam.
It wasn’t a conspiracy.
It was simply financial physics meeting human psychology.
7. The Lesson: Crypto Isn’t the Problem — Expectations Are
- Blockchain remains a brilliant invention.
- Tokenization has real use cases.
- DeFi is a groundbreaking paradigm.
- And so on
The issue wasn’t the technology.
It was the narrative that convinced people that buying a token was equivalent to buying financial freedom.
Real freedom comes from:
- understanding liquidity,
- reading tokenomics,
- respecting supply dynamics,
- and asking the only question that matters:
“If I’m buying… who is selling?”
In markets — especially crypto — this question is worth more than any airdrop.
8. Final Radio Yerevan Clarification
Question: Will the next crypto cycle finally deliver the wealth transfer to the masses?
Answer: In principle, yes.
In practice… only if the masses stop donating liquidity.
Educationalposts

How to choose what to invest inHow to choose what to invest in: a practical checklist for traders and investors
Many beginners start with the question “What should I buy today?” and skip a more important one: “What role does this money play in my life in the next years?”
That is how portfolios turn into random collections of trades and screenshots.
This text gives you a compact filter for picking assets. Not a magic list of tickers, just a way to check whether a coin, stock or ETF really fits your time horizon, risk and skill level.
Start from your life, not from the chart
Asset selection starts before you open a chart. First, you need to see how this money fits into your real life.
Three simple points help:
When you might need this money: in a month, in a year, in five years.
How painful a 10, 30 or 50 % drawdown feels for you.
How many hours per week you truly give to the market.
Example. Money is needed in six months for a mortgage down payment. A 15 % drawdown already feels terrible. Screen time is 2 hours per week. In this case, aggressive altcoins or heavy leverage look more like a stress machine than an investment tool.
Another case. Ten-year horizon, regular contributions, stable income from a job, 30 % drawdown feels acceptable. This profile can hold more volatile assets, still with clear limits on risk.
Filter 1: you must understand the asset
First filter is simple and strict: you should be able to explain the asset to a non-trader in two sentences.
The label is less important: stock, ETF, coin or future. One thing matters: you understand where the return comes from. Growth of company profit. Coupon on a bond. Risk premium on a volatile market. Fees and staking rewards in a network.
If your explanation sounds like “price goes up, everyone buys”, this is closer to magic than to a plan. Better to drop this asset from the list and move on to something more clear.
Filter 2: risk and volatility
The market does not care about your comfort. You can care about it by choosing assets that match your stress level.
Key checks:
Average daily range relative to price. For many crypto names, a 5–10 % daily range is normal. Large caps in stock markets often move less.
Historical drawdowns during market crashes.
Sensitivity to events: earnings, regulator news, large players.
The sharper the asset, the smaller its weight in the portfolio and the more careful the position size. The same asset can be fine for an aggressive profile and a disaster for a conservative one.
Filter 3: liquidity
Liquidity stays invisible until you try to exit.
Look at three things:
Daily traded volume. For active trading, it is safer to work with assets where daily volume is many times larger than your typical position.
Spread. Wide spread eats money on both entry and exit.
Order book depth. A thin book turns a big order into a mini crash.
Filter 4: basic numbers and story
Even if you are chart-first, raw numbers still help to avoid extremes.
For stocks and ETFs, it helps to check:
Sector and business model. The company earns money on something clear, not only on a buzzword in slides.
Debt and margins. Over-leveraged businesses with thin margins suffer in stress periods.
Dividends or buybacks, if your style relies on cash coming back to shareholders.
For crypto and tokens:
Role of the token. Pure “casino chip” tokens rarely live long.
Emission and unlocks. Large unlocks often push price down.
Real network use: transactions, fees, projects building on top.
Build your personal checklist
At some point it makes sense to turn filters into a short checklist you run through before each position.
Example:
Time. I know the horizon for this asset and how it fits my overall money plan.
Risk. Risk per position is no more than X % of my capital, portfolio drawdown stays inside a level I can live with.
Understanding. I know where the return comes from and what can break the scenario.
Liquidity. Volume and spread allow me to enter and exit without huge slippage.
Exit plan. I have a level where the scenario is invalid and levels where I lock in profit, partly or fully.
Connect it with the chart
On TradingView you have both charts and basic info in one place, which makes this checklist easier to apply.
A typical flow:
Use a screener to find assets that match your profile by country, sector, market cap, volatility.
Open a higher-timeframe chart and see how the asset behaved in past crashes.
Check liquidity by volume and spread.
Only then search for an entry setup according to your system: trend, level, pullback, breakout and so on.
Before clicking the button, run through your checklist again.
Common traps when choosing assets
A few classic traps that ruin even a good money management system:
Blindly following a tip from a chat without knowing what the asset is and why you are in it.
All-in on one sector or one coin.
Heavy leverage on short horizons with low experience.
Averaging down without a written plan and clear risk limits.
Ignoring currency risk and taxes.
This text is for educational purposes only and is not investment advice. You are responsible for your own money decisions.

Reading market regime: trend, range or chaos on a single chartReading market regime: trend, range or chaos on a single chart
Many traders treat every chart the same. Same setup, same stop, same expectations. Then one week the pattern works, the next week it bleeds the account.
In practice, the pattern rarely is the real problem. The problem is that the same pattern behaves differently in different market regimes.
First read the regime. Then trust the pattern.
This article focuses on a simple way to classify any chart into three regimes and adjust entries, stops and targets to match the environment.
What “market regime” really means
Forget academic definitions. For a discretionary trader, market regime is simply how price usually behaves on this chart in the recent swings.
A practical split into three buckets:
Trend: price prints higher highs and higher lows, or lower highs and lower lows. Pullbacks respect moving averages or previous structure. Breakouts tend to continue.
Range: price bounces between clear support and resistance. False breaks are frequent. Mean reversion works better than breakouts.
Chaos: candles with long wicks, overlapping bodies, fake breaks in both directions, no clear structure. Liquidity is patchy, stop hunts are common.
The goal is not perfect classification. The goal is to avoid trading a “trend playbook” in a chaotic zone and a “range playbook” in a strong trend.
Three quick checks for any chart
Before opening a trade, run three very simple checks on the last 50–100 candles.
1. Direction of swings
Mark the last 3–5 swing highs and lows with your eyes.
If highs and lows step clearly in one direction, you have a trend.
If highs and lows repeat in the same zones, you have a range.
If swings are messy and overlap, you are closer to chaos.
2. How price reacts to levels
Pick obvious zones that price touched several times.
Clean tests with clear rejection and follow through support the range idea.
Small pauses and then continuation support the trend idea.
Spikes through levels with no follow through point to chaos.
3. Noise inside candles
Look at wicks and bodies.
Moderate wicks and healthy bodies often belong to a stable trend.
Many doji-like candles and long wicks on both sides are classic noisy conditions.
After these three checks, label the chart in your journal: trend, range or chaos. Do not overthink it. One clear label is enough for each trade.
How to adapt the trade to the regime
Same signal, different execution.
Trend regime
Direction: trade only with the main direction of recent swings.
Entry: focus on pullbacks into previous structure or into dynamic zones like moving averages, not on chasing the breakout spike.
Stop: behind the last swing or behind the structure that invalidates the trend.
Target: allow more distance, at least 2R and more while the trend structure holds.
Range regime
Direction: buy near support, sell near resistance. Ignore mid-range.
Entry: wait for rejection from the edge of the range. Wick rejection or failed breakout is often better than a blind limit order.
Stop: behind the range boundary, where the range idea clearly dies.
Target: either the opposite side of the range or a “safe middle” if volatility is low.
Chaos regime
Size: cut risk per trade or stay flat.
Timeframe: either move to higher timeframe to filter noise or skip the instrument.
Goal: defense, not growth. The main job here is to avoid feeding the spread and slippage.
Use a journal to find your best regime
Add one extra column to your trading journal: “regime”. For each trade, assign one of three labels before entry.
After 30–50 trades, group the results by regime. Many traders discover that:
Trends give the main profit.
Ranges give small but stable gains.
Chaos slowly eats everything.
Once this pattern becomes visible in numbers, discipline around regimes stops being an abstract rule. It turns into a very practical filter.
Conclusion
A setup without a regime filter is half a system.
Start every analysis with a simple question to the chart: trend, range or chaos. Then apply the playbook that fits this environment, instead of forcing the same behaviour from the market every day.

#EDU/USDT Forming Bullish Momentum#EDU
The price is moving in a descending channel on the 1-hour timeframe. It has reached the lower boundary and is heading towards breaking above it, with a retest of the upper boundary expected.
We have a downtrend on the RSI indicator, which has reached near the lower boundary, and an upward rebound is expected.
There is a key support zone in green at 0.1580. The price has bounced from this level multiple times and is expected to bounce again.
We have a trend towards consolidation above the 100-period moving average, as we are moving close to it, which supports the upward movement.
Entry price: 0.1615
First target: 0.1657
Second target: 0.1710
Third target: 0.1785
Don't forget a simple principle: money management.
Place your stop-loss order below the support zone in green.
For any questions, please leave a comment.
Thank you.

ETH/USDT (4H Timeframe)The chart shows Ethereum’s price action on the 4-hour timeframe with key supply–demand zones, structure levels, and an active long setup.
1. Market Structure
ETH has been in a downtrend, forming lower highs and lower lows, but recently it created a short-term bullish reversal from the demand zone near $2,880–$2,950.
Price broke a small internal structure high (marked “XX-Liquidity”), indicating potential short-term bullish strength.
2. Key Zones
Major Supply Zone (Upper Blue Box):
Around $3,360–$3,414 — a strong resistance area where price previously dropped heavily.
Major Demand Zone (Lower Blue Box):
Around $2,888–$2,949 — where price had a strong bullish reaction.
3. Order Block (OB+)
A bullish order block is marked just below the current price (~$3,000).
Price is pulling back into this OB, suggesting possible bullish continuation if it holds.
4. Current Position Setup
There is a highlighted long trade zone from the OB, targeting the $3,257–$3,257+ region.
Entry appears near $3,000, SL below the OB, and TP at the previous major structure high.
5. Price Reaction
ETH is hovering around $3,003, testing the order block for liquidity.
If OB holds, price may push toward the target zone. If broken, price may revisit the demand zone at $2,880–$2,940.

Master the Market with This Secret StrategyHey traders! If you’ve ever watched XAUUSD suddenly explode up or crash down and wondered “What just happened?” — this is the answer. And that’s exactly why today’s topic matters.
To truly master gold, you need to understand one thing better than most traders do: how interest rates and the FED shape every major move on this chart.
When I first started trading, I relied heavily on patterns, indicators, and momentum signals. But the longer I traded, the more obvious it became: gold doesn’t make its biggest moves because of a pattern — it moves because the flow of money shifts. And nothing shifts money faster than the FED.
Interest rates are basically the “price of the dollar,” and gold reacts to that instantly:
High rates → strong USD → gold usually drops.
Lower rates or a dovish tone → weaker USD → gold rallies hard.
But here’s the part most traders never realize:
The FED doesn’t need to change rates to move gold.
Sometimes a single hawkish or dovish sentence is enough to push XAUUSD $20–$30 in minutes. That’s why understanding the tone of the FED — not just the numbers — is your real edge.
And this leads to the strategy I’ve used consistently with XAUUSD:
If the market expected hawkish but hears dovish → gold pumps.
If the market expected dovish but gets hawkish → gold drops fast.
That “expectation gap” is what gives us the clean moves we love trading.
On TradingView, I keep it simple:
I never enter on the first spike — that move is almost always engineered to grab liquidity. Instead, I wait 15–30 minutes for the real structure to form, watch for a break and retest, and then I follow the true direction. This approach has saved me from countless traps during FED weeks.
So when you’re analyzing XAUUSD, don’t just stare at the candles.
Look at the interest rate environment.
Listen to the FED’s tone.
Measure what the market expected versus what actually happened.
Master that connection — and suddenly the gold chart feels less chaotic and a lot more predictable.

CRYPTOCHECK Throwback - BEST POSTS 2025New Year loading 🥳🥂
Setting up your trading technique and sticking to it
The Dunning Kruger Effect
How to trade Bollinger Bands
How to Dollar-Cost-Average
Spotting reliable Bottom Patterns
These ideas may help you improve your strategy and become a more profitable trader. Happy Trading!

Crypto "Investors" Forget Too Quickly- Part OneI’ve never been much of a gambler.
I don’t chase roulette, I don’t play blackjack regularly, and casinos have never been my second home. But on the rare occasions when I did go—usually dragged by friends who actually like gambling—something strange happened to me.
I ended up losing considerable amounts of money.
- Not because I thought I’d win.
- Not because I had a “system.”
- Not because I felt lucky.
It was the environment:
- the lights
- the noise
- the adrenaline
- the drinks
- the atmosphere that hijacks logic
And the next morning, the internal monologue was always the same:
“See, idiot? Again you drank one too many and managed to lose a Hawaii vacation.”
- The regret is real.
- The pain is real.
- The stupidity is, HOHO, WAY TOO REAL.
But the disturbing part?
Even though I don’t gamble… even though I don’t chase casinos… the environment alone was enough to override my reasoning.
And if that can happen to someone who isn’t a gambler, imagine what happens to someone who willingly walks into a casino every day —because that’s exactly what crypto "investors" do.
Crypto markets are casinos with better screens, countless memes, screaming influencers and worse odds.
And "investors" forget far too quickly.
Crypto "Investors" Forget Too Quickly —
Just Like Casino Gamblers Who Keep Coming Back for More
Crypto "investors" have one of the shortest memories in financial markets.
- Not because they are stupid.
- Not because they don’t care.
- But because the entire crypto environment is engineered to erase pain and preserve hope — exactly like a casino.
Put a gambler in a casino, and he forgets last night’s disaster the moment he sees the lights again.
This comparison is not metaphorical.
It is psychologically identical.
Let’s break it down properly.
1. The Human Brain Is Not Built for Crypto — or Casinos
Both environments share the same psychological architecture:
- bright colors
- fast feedback loops
- uncertainty
- intermittent rewards
- emotional highs
- catastrophic lows
- near-wins that feel like wins
- an illusion of control
Neuroscience calls this:
Intermittent Reinforcement
The most addictive reward structure ever discovered.
Slot machines are built on it.
Most crypto charts mimic it.
Volatility fuels it.
When rewards arrive unpredictably:
- dopamine spikes
- memory of losses fades
- the brain overvalues the next opportunity
- the pain of the past gets overwritten
- the hope of future reward dominates
This is why gamblers return.
And this is why crypto "investors" buy the same s..ts.
2. The Crypto Cycle Erases Memory by Design
After every bull run for an obscure coin:
- big money is made (by insiders)
- screenshots are posted
- what if you have bought with 100usd appear
- influencers multiply
- everyone becomes a “trading wizard”
- Twitter becomes an ego playground
- greed replaces rationality
After every strong bear move:
- portfolios crash 90-95%
- people swear “never again”
- Telegram groups die
- influencers delete posts
- conviction collapses
- despair dominates
But then…
When a new "narrative" appears:
- Everything resets.
- Crypto "investors" forget instantly.
No other financial market resets memory this fast.
- In stocks, a crash leaves scars.
- In forex, blown accounts create caution.
- In real estate, downturns shape behavior for years.
But in crypto?
The new "narative"/ the new hyped coin erases the old one like chalk on a board.
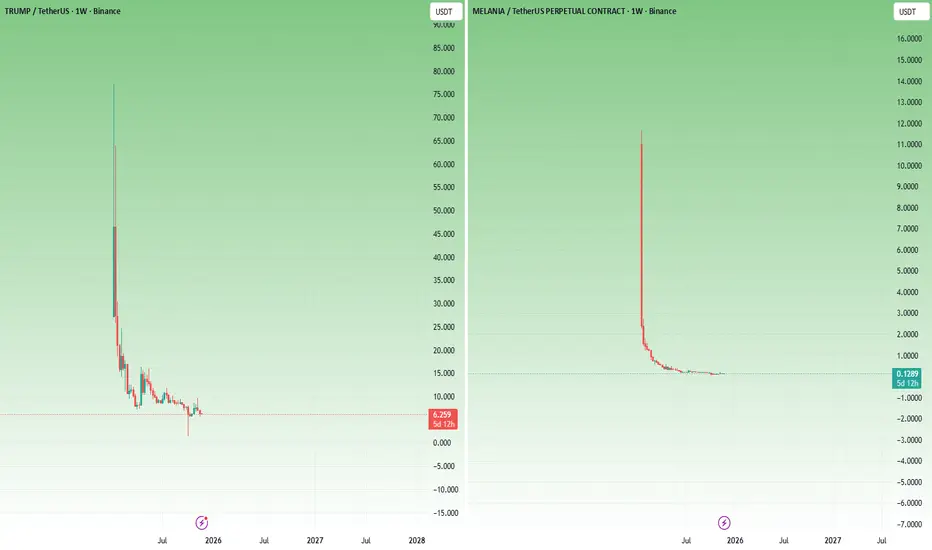
3. The TrumpCoin & MelaniaCoin Episode (Just an Example):
The Best Proof That Crypto Traders Forget Too Quickly
TrumpCoin and MelaniaCoin didn’t have real value.
They weren’t serious projects.
They weren’t even clever memes.
They were psychological traps built on celebrity gravity.
People bought because:
- the names were big
- the media amplified the narrative
- the symbolism felt powerful
- the story was exciting
And the wipeout was brutal.
But the key point is: traders forgot instantly.
Within weeks, they were already hunting for:
- “the next TrumpCoin”
- “the next politician meme”
- “the next celebrity pump”
- “the next token with a ‘name’ behind it”
- "the next 100x"
"the next, the next, the next" and is always the same
- Not the next valuable project.
- Not the next real innovation.
- Not the next sustainable investment.
No.
The next symbol.
This is not market behavior.
This is casino relapse psychology.
4. These Coins Didn’t Fail Because They Were Memes —They Failed Because They Were Nothing
TrumpCoin & MelaniaCoin ( Again, is just an example) pretended to matter because the names mattered.
- Traders didn’t buy utility.
- They bought a fantasy.
The same way gamblers believe a “lucky table” changes their odds.
In crypto, people believe:
- the celebrity matters
- the narrative matters
- the hype matters
Reality doesn’t.
5. Why Crypto "Investors" Don’t Learn: Because They Don’t Remember
Crypto "investors" are not stupid.
They are forgetful.
They forget the months of pain and remember only the few happy moments.
They forget:
- drawdowns
- stress
- panic
- illusions
- scams
- broken promises
- influencers lies
They remember:
- one good run
- one moonshot
- one dream
This is why most altcoins and memes thrive.
Not because they deserve to.
But because forgetting resets demand every time.
6. The Industry Is Designed to Exploit This Amnesia
If traders remembered:
- Luna
- FTX
- SafeMoon
- ICO (2017) crashes
- NFT (2021) collapses
- Meme mania recently
…the most of the altcoin sector would evaporate overnight.
But "investors" forget —so altcoins with a "nice" story resurrect.
Like slot machines resetting after every gambler walks away.
7. The Cure: You Don’t Need Better Tools — You Need a Better Memory
The greatest edge in crypto is not fancy indicators, bots to be the first in, or whatever invention comes next.
It’s remembering.
Remember:
- why you lost
- how you lost
- which narrative fooled you
- how the market humiliated you
- what the casino environment does to your brain
- how celebrity tokens wiped people out
Crypto trading requires memory, not optimism.
Conclusion:
Crypto "Investors" Forget Too Quickly —And That’s Why They Keep Losing
Crypto "investors" don’t think like REAL investors.
They think like gamblers:
- emotional
- hopeful
- impulsive
- forgetful
convinced “this time will be different”
The latest meme mania proved this perfectly.
Crypto is not dangerous because it is volatile.
Crypto is dangerous because it erases your memory.
The "investor" who forgets loses.
The "investor" who remembers wins.
Because in crypto:
The moment you stop forgetting is the moment you finally start winning.
P.S. (A Necessary Clarification, Said Gently — and Honestly)
Throughout this article I used the word “investors” in quotation marks — and it wasn’t an accident.
Most of the people who call themselves investors in crypto are not actually investing.
They are speculating, chasing, hoping, and gambling on meme coins and obscure altcoins purely because “they have 100x potential.”
Let’s be honest:
- buying a token named after a frog
- or a coin launched yesterday by anonymous developers
- or a “next big narrative” pump with zero product
- or a celebrity meme coin
- or something that exists only on Twitter…is not investing.
It’s gambling dressed in nice vocabulary.
And that’s okay — as long as you know what it is.
Also, to be clear:
When I critique “altcoins,” I am not talking about all of them.
There are real infrastructure projects, real protocols, real technology, and real builders out there.
But let’s not pretend:
90% of altcoins exist for hype, for extraction, for speculation, and for the dopamine of “maybe this one will moon.”
I’m talking about those coins — the ones that behave like slot machines and survive only because traders forget too quickly.
If this article made you uncomfortable, good.
Sometimes the truth has to sting before it can help.
Anticipate Movement Inside of a Range EnvironmentA large portion of crypto price action does not trend. It ranges. And for many traders, this is where the most capital is lost. A range environment feels simple on the surface price moves between two boundaries, but inside those boundaries, liquidity builds, traps form, and false signals appear constantly. Understanding how ranges behave is a core skill for developing consistency.
A range forms when the market fails to create meaningful higher highs or lower lows. Buyers and sellers balance out, and price oscillates between defined support and resistance. This compression is not random. It reflects indecision, accumulation, or distribution depending on the higher-time frame context. Traders who treat a range like a trend are the ones most often punished.
The first step is identifying the boundaries. Equal highs at the top of a range and equal lows at the bottom reveal where stops accumulate. These stops become liquidity pools. Price frequently sweeps one side of the range before moving to the other, trapping breakouts and fading momentum traders. A clean sweep is not the breakout; it is the intention-revealing event before direction is chosen.
Inside the range, structural signals lose reliability. Traditional trend tools cannot be applied. Instead, focus on behaviour at the edges: rejection wicks, failed breakouts, displacement after a sweep, and reclaim patterns. These reactions show whether a sweep is simply clearing liquidity or if a genuine expansion is developing.
Patience is critical. Entering in the middle of the range exposes you to noise, uncertainty, and poor reward-to-risk. The edge comes from waiting at the boundaries where liquidity sits and confirmation appears. A range can persist far longer than expected, so forcing trades inside it leads to frustration and unnecessary losses.
The real purpose of studying ranges is not just to trade them but to anticipate what follows. A compression phase often precedes expansion. When liquidity on one side is taken and price breaks structure with intent, the next directional leg becomes far easier to participate in. Ranges are where future trends prepare themselves.

Candlestick Patterns That Actually MatterTraders often approach candlestick patterns by memorizing long lists instead of understanding the behaviour behind them. Crypto moves aggressively, hunts liquidity, and punishes textbook interpretations unless they occur at meaningful locations. The goal is not pattern collection. The goal is to recognize the few formations that consistently reveal intention when aligned with structure, liquidity, and context.
Engulfing Candles, Displacement and Control
What it shows: a clear shift where one side fully absorbs the other. This is participation, not random volatility.
When it matters: after impulses, at support or resistance, during liquidity sweeps, or when confirming a trend shift.
Why it’s valuable: engulfing candles often provide the first structural evidence that control has changed hands.
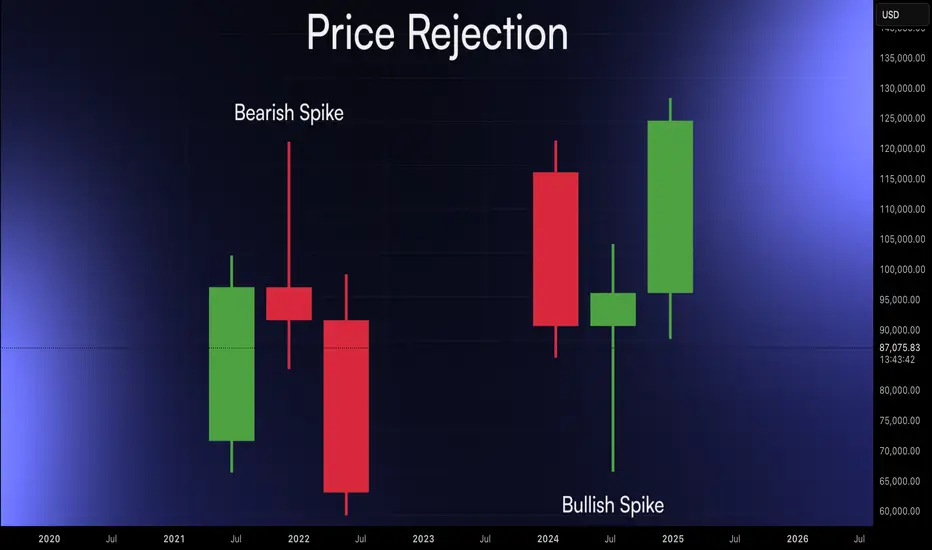
Rejection Wicks, Liquidity Taken, Pressure Reverses
What it shows: price tapped a high or low, triggered stops, and immediately met stronger opposing orders. This is how sweeps appear on a single candle.
When it matters: at equal highs/lows, session extremes, failed breakouts, and major swing points.
Why it’s valuable: wicks expose trapped traders and reveal where true supply or demand sits. They are early indicators of shifting intent.
Inside and Outside Bars, Compression and Expansion
Inside Bar: compression, tighter ranges, and reduced volatility ahead of expansion.
Outside Bar: immediate expansion where one side overwhelms both directions.
When they matter: at key levels before breakouts, during corrective legs, at consolidation boundaries, and after liquidity events.
Why they’re valuable: inside bars show preparation; outside bars show decision.
Treat these signals as behavioural information. Their value increases when combined with higher timeframe structure, liquidity mapping, momentum, volume, and session context.
SPX - Hours Of Work To Buy 1 ShareHours of work needed to buy just one share of the S&P 500 just hit a new all-time high: 187 hours.
That’s:
150% more work than 2007
60% more than pre-COVID (2019)
10% more than “Liberation Day”
As I tell my kids:
Don’t look at the price tag.
Look at how many hours of your life — your blood, sweat, and effort — it takes to buy the thing.
Then decide if it’s actually worth it.
When the amount of work required keeps rising while what you get keeps shrinking, that’s not “innovation” or “AI magic.”
That’s over-speculation.
Buffett said it best:
Price is what you pay. VALUE is what you get.
Everyone screams about the price going up…
but nobody asks whether the VALUE justifies the hours of work required to own it.
That’s the truth — not the narratives.
THANK YOU for getting me to 5,000 followers! 🙏🔥
Let’s keep climbing.
If you enjoy the work:
👉 Boost
👉 Follow
👉 Drop a solid comment
Let’s push it to 6,000 and keep building a community grounded in truth, not hype.

Continuing Triangle PatternHello friends
we are here with a simple strategy tutorial that is a model, but it also requires practice.
Well, whenever we have a structure, whether it is bullish or bearish, it doesn't matter. Now in this example, our structure is bearish and you can see how sharp the spikes that the sellers make are and at one point the price compresses and forms a triangle. Here, considering the bearish structure we have and the strength of the sellers that you see, we expect a decline if the triangle breaks.
Which is the continuation of our downward trend or structure, which we call a continuation triangle, meaning the price continues its previous structure.
The way to trade it is also simple. Just wait for a strong break of the triangle, and when the break is valid and the bottom of the triangle closes, we can enter with a stop loss above the ceiling and a target equal to the previous drop of the triangle, which is the trend move.
Be sure to follow risk and capital management.
*Trade safely with us*
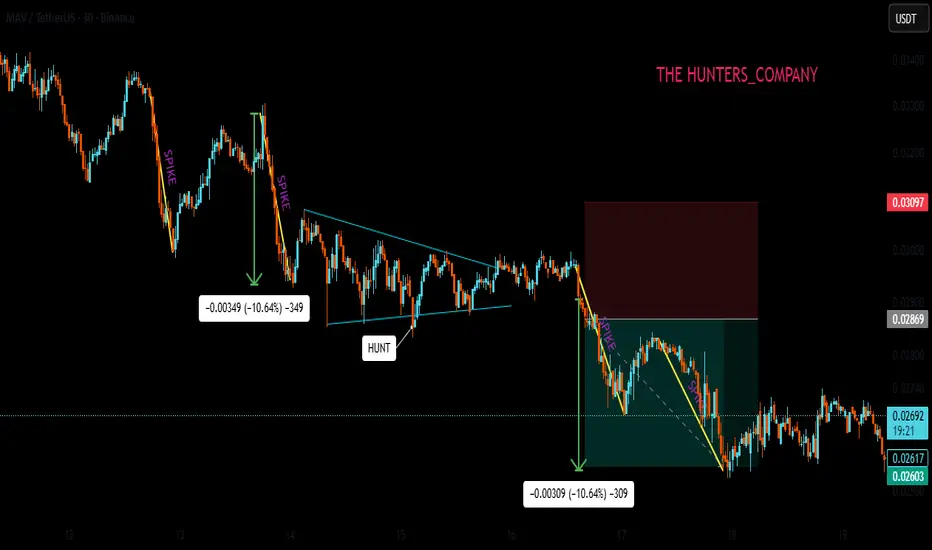
Haunt training levelsHello friends
We are back with another tutorial.
This time we are going to tell you a more advanced strategy.
Well, when a trend or structure forms, it doesn't matter whether it's bullish or bearish. In our example, it's an bullish structure. You should be careful that every structure eventually ends, and this ending has a series of signs. In this strategy, we'll teach you what those signs are and how to enter a trade and make a profit.
Well, as you can see, the buyers raised the price, and considering the higher ceilings and floors, we can tell that our structure is bullish and the buyers' hand is strong...
Here we are waiting for buyers to weaken, which is the important moment when, after hitting a ceiling, sellers push the price down, and you think that the structure has changed and enter a sell trade, placing your stop loss above the spike and waiting for the structure to change.
This is where the buyers come in and make their final move, hunting the previous high and your stop loss is triggered.
What to do now?
So, as we said, when you see the weakness of the structure, draw a resistance level like the level we have specified for you.
Now the price is falling from the ceiling and we are just waiting and when the price reaches the level again and cannot stabilize above our level and does not have the strength, so to speak, our level is hunted and the price falls, we do not expect to be able to enter the trade right there Because we need more confirmations.
So the price comes back and reaches our level, which we call a pullback. At this point, we must be very careful that the price weakens before our level or weakens at the level and cannot stabilize higher prices. This is where we enter the trade and our stop loss is placed exactly behind the hunted ceiling.
The target can also be the first price bottom and then, if the sellers are strong, lower bottoms...
Be careful that the win rate of this strategy is 70.
Be sure to observe risk and capital management.
*Trade safely with us*

Structure trainingHello friends
Well, you see that a spike has been made by the sellers and a bearish structure has formed.
So, be careful that after each spike, the price needs to take a break, so it either suffers or pullbacks, spikes again, and continues.
Now the question is, how do we know when our downtrend is over?
You need to be careful and wait for the weakness of sellers and the strength of buyers, the important signs of which I will tell you.
The first sign is the last spike, which requires our bottom to be broken by sharp sellers and the price to be reversed by sharp buyers. Here it is important that we set a higher ceiling and break this spike formed by sellers, which is also called CHOCH in a correction, which means the same change in structure.
Our second sign is the lower lows, which is also very important and of great importance because it shows the advantage of buyers and helps a lot.
And in the price pullback we can enter the trade with risk and capital management.
Our stop loss is placed below the last low or the last spike that you said and the target is double that R/R=2
*The win rate of this strategy is also 60*
*Trade safely with us*

Elliott Wave Analysis and Key Levels for the Next MoveThis analysis shows how to apply Elliott Wave Theory together with fundamental and volume research. The content is professional, but it is also educational for anyone learning wave counting and market structure. I cover the full correction, the start of the impulse phase and the main levels that guide the scenario.

The Formula to Make $10000 Daily👋 Hello traders!
If you’re looking for a real way to make $10000 every day from the markets, forget about the so-called magic strategies or secret expert tricks.
The truth is simple: there’s no overnight success formula. But there is a realistic path built on probability, discipline, and time — and that’s what I call The Formula to Make $10000 Daily .
⚙️ Step 1: Build a High-Probability Trading System
📊 This is your foundation.
A good trading system doesn’t have to be complex, but it must have clear rules and consistent logic .
You should always know:
✅ When to enter a trade
✅ When to stay out
✅ And most importantly — why you’re entering
Choose a strategy you can truly master and apply consistently — such as Break & Retest , Supply & Demand , or Market Structure Shift .
Every trade should have a Risk-to-Reward ratio (R:R) of at least 1:2 or higher.
💡 Example:
If you risk $2000 per trade and win just two out of three trades daily, you’ll make $4000.
Increase your lot size gradually and stay consistent — $10000 a day becomes a realistic outcome.
💼 Step 2: Capital Management – The Key to Survival
🧠 You can’t make $10000 daily if you lose $10000 in one bad trade.
Capital management isn’t just about protecting your balance — it’s about protecting your mindset and system.
Follow these golden rules:
💰 Risk only 1–2% per trade
🛑 Always use a stop loss
🎯 Set a clear take-profit target
With a $50,000 account, risking 1% equals $5000.
If your R:R ratio is 1:3, one winning trade a day earns $15000.
That’s not luck — that’s mathematics working in your favor .
🧘♂️ Step 3: Master the Trader’s Mindset
Once you have a solid system and money management plan, the final piece — and the most important — is your psychology .
Most traders don’t fail because their system is bad. They fail because they can’t control themselves .
Keep these principles close:
🚫 Don’t trade when emotions take control
🚫 Don’t revenge trade after losses
🚫 Don’t increase lot size out of greed
🚫 Don’t force yourself to take trades every day
A professional trader doesn’t aim to win every trade — they aim to lose less and lose smart .
🧩 The Real Formula
💎 (High-Probability System + Strict Risk Management + Strong Psychology) × Time = Sustainable Profit
There are no shortcuts.
No magic indicators.
Only you and your discipline .
📖 Real Story
One of my students, Ken, started with a $10,000 account.
He didn’t try to go big — instead, he aimed to earn 1% a day , or $1000.
After six months, by slowly increasing his trade size and staying disciplined, his average daily profit reached $10000 .
He told me:
“I didn’t need to change my system. I just needed to change myself.”
🎯 Final Thoughts
The formula to make $10000 daily doesn’t come from any special indicator, signal, or secret course.
It comes from understanding your system deeply, managing your capital wisely, and staying disciplined every single day .
💬 The market doesn’t reward the fastest traders. It rewards the most patient, consistent, and focused ones.
If you’re on your journey to becoming a professional trader, start today.
🔥 Build your own formula — and practice it every single day until it becomes second nature.

Choosing Your Path in Futures TradingThere’s more than one way to participate in the futures markets. Whether you're hands-on or prefer a more passive approach, selecting the right method depends on your trading goals, risk tolerance, and available time. Here’s a breakdown of the most common approaches used by active and aspiring futures traders.
1. Self-Directed Trading
If you like full control over your trades, this approach is for you. It requires staying up to date on market news, analyzing charts, and executing your own trades according to a plan and framework which can be referred to as your “strategy.” Experienced traders may prefer this model for its flexibility and transparency.
Past performance is not indicative of future results.
2. Automated Trading Systems
These systems use predefined rules to analyze data and execute trades without manual intervention. They can be ideal for traders who want to capitalize on algorithmic speed and logic while minimizing emotional decision-making, or for traders who might not have the time to dedicate to self-directed trading.
EdgeClear offers connectivity to a handful of automated programs, if you are interested in learning more please contact us.
3. Managed Futures
For a more passive route, managed futures allow you to invest in futures contracts through a Commodity Trading Advisor (CTA) or Commodity Pool Operator (CPO). The advisor handles the trading, using their expertise to manage risk and seek opportunity.
4. Broker-Assisted Trading
Prefer to have a trusted guide by your side? With broker-assisted trading, a professional helps execute trades, manage risk, and offer support—all tailored to your preferences.
Key Takeaway
Every trader’s journey in the futures markets looks different. Whether you thrive on taking full control of your trades, prefer automated systems, or rely on professional guidance, the key is to find the approach that aligns with your goals, risk tolerance, and lifestyle.
Understanding the options available self-directed, automated, managed, or broker-assisted empowers you to trade more confidently and effectively.
Call to Action
At EdgeClear, we’re dedicated to helping traders at every level find the tools, guidance, and support they need to succeed. Explore our platforms, connect with our expert brokers, or follow us on TradingView to discover more Trade Ideas and educational content to refine your edge.
Release the Pressure: Why Relaxed Traders Win MoreOne of the most overlooked psychological factors in trading is pressure — the silent force that makes you enter trades too early, exit too late, and misread what’s actually happening on the chart.
The truth is simple:
When you relax, you trade better.
The Illusion of “Always Doing Something”
Many traders feel that if they’re not in a trade, they’re missing out.
The market becomes a constant test of patience — and silence between trades feels unbearable.
That’s when poor decisions appear: forced entries, revenge trades, and overtrading to “feel productive.”
But the market doesn’t reward effort; it rewards timing.
Trading well often looks like doing nothing most of the time.
You wait, you observe, and you strike when the setup aligns.
This is where the relaxed mindset beats the pressured mindset every single time.
Example: Gold (XAUUSD) Between 3960 and 4030
Let’s take gold as an example.
As explained in my recent analysis, we have two clear levels to watch — 3960 and 4030.
Price is currently trading in between.
Even though it may look like it’s pressing upward and could form an ascending triangle, clarity only comes with a real breakout, not with anticipation.
A pressured trader will often feel the urge to predict — to “get in early” before confirmation.
But the calm trader simply waits.
They know that between levels, price action is noise, not opportunity.
And when clarity comes — either through a clean breakout or a rejection — the decision is obvious and stress-free.
This is what “releasing the pressure” looks like in practice:
You don’t force a trade. You let the market reveal the next step.
Why Pressure Kills Performance
Pressure doesn’t just come from the charts — it comes from expectations.
The trader who needs to make x$ per day will subconsciously search for confirmation that a trade exists.
Charts suddenly look clearer than they actually are.
Bias replaces logic.
And objectivity, which is the foundation of good trading, fades away.
In reality, the more you need to make money from trading, the harder it becomes to do so.
That’s not because the market is cruel — it’s because the human brain under stress stops processing probabilities correctly.
The Paradox of Ease
Every trader eventually experiences this paradox:
The less you try to “make something happen,” the more naturally good trades appear.
This isn’t mystical — it’s psychological.
When the mind is calm, your ability to notice quality setups improves dramatically.
You stop trying to control the market and start aligning with it.
It’s the difference between chasing a wave and surfing one.
Creating Space to Breathe
The professional approach to trading is not about constant activity — it’s about creating the conditions where clarity thrives.
That means reducing pressure in three ways:
1. Detach from daily profit goals.
The market doesn’t care about your personal targets. Focus on setups, not outcomes.
2. Allow financial breathing room.
When your rent, bills, and daily life depend on your next trade, emotional clarity disappears.
Build a secondary income or savings buffer — not for luxury, but for mental freedom.
3 . Redefine success.
A good trading day is not one with profit — it’s one with discipline.
When you measure success by process, not by dollars, you take power back from the market.
Final Thought
Most traders lose not because they lack skill, but because they trade under pressure.
The weight of expectation distorts perception, and the market punishes impatience.
Release the pressure — mentally, financially, and emotionally.
When you do, trading starts to flow the way it was meant to:
Quietly, naturally, profitably.

The Monty Hall Paradox in TradingMost traders think the Monty Hall paradox has nothing to do with markets.
But every time you refuse to change your bias — it plays out right in your chart.
At the beginning of October, I started looking for signs of a drop in gold.
They came very late.
Instead, from October 1st, gold rallied more than 5000 pips before dropping.
I was aware of the Monty Hall paradox — and yet, I didn’t switch.
And this post is not about why I didn’t switch.
It’s about understanding the paradox itself, and how it quietly plays out in trading every single day.
Because yes — gold eventually dropped, and it dropped hard.
But before falling 5,000 pips, it first rose 5,000 pips — and before that rise even began, the market clearly opened a door just before breaking above 4,000 pips — a door I chose to ignore.
That’s exactly what this article is about: recognizing when the market opens new doors, and understanding why switching — just like in the Monty Hall paradox — often gives you the better odds.
🎭 The Original Paradox
The Monty Hall problem comes from an old game show called "Let’s Make a Deal ".
There are three doors: behind one is a car, and behind the others are goats.
You pick one door.
The host, who knows what’s behind them, opens another door — always showing a goat.
Then he asks:
“Do you want to stay with your first choice or switch?”
Most people stay
But mathematically, you should switch — because the probability of winning jumps from 1/3 to 2/3 after that reveal.
The host didn’t change the car’s position — he changed the information you have.
And that’s what makes all the difference.
If you’ve never heard of the original paradox, you might remember it from the film "21" with Kevin Spacey — the scene where he teaches probability through deception, using the Monty Hall setup to show how humans instinctively trust their first choice.
That’s exactly what markets do: they give you partial information, make you feel confident, and then quietly shift the odds while you’re still defending your initial pick.
📊 The Trading Version
In trading, there are no doors — only biases.
But the logic is identical.
When you open a trade, you’re making a probabilistic choice based on incomplete data.
You think it’s 50–50 — up or down — but it’s not.
You’re guessing direction, but also timing.
In reality, your initial bias might have a 1/3 chance of being fully correct.
Then the market — our version of Monty Hall — reveals new information:
a failed breakout, a strong reversal candle, a macro shift, a sudden volume surge.
That’s the door opening.
And now you face the same question:
“Do you stay with your first choice or switch?”
🧠 Why Most Traders Don’t Switch
Because switching feels like admitting you were wrong.
Ego and attachment to our analysis make us defend our initial position, even as evidence piles up against it.
But the market doesn’t reward stubbornness — it rewards adaptation.
Refusing to switch isn’t strength; it’s emotional inertia.
🔁 What “Switching” Really Means
It doesn’t always mean reversing your trade.
It can mean:
- Cutting your loss early instead of waiting for stop loss
- Closing a position that started “right” but begins behaving wrong.
- Flipping your bias when the structure proves you wrong.
- Or simply, pausing — accepting that the setup no longer fits the data.
In each case, you’re doing what the smart contestant in Monty Hall does:
You’re updating your probabilities as new information arrives.
💬 The Lesson
The paradox isn’t about doors — it’s about humility.
About understanding that the first choice you make in trading could end up not being the best one.
The best traders don’t need to be right.
They need to be flexible enough to become right later.
So the next time the market “opens a door” — don’t get defensive.
Recalculate. Reassess.
Sometimes, switching is the only way to stay in the game.
🚀 Closing Thought
The Monty Hall paradox isn’t about luck; it’s about using information wisely.
The same rule applies to trading:
If the market gives you new data, use it — even if it means admitting your first bias was wrong.
Because the moment you stop defending your first choice, you finally start trading with probability — not pride.
P.S.
Although I did manage to make some profit on short trades, that’s beside the point.
What truly matters is that the market clearly opened a door at the beginning of October — and even though I saw it, I ignored it.
Yes, the market eventually dropped as initially expected, but that too is beside the point.
This isn’t about being right in the end; it’s about recognizing when the market opens new doors and having the courage to walk through them.

TCS 60 MINS TIME FRAME MY VIEW The Structure looks good to us, waiting for this instrument to correct and then give us these opportunities as shown on this instrument (Price Chart).
Note: Its my view only and its for educational purpose only. Only who has got knowledge about this strategy, will understand what to be done on this setup. its purely based on my technical analysis only (strategies). we don't focus on the short term moves, we look for only for Bullish or Bearish Impulsive moves on the setups after a good price action is formed as per the strategy. we never get into corrective moves. because it will test our patience and also it will be a bullish or a bearish trap. and try trade the big moves.
We do not get into bullish or bearish traps. We anticipate and get into only big bullish or bearish moves (Impulsive Moves). Just ride the Bullish or Bearish Impulsive Move. Learn & Know the Complete Market Cycle.
Buy Low and Sell High Concept. Buy at Cheaper Price and Sell at Expensive Price.
Please keep your comments useful & respectful.
Keep it simple, keep it Unique.
Thanks for your support
Tradelikemee Academy
Saanjayy K G

Understanding the Foundation of Global MarketsFutures contracts are everywhere, from crude oil and stock indices to interest rates and even Bitcoin. They’re essential tools for traders and institutions to manage risk or capitalize on price speculation.
What Are Futures?
A futures contract is a legally binding agreement to buy or sell an asset at a set price on a future date. These contracts can involve commodities, currencies, or financial instruments.
Why Trade Futures?
Futures serve two core purposes
Hedging: Used by businesses to protect against adverse price moves. Example: A Corn farmer locks in $4.00 per bushel using a short futures position. If the price drops, they’re protected by gains in the contract. Conversely, if the price rises, the farmer should theoretically be able to sell the physical product at a higher amount.
Speculation: Speculators are a very important piece to market stability and liquidity. Many traders use futures to attempt to profit from market direction, in other words speculate on market moves. For instance, if a trader buys an E-mini S&P 500 contract at 6500 and it rises to 6550, they profit*. But losses can occur just as quickly if the market moves against the position.
*Always account for fees and commissions when evaluating performance."
Types of Futures Contracts
Commodity Futures — Crude oil, soybeans, gold.
Financial Futures — S&P 500, interest rates, Treasury bonds.
Currency Futures — Euro, Yen, and other FX contracts.
Cryptocurrency Products — Bitcoin, Etherum, Solana.
Key Takeaway
Whether you’re hedging or speculating, futures are dynamic and powerful tools. But they also carry significant risk. The first step is understanding what you're trading and why.
At EdgeClear, we’re here to help you trade with confidence. If you’re new or want to enhance your strategy, follow us on TradingView to learn more about Futures and read our latest Trade Ideas.
CME_MINI:ES1! CME_MINI:NQ1! COMEX:GC1! NYMEX:CL1! CME:BTC1!

TRADING LEVERAGE | How to Manage RISK vs REWARDFor today's post, we're diving into the concept " Risk-Reward Ratio "
We'll take a look at practical examples and including other relevant scenarios of managing your risk. What is considered a good risk to reward ratio and where can you see it ? This applies to all markets, and during these volatile times it is an excellent idea to take a good look at your strategy and refine your risk management.
You've all noticed the really helpful tool " long setup " or " short setup " on the left-hand column. This clearly identifies the area of profit (in green), the area for a stop-loss (in red) and your entry (the borderline). It also shows the percentage of your increases or decreases at the top and bottom. It looks like this :
💭Something to remember; It is entirely up to you where you decided to take profit and where you decide to put your stop loss. The IDEAL anticipated targets are given, but the price may not necessarily reach these points. You have that entire zone to choose from and you can even have two or three take profits points in a position.
Now, what is the Risk Reward Ratio expressed in the center as a number.number ?
The risk to reward ration is exactly as the word says : The amount you risk for the amount you could potentially gain. NOTE that your risk is indefinite, but your gains are not guaranteed. The risk/reward ratio measures the difference between the entry point to a stop-loss and a sell or take-profit point. Comparing these two provides the ratio of profit to loss, or reward to risk.
For example, if you're a gambler and you've played roulette, you know that the only way to win 10 chips is to risk 5 chips. Your risk here is expressed as 5:10 or 5.10 .You can spread these 5 chips out any way you like, but the goal of the risk is for a reward that is bigger than your initial investment. However, you could also lose your 5 and this will mean that you need to risk double as much in your next play to make up for your loss. Trading is no different, (except there is method to the madness other than sheer luck...)
Most market strategists and speculators agree that the ideal risk/reward ratio for their investments should not be less than 1:3, or three units of expected return for every one unit of additional risk. Take a look at this example: Here, you're risking the same amount that you could potentially gain. The Risk Reward ratio is 1, assuming you follow the exact prices for entry, TP and SL.
Can you see why this is not an ideal setup? If your risk/reward ratio is 1, it means you might as well not participate in the trade since your reward is the same as your risk. This is not an ideal trade setup. An ideal trade setup is a scenario where you can AT LEAST win 3x as much as what you are risking. For example:
Note that here, my ratio is now the ideal 2.59 (rounded off to 2.6 and then simplified it becomes 1:3). If you're wondering how I got to 1:3, I just divided 2.6 by 2, giving me 1 and 3.
Another way to express this visually:
In the first chart example I have a really large increase for the long position and you can't easily simplify 7.21 so; here's a visual to break down what that looks like:
If you are setting up your own trade, you can decide at what point you feel comfortable to set your stop loss. For example, you may feel that if the price drops by more than 10%, that's where you'll exit and try another trade. Or, you could decide that you'll take the odds and set your stop loss so that it only triggers if the price drops by 15%. The latter will naturally mean you are trading at higher risk because your risk of losing is much more. Seasoned analysts agree that you shouldn't have a value smaller than 5% for your stop loss, because this type of price action occurs often during a day. For crypto, I would say 10% because we all know that crypto markets are much more volatile than stock markets and even more so than commodity markets like Gold and Silver, which are the most stable.
Remember that your Risk/Reward ratio forms an important part of your trading strategy, which is only one of the steps in your risk management program. Dollar cost averaging is another helpfull way to further manage your risk. There are many more things to consider when thinking about risk management, but we'll dive into those in another post.

The best thing you can do as a crypto traderLike many who trade crypto, I’ve got a bitter taste in my mouth after Friday night’s chash.
But with years in the market, I know it’ll pass.
Still, I wanted to give one honest piece of advice to anyone new to this space:
The best thing you can do is stay away from social media.
Everything you see there is fake.
The Lambos.
The “next 100x.”
The guys screaming into the mic about how to become a millionaire, how this coin will make you rich, or how “Trump will print millionaires again.”
You’ll hear about one whale wallet buying — next hour/day, another one selling — and you’ll ask yourself: why?
You’ll see the same people saying for over two years that the mythical altcoin season is just around the corner.
The same people who call for a “100x” no matter what the market does.
The same people who promise that XRP will hit $10,000 on November 21, and when that date passes, it magically becomes “by Christmas, by Summer, by Horses Easter (Romanian expression :) )”
And when one person says something ridiculous and it gets views, a hundred others copy it.
Then a thousand more come and make it even louder, more dramatic, more viral — because attention is currency, not accuracy.
Social media isn’t a place for trading.
It’s a place for noise.
For emotional manipulation.
For dopamine hits disguised as “alpha.”
If you want to survive in this market, learn to think independently.
The moment you stop looking for answers in influencers’ voices (of course, there are exceptions, but...), you’ll start hearing your own.
And that’s when you actually begin to grow as a trader.
P.S. And by the way — instead of scrolling on TikTok or whatever, pick up a real trading book.
At least there, you’ll find something concrete — not another fairytale about how to become a millionaire with the next meme coin.