EUR/USD - Multi Timeframe Analysis🧭 WEEKLY – Big Picture Bias (HTF Boss Level)
The weekly is consolidating inside a massive range between the mid-1.14s and the mid-1.18s.
Price has been stuck in that orange consolidation box for ages — building orders, trapping both longs and shorts.
But here’s the key:
🔥 Wave count wants a (3) push up
🔥 Structure is still bullish
🔥 Lows are protected
🔥 Liquidity is stacked ABOVE
Weekly is screaming:
➡️ “When I break out of this range, I’m sending it toward 1.20+.”
This is the expansion phase loading.
📅 DAILY – The Transition Zone
Daily just broke structure (BOS) and is pulling back into a clean Daily demand block.
This is the “engine room” for the next leg.
✔️ Trendline retest
✔️ Clean demand
✔️ Deviation → reclaim
✔️ Rejection of lower channel
And above?
📌 External BSL at the top of the channel
Price LOVES that level.
Daily bias:
➡️ Pullback → continuation into 1.17 – 1.18 zone
Daily wants to go UP.
⏳ 4H – Execution Level (Where You Actually Enter)
This is where the chess game gets spicy.
4H is sitting right above strong support with:
🔹 BOS
🔹 Retest of weak resistance
🔹 Re-entry into the channel
🔹 Daily demand just below
🔹 Perfect wave (1)(2)(3)(4)(5) corrective structure already completed
4H is showing small bearish trendline pressure,
but it’s weak — not impulsive, not HTF aligned.
So the play is:
🔻 Let price tag the daily demand (grey box)
🔺 Load the buy
🚀 Send to 1.17 – 1.1850 entry zone
Once 4H breaks that weak resistance?
It becomes a clean runway.
🎯 Full Forecast Summary (Simple Version)
HTF (Weekly)
🚀 Bullish
📌 Consolidating before expansion
🎯 Target: 1.2000 area (after breakout)
Daily
🔻 Pullback into demand
🔺 Reversal expected
🎯 Target: 1.17000 – 1.18000
4H
🟦 Buy zone: Daily demand (grey box)
🔥 BOS already complete
🎯 First target: 1.17000
🎯 Second target: 1.18500
Bias :
➡️ Bullish after retest
➡️ Continuation move is building
➡️ Lows are protected, highs are exposed
⚡ The Story the Chart is Telling
“Let me correct into demand, tag the daily block, kick the weak trendline away…
then I’m flying to take every BSL above.”
This is clean SMC + Elliott alignment.
Textbook.
Elliots

Gold - Next move🟡 GOLD – NEXT MOVE (Forecast)
This chart is screaming HTF correction vibe, lining up for a bigger rocket-launch leg once price finishes doing its clean-up job below. Let’s break it down 👇
🧱 1. Strong Resistance Above – The Big Ceiling
Price got smacked from that external BSL zone up top. That level is no joke — heavy sell orders sitting there, and the market reacted exactly as expected.
Think of that zone like the bouncer at the club:
➡️ “Not tonight bro.”
So yeah — rejection ✔️
🔻 2. Current Move = Sweepy Pullback Energy
Price is now dripping down in a corrective way.
Nothing impulsive.
Nothing aggressive.
Just a classic “let me grab liquidity before I send it” pullback.
We've already seen internal sell-side taken…
But the real bag sits lower. 👇
🧊 3. Strong Support Below – The Bounce Zone
That external SSL + demand block + trendline confluence zone is STACKED.
This is the place where market makers love to refill the engine before a major up-leg.
Expect price to:
✔️ Sweep liquidity
✔️ Tap the demand
✔️ Tag trendline
✔️ Rebalance the inefficiency
➡️ THEN send it 🚀
Basically…
“dip for the drip.”
📈 4. What’s Likely Next? (The Forecast)
Here’s the clean sequence:
🔻 Step 1 — Price dips into strong support
Red arrow on your chart nails the idea.
Expect that slow grind down, maybe a wick flush to catch late sellers.
🔄 Step 2 — Reversal formation
Small accumulation
Fake break
Wick trap
All the usual suspects.
🚀 Step 3 — Explosive rally back toward major resistance
Once demand holds, expect a fast, impulsive, and clean leg right back into the 4,300+ resistance zone.
This is where wave traders, SMC traders, and Elliott heads all agree:
BIG MOVE LOADING.
Wave (iii) also aligns perfectly with this.
🧭 5. Summary (Trader Friendly)
🔥 HTF = bullish (correction before continuation)
🧊 STF = bearish pullback into demand
🛒 Ideal Buy Zone = strong support + SSL
🎯 Target = 4,300 – 4,350
🚀 Bias = bullish after the sweep
⚠️ Avoid buying early — let the liquidity grab play out

AUD/USD - Forecast (To fall further)🇦🇺🇺🇸 AUD/USD – 8H Breakdown
AUD/USD just wrapped up that juicy Wave 3 run and topped near 0.6780. Now we’re cooling off with a corrective pullback — perfect spot to hunt buys 👀
🎯 Buy Zones
Buy Zone 1: 0.6520 – 0.6530 → first bounce area ⚡
Buy Zone 2 (Preferred): 0.6460 – 0.6480 → 71% retrace + wedge support 🏹
📈 Playbook
Let price dip into demand (ideally Buy Zone 2).
Load up → ride it back toward 0.6700.
If bulls flex, we sweep those 0.6780 highs for liquidity. 🚀
🔍 Outlook
Short-term: Expect deeper retrace into demand.
Mid-term: Bulls looking for another leg higher.
Bias : Pullback → Buy continuation 🔥

NAS100 - Trade Setup📊 NAS100USD – Multi-Timeframe Outlook
🔎 Monthly (1M)
Price moving inside a bullish wedge structure, with resistance tested near 25,200.
Support trendline holding firm, confirming strong macro bullish pressure.
Larger structure suggests Wave (5) still has room to expand toward 26,000+ if demand zones continue to hold.
🕰 Weekly (1W)
Elliott count clear: (1) → (2) → (3) extended, now correcting into (4).
Demand/FVG zones around 20,400 – 21,000 remain the critical swing support.
Next wave (5) projection aims at 25,000 – 26,000.
⏱ Daily (1D)
Structure consolidating within daily support, reacting from demand.
Breakout above 23,900 – 24,000 reactivates bullish impulse.
Invalidation lies below 22,950, where daily demand would fail.
⏳ 4H
Clear corrective retracement into daily demand (23,200 zone).
Long setup forming:
Entry: 23,222
Stop: 22,942
Target: 23,989
R:R ≈ 2.75
Short-term price action likely resolves higher into Wave (5) unless invalidation breaks.
🎯 Trade Plan
Bias: Bullish continuation into Wave (5)
Entry Zone: 23,200 – 23,300 (daily demand)
Targets: 23,989 (short-term), 25,200 – 26,000 (swing)
Invalidation: Daily close below 22,950

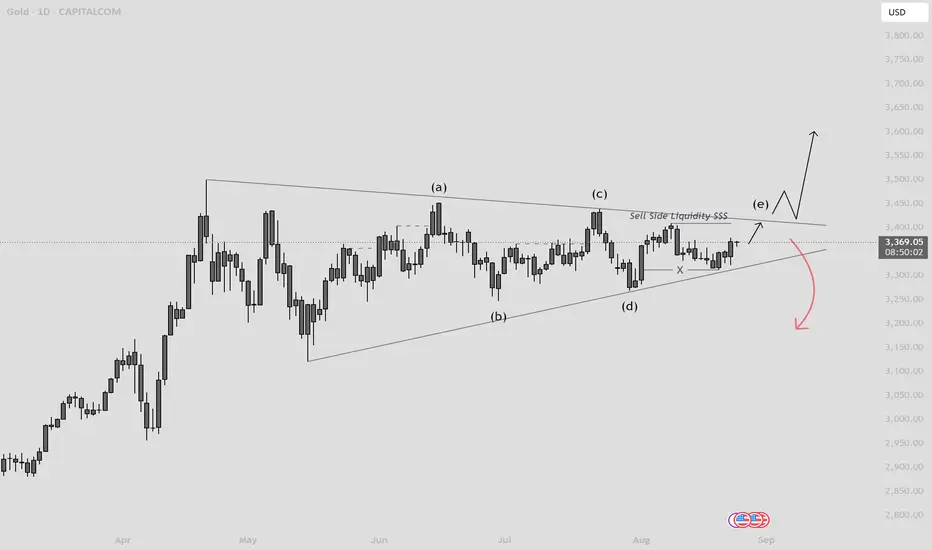
Gold - Elliot's Wave AnalysisBasic view of Elliot's wave analysis for Gold view. Currently we can see sell side Liquidity in sight and that WILL be my next range target.
We have been consolidating for a while now suggesting a firm breakout soon. After an abc pattern there is suggested to be an impulse wave to commence. Once sweeping sell side liquidity I will be either waiting for a break and retest of the Liquidity trend before impulsing into a new high range OR getting a firm Bearish breakout towards the downside.
Either at this point are quite likely. I usually only buy into gold but we are at a critical point for gold and the US dollar so keep your eyes locked!
another case for sub-10k bitcoini have tons of post now all trying to time the crash, some have been more accurate than others, but i want to keep reiterating that despite the sideways movement, we are still on the verge of wave 5 and to tread carefully when trading. nasdaq is in the same wedge currently, we are on the verge of the 2nd great depression.

bitcoin to finish wave 4, then flash crash for wave 5it is possible to trade this wave 4 ascending channel by longing the bottom and shorting the top, but once we near the end of wave 4 know that a flash crash will be immenent and you should either be shorting or holding stablecoins. watch for false breakouts. there was a false breakout in the ascending channel the price is currrently moving in. a real breakout solidifies the end of the long term downtrend and completely invalidates, but i find it unlikely.

NVIDIA WAVE AND PATTERN ANALYSIS The correctional structure, especially the three waves, whether in descending or ascending and pulse correction, indicates the formation of a diametric pattern. For the formation of wave b, which is another sign of diametric wave formation in wave a and g, in 1999 and 2019, respectively, we see diametric waves in their microwaves.
In the case of the formation of this structure, we will see a deep decline in many companies listed on the US stock exchange, which will last for several years and we are at the beginning of a possible major recession.
This post is just a personal idea and analysis should not be the criterion for buying or selling


Btc Elliot wave action to downsideHere we see most likely 4th corrective wave, that could touch 43-47k then complete 5th wave to 27-23k
I’m bullish all the time, no selling my coins,
But level to load lots of btc at 5th wave

UPDATE!! USDSEK the last leg 🦐USDSEK creates the last impulse wave according to FLAT correction (Elliot's wave).
You can see the old call on the chart! Don't miss our signals!
–––––
Here is the Plancton0618 technical analysis, please comment below if you have any question.
The ENTRY in the market will be taken only if the condition of Plancton0618 strategy will trigger.

BTCUSDT is inside a huge triangle 🦐BTCUSDT is inside a huge triangle, the price is creating a ABCDE pattern. As we know, triangle pattern is continuation pattern so, if the price will break the 'd' point we will wait the confirmation and set an order according to Plancton's strategy.
In Crypto we Trust
–––––
Here is the Plancton0618 technical analysis, please comment below if you have any question.
The ENTRY in the market will be taken only if the condition of Plancton0618 strategy will trigger.

BCHBTC ABC correction 🦐BCHBTC creates ABC correction, and we are waiting for fifth legs in order to complete ABC (Elliot's Wave)
When the price will break the support and flip it in resistance, We can set a short order according to Plancton's Strategy
–––––
Here is the Plancton0618 technical analysis, please comment below if you have any question.
The ENTRY in the market will be taken only if the condition of Plancton0618 strategy will trigger.

ETHBTC ABC Correction 🦐ETHBTC is inside ABC Correction , the market lost momentum and failed to create a new higher high.
The price retests the neckline and could start to create FLAT Correction (Elliot's wave)
According to Plancton's strategy, we can set a nice short
–––––
Here is the Plancton0618 technical analysis, please comment below if you have any question.
The ENTRY in the market will be taken only if the condition of Plancton0618 strategy will trigger.

USDSEK the fifth wave inside a Flat CorrectionUSDSEK creates the fifth wave inside a Flat Correction (Elliot's wave)
It's a second signal about this pair, you can increase your short position or open a new one, According with plancton's strategy.
–––––
Here is the Plancton0618 technical analysis, please comment below if you have any question.
The ENTRY in the market will be taken only if the condition of Plancton0618 strategy will trigger.

NZDCHF Broke the ascending channel 🦐 📉NZDCHF broke the ascending channel, and the price could create ZigZag Correction.
We are waiting for breakout the 'b' support and retest it in order to place a sell order according with our strategies.

Ripple (XRP) - Potential Breakout!We have a potential breakout! This is long awaited.
I believe this may be the first impulse wave as it retraced perfectly back to the 61.8% fib level.
I have constructed the worst-case Elliots impulse wave for the best scenario.
Let's see what happens... will it breakout?
- SXTRADING

XVG +250% profits opportunityVerge is one of the controversial crypto assets specially in the beginning of the year it accounted for a very huge amount of news coverage related to MCafee suggestions about this coin. If some of you didn't look at our Medium post earlier this year, this coin is one of the biggest game changers that existed in the whole crypto world. If one buys xvg coins on Jan 2017 with only 1 USD and wanted to sell it on the beginning of 2018 he would have profited 1.5 million times on his investment and that 1 USD will be 15000 USD. That game changing change obivously made some people even millionaires. Anyways starting from Mid April this coin was in a very highly downward slope movement. It seems this correctional downtrend is almost done and an uptrend is beginning to start in the following days. RSI is fairly around 45 and 21 DMA is above the price.
If it can show some engulfing chart behaviours and volume got some increament the verge is going up once again. Besides the Technical Analysis study results there is also a rumor that Huobi trading platform is listing XVG on its platform which most probably brings a big bounce in the short run.
Accumulation Zone : 291 - 320 sats
Targets :
Short Term :
T1 : 336 sats
T2 : 353 sats
T3 : 374 sats
T4 : 436 sats
Mid / Long Term :
T5 : 545 sats
T6 : 715 sats
T7 : 853 sats
T8 : 990 sats
T9 : 1186 sats
StopLoss : 260 sats
Good Luck.
Legal disclaimer:
Information on this channel is our team's analyst's "opinion" based on data available at this point in time. These opinions are not recommendations to buy or sell securities/commodities and cryptocurrencies. Trading and investing is a risk and you should not rely on this data to make any financial decisions. You must consult a financial advisory licensed by regulatory agencies in your legal jurisdiction. All information stated here and in our reports don't guarantee any possible profits or losses. Please do consider to do your own due diligence and research when making any kind of a transaction with financial implications. With Regards. TeamTWA.

NASDAQ 100 still have a small Long breathing spaceWave 5 about to get hit on NASDAQ 100, with price expectation for wave 5 at 7500-7575, thereafter we may have small ABC correction wave, just because is an uptrend market.


