Bitcoin is yet to reach a top, here’s whyHello Traders! Welcome to today’s analysis on bitcoin, I hope you’re doing good
From our last analysis on bitcoin, we tried to forecast a downtrend which didn’t quite play out because our wave c fib ratio exceeded 1.236 ideal extension for a wave c, which gave us more insight that what we called a wave c earlier is an extended wave 3, that was why I updated the idea with a note “trade closed manually” few hours later
So, where are we now?
Wave 3 gave an extension beyond 2.618 fib extension level which is the usual for btc, and that leads to a truncated 5th most times.
We saw a massive rejection very close to 20k region down to lower 18k, in wave 4, and the current structure may lead to a truncated 5th. Usually with truncated 5th, we have a long-term consolidation in wave 4 forming ABC corrective structure. Having a closer look at smaller timeframe, wave 4 seems to be forming a flat correction.
What is a flat correction?
Flat correction is one of the simplest corrective structures with 3 wave structure labelled ABC. The difference between a flat and zig zag correction is the amount of sub waves. While flat correction gives a smaller 11 sub-waves, zig zag gives 13 smaller sub-waves. The usual convention for a flat correction is 3-3-5 ABC waves
In this case, we had 3 waves complex correction in a, and waiting for the 3rd sub-waves in b to be completed before the final push downward in form of a wave c. The ending point of the last sub-wave in b will determine what kind of flat we get, if we close around the last high close to 20k, we’d call it a regular flat. If we close above 20k, then we’d call it an extended flat.
We can expect some rejection around 20k or slightly higher to complete wave c of the flat correction. If otherwise, I’ll post an update on that.
Conclusion: usually truncated 5th comes with a lot of scalping opportunities because of quick swings back and forth, just don’t get caught in the middle. We won’t be holding our positions for long we’ll be scalping the waves along.
If you’re don’t like scalping and you got an entry in mid 18k you can leave it open till we break above 20k. I’m forecasting mid 20k as the ending point for the truncated 5th, let’s see how things play out.
This is a very detailed analysis which could play out throughout the week or maybe more, I hope you get the idea.
I’ll stop here for now and update you more as the structure unfolds.
Trade setup: we entered a long trade below 18k, and we’ll exit the trade around 20k region before the next swing down.
If you enjoyed this analysis, don’t forget to hit the like button, subscribe to this channel to get latest updates and signals on bitcoin.
Don’t forget to share your charts, questions and contributions with the community in the comment section below.
Donations via Trading View coins also helps me at posting more free trading content and signals here.
Thanks for your continued support as always
Trade Responsibly.
I’ll see you all shortly
Have a great week traders!
Thank you
Nueel_classic
Elliottwaveanalyis

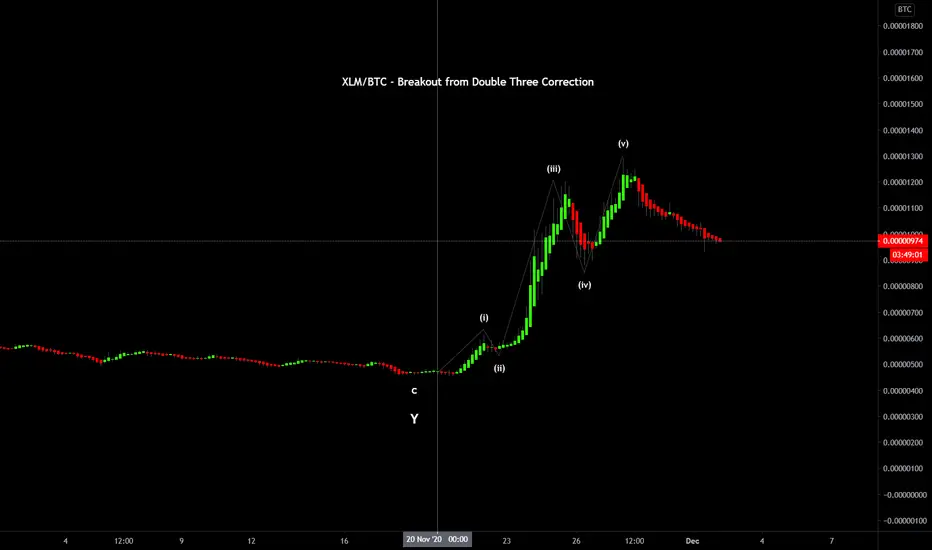
XLM/BTC - Breakout from Double Three Correction
An update on XLM/BTC. It looks like a clear breakout from the Double Three structure with price breaking out from the zigzag into an initial five wave impulse of a smaller degree. Let's see how it plays out for confirmation.
Please refer to the previous idea I have linked below and follow for further updates.
Trade safe,
Beyond Edge
Disclaimer
This is not trading advice. All content/ information shared in this idea is purely educational in nature and is expected to be used for analysis and illustration purposes only.
Do not trade or speculate based solely on the information provided. Trust your own analysis.
Beyond Edge
Bitcoin Weekly UpdateHello Traders, welcome to this week’s analysis on bitcoin. I hope you are all doing great
From our last analysis, we expected some retracements for wave W, which we got and I labelled wave X, having a closer look on the smaller timeframe, the corrective structure looks like a zig zag, with 5 waves down in W and 3 waves up in X, in theory we should label WXY as ABC, but I kept it as WXY to remove a bit of speculation in case there’s a change in trend.
Zigzag is the easiest type of correction to trade. Very similar with the motive phase with a 5,3,5 ABC structure. It’s a very common pattern to see in waves 2, 4 and B with 2 major rules:
Wave B(X in this case) must end below the starting point of wave A(which I labelled W)
Wave C(which I call Y) must break below the ending point of of wave A(which I called W).
So, what do we expect from here?
We expect btc to make a continuation to the downside to complete the corrective structure. The 16k region is a crucial point to watch. If it breaks, that will make more room for downward movement and 14k could easily come in place.
Trade setup: taking a short position from mid 18k and riding the wave down, target profit will be between 16k to 14k region. I’ll be updating the post as we move.
If you enjoyed this analysis, don’t forget to hit the like button, share, subscribe and stay tuned to this channel for more free updates.
Don’t forget to share your questions, ideas and chart with the community in the comment section below.
Donations via TradingView coins also helps me at posting more free trading content and signals here.
Thanks for your continued support as always.
Ride the wave and stay profitable
Have a wonderful week.
I’ll see you all shortly
Thank you
Namaste! Traders.
Nueel_classic.

Bitcoin latest updateHello traders, welcome to today’s analysis. I hope you are all doing great.
From our previous analysis, we took a swing trade from higher 17k region to around mid 19k, sorry I missed an update earlier this week.
We reached the top on btc around 19.5k with a lower sub-wave truncation and got some massive rejection.
Wave truncations generally indicates that the market is over stretched and reach a top, but in this case we can call this a local top for btc if and only if we get some healthy corrections to the downside to keep the bull run in motion and eventually shatter the ATH another possibility is a change in trend which there’s no confirmation for that yet except for the fact that we got a double top with ATH in our last rally.
The correction can come in any form and I don’t want to be all speculative about it, but usually with btc, WXY correction is a common one.
The first level of correction we got is about 0.618(or 68%) retracement of wave 5(higher degree) impulsive move which is around 16k region, I labelled that wave w.
The second level of correction we would like to see which could turn out to be a major correction for the impulsive move we’ve been tracking from higher 9k to 18k region could lead us to around 14 or 13k region, which is a good spot for re-accumulation for a market continuation pattern. If it fails, then that could hint a change in trend.
We’ll be taking the corrective phase one at a time and try to be less speculative as possible.
Trade Setup: We expect some retracement to 18k region (.5 or .618 fib level) which I’ll call wave x to correct for the recent dip we had before a continuation to the downside. You can wait for this retracement if you don’t want to scalp to 18k
If you enjoyed this analysis, don’t forget to hit the like button, share, subscribe and stay tuned to this channel for more free updates.
Don’t forget to share your questions, ideas and chart with the community in the comment section below.
Donations via TradingView coins also helps me at posting more free trading content and signals here.
Thanks for your continued support as always.
I’ll see you all shortly
Thank you
Namaste! Traders
Nueel_classic

XAUUSDHELLO Traders here is a full forecast of GOLD aka XAUUSD for a long term bullish . Trade based on price Actions indicated on the charts. Let me know your forecast ideas in the comments section based on your stratergy so we can learn each other.

XAUUSD Elliott Wave Forecast - Fourth Wave Still in ProgressHello all,
Price achieved 1800 today and had an initial bounce of the horizontal support. It's possible that it can drop into the 1750 - 1760 zone.
The corrective structure is still in formation. As mentioned in my previous idea, expecting to see a lower degree correctional structure forming over the next month to get a better idea of where the best possible entry will likely occur. Price action will likely be choppy.
Follow me for more updates on this one.
Trade safe,
Beyond Edge
Disclaimer
This is not trading advice. All content/ information shared in this idea is purely educational in nature and is expected to be used for analysis and illustration purposes only.
Do not trade or speculate based solely on the information provided. Trust your own analysis.
Beyond Edge

IHSG Elliott Wave updateMasih koreksi normal ke sekitar level 5350-5420 dulu sebelum kembali menguat lagi..

XAUUSD bullish scenario - Elliott Wave AnalysisXAUUSD short and medium term bullish.. in my opinion, XAUUSD will be break the peak level 2076 in the several month..
Daniel Agustinus, CEWA-M

USD/CHF - 2 Bullish & 1 Bearish Elliott Wave PatternsThe USD/CHF made two bullish Elliott waves, and it's making the third Elliott wave, but this one is bearish. This chart is all about learning to apply the Elliot wave pattern. The first bullish Elliott wave started on the 21st of October and ended on the 23rd of October . And the second bullish Elliott wave started on the 23rd of October and ended on the 4th of November .
Now, from the 4th of November, the bearish Elliot wave started, and The fifth wave is in the still making process. ABC correction is remaining .
If you like my technical analysis on the Elliott wave theory in this chart, then like, comment, and follow me.

US500- Get Ready-Thrust Upside Can Lead to Wave 3 DownsideFor Educational Purpose
Last Price- 3480 / 20:29 Hrs IST (Indian Standard Time) / 19th Oct2020
Wave (iv)- Penultimate wave -unfolding as a triangle then next wave should be the final thrust upside - only criteria is top @3588 should not be crossed for current wave count to be a valid count
Expecting
One push upside close to 3550/3570 to finish wave-(v) ( Crossing above 3506 highs)
Once wave-(v) done & holds below 3588 highs then we expect larger degree Wave-3 to unfold below 3588 tops
Wave 3 should travel 161% of Wave 1 distance downside giving us minimum target 3100 / 2950 later


US500- Will it drop & help India Nifty for Wave-Y? DownSP500 / US500 has been all messy & choppy -if upside rally stops in 3450-3475 then we expect down move with initial halt close to 3300 level & dropping further can take it to 2935-2950
-------------------------------------------------------------------------------------------------------------------------
NASDAQ 100 - Head & Shoulder at the top-12440 High (Bearish Outlook)
----------------------------------------------------------------------------------------
-------------------------------------------------------------------------------------------------------------------------
MCX Gold - Triangle Evolved into Ending Diagonal (Possible Scenario)
----------------------------------------------------------------------------------------------------
-------------------------------------------------------------------------------------------------------------------------
India Nifty Market Commentary
-----------------------------------------
India Nifty was struggling to move above 11900 post-gap-up move & whole of the session was all up before dropping sharply in last hour might be showing its intension that domestic & global markets all may get ready for a move towards south.
India Nifty has moved up recently as X-Wave (10790 to 11905) -looks like an irregular correction & could be heading down in Wave-Y if holds below 11870/11880 zone
India Nifty -Last Idea Published


EURUSDBased on my EWC we might expect a correction of wave 4 minor degree. We might see a triangle taking place or else an abc or complex correction. If you got any questions please do not hesitate to ask me. I am verry happy to help.
Thanks and let me know what are your thoughts!

EURUSD - Preparation of terminal thrustCurrent scenario seems to be a corrective move , that too in a triangular wave structure before the currency prepare gives a terminal thrust to complete its 1-2-3-4-5 impulsive wave. As of now the price will move up & likely to face resistance near the zone of 1.18500 which will complete the wave - d of the triangular wave. After facing the resistance , the currency pair is likely to take a support near the level of 1.1800 which will form the wave - e .
After the completion of wave - e there will be another impulsive terminal thrust to complete wave (v) of 5 .
