The Road to DOW 100KWhy the Fourth Turning Won’t Resolve Until Super Cycle Wave III Peaks and Wave IV Finds Bottom:
As we close out 2025 with the Dow Jones Industrial Average within reach of the psychological 50,000 level and despite all the well-deserved doom and gloom, the question on every die-hard bullish investor’s mind is not if the index will reach 100,000, but when — and what price will be paid along the way.
Some analysts interpret the structure as Grand Super Cycle Wave III (or V), depending on where they anchor the pre-industrial baseline. This distinction does not alter the implications: under both counts, the current advance is still part of an extended third wave, and third waves are not where secular crises resolve. They are where excess accumulates.
The rarely seen proprietary chart above from 1693, which splices British Stock prices and the Clement Burgess Index to the Dow, presents a radical yet rigorous Elliott Wave-based perspective:
Before unpacking the connections, a brief orientation is helpful. Elliott Wave degree structures range from small, short-term patterns up to century-scale formations known as Cycle, Super Cycle, and Grand Super Cycle. These higher-order waves capture long economic booms, demographic arcs, technological eras, and broad civilizational moods. When an impulse of this magnitude is still unfolding, the society riding atop it rarely enters true crisis resolution until the wave completes.
The entire advance of the Dow from the 1896 low is part of one single Super Cycle III wave. It is currently in the late stages of a smaller and ongoing 16-year Cycle Wave V within a larger GRAND SUPER CYCLE Wave III (or V, depending on the higher-degree interpretation). The implications are profound.
NOTE: It took 66 years (1900-1966) for the Dow to advance 10x from 100 to 1000, then only 33 years (1966-1999) for another 10x move from 1000 to 10,000. If Elliott’s rule of alternation applies, it might be 66 years from 1999, or 2065, before the Dow advances another 10x from 10,000 to the 100,000 level. Should a Venezuela-like inflation occur in the coming years, it is conceivable that the Dow reaches its 10x 100K milestone 33 years from 1999, or by 2032.
The generational crisis known as the Fourth Turning — the societal upheaval Strauss and Howe originally predicted would end by 2026 — will not find resolution until Super Cycle Wave III tops and its corresponding Wave IV bottoms, likely sometime between 2030 and 2036.
BULLISH NOTE: As captioned beneath the chart above, it is plausible that strong inflationary winds can extend the current 16-year Cycle Wave V to 2030-2032, inverting our suspicion for a severe decline into this period. If this occurs, Super Cycle III will have thrown over the upper trend channel and be marked accordingly.
Because Super Cycle III has not yet peaked, the conditions required for a true Fourth Turning catharsis have not yet formed. Instead of concluding, the crisis continues to compound—geopolitical fractures, monetary instability, demographic strain—held in suspension by a still-advancing secular market wave. The tension builds, but the break has not arrived.
Until Super Cycle III peaks, perhaps in 2026, when it surpasses the 5X threshold of 50K after passing its last major 10X milestone at 10K in 1999, the path remains upward with violent trepidation.
The Grand Channel: A 330-Year Perspective
When British stock data from 1693 is spliced with the Dow Jones Industrial Average beginning in 1896, a remarkable parallel channel emerges:
The lower trendline connects the Clement Burgess 1857 low, the 1896 low, and the 1932 low.
The upper trendline is a parallel copy drawn from the 1720 South Sea Bubble peak, which aligns rather nicely with the current print highs in the Dow for 2025-2026. A throw-over above the upper trend channel is always possible.
This channel has contained the entire modern equity advance for over three centuries. The current price action is pressing hard against the upper boundary — a classic termination signal in Elliott Wave analysis.
The Grand Super Cycle uptrend channel from 1693 to the present.
Super Cycle Degree: One Unfolding Impulse
The entire move from 1896 is labeled as a single Super Cycle advance:
Super Cycle I — 1857 low to 1881 high
Super Cycle II — 1929 crested with an expanded Cycle degree B wave peak high leading to the 1932 low (a sharp, primary five-wave down Cycle degree C-Wave correction terminating Super Cycle II).
Super Cycle III — 1932 low to present (extended, currently completing an extended Cycle V)
The post-1932 advance is not five complete Super Cycle waves. It is an extended third at Super Cycle degree still in progress, with the current rally from the 2009 low representing Cycle V within that larger III wave.
This labeling reconciles and defines the extraordinary duration and amplitude of the bull market without violating Elliott’s rules of proportionality and alternation.
Primary and Cycle Degree: The Final Leg
Within the ongoing Super Cycle III, the advance since 1932 subdivides into five clear Cycle waves with an additional subdivision at the primary degree between 1942 and 1999.:
Cycle I — 1932–1937
Cycle II — 1937–1942
Subdivided Primary Degree (within Cycle III):
Primary 1 — 1942-1946
Primary 2 — 1946-1949
Primary 3 — 1949-1965
Primary 4 — 1965-1982
Primary 5 — 1982-1999
Cycle III — 1942–1999
Cycle IV — 1999–2009
Cycle V — 2009-present (extended, currently in its terminal phase 2025-2032)
The post-2009 Cycle degree rally is the last of Cycle V (terminal to Super Cycle III from the 1932 low) — the structure that produced the extraordinary gains of the past sixteen years.
FOUR DEGREES of TREND: Grand Super Cycle Waves are the largest Roman Numerals noted in red, Super Cycle labels are in black, Cycle degree in blue, and the smallest Primary waves are illustrated with standard red numerals and letters.
The Fourth Turning Resolution
The Strauss-Howe updated Fourth Turning framework predicts a period of intense societal crisis peaking in the late 2020s to early 2030s.
In Elliott Wave terms, this crisis corresponds to Super Cycle Wave IV — the deep, multi-year correction that must follow the completion of Super Cycle III.
This correction will likely take the form of a sharp zig-zag, or complex combination, lasting 3–8 years and retracing at least 38% of the entire advance from 1857. Such a decline would drive the Dow down toward the COVID lows of 2020, near the 18,000 level.
The resolution of this Fourth Turning — the rebirth phase — will not begin until Super Cycle Wave IV finds its bottom, projected to occur within the 2030–2036 timeframe.
Only then will Super Cycle Wave V begin — the final advance that carries the Dow to its next 10x target of 100,000.
Conclusion
The market is not yet in the final stages of a multi-century bull market ending in a grand cycle collapse, but rather approaching a Super Cycle Wave IV bear market event , which could still strip the Dow by 60-65% before the Super Cycle V wave bull resumes. The Dow is in the late stages of a multi-century third wave that still has one more explosive leg ahead to tag the Grand Super Cycle terminal.
The Fourth Turning crisis will be severe, but it will be a corrective event within a larger bullish structure — not the end of the Grand Super Cycle advance.
Although investors may wish to sidestep the pending decline, those who mistake Super Cycle Wave IV for the end of the bull market will miss the greatest opportunity of the coming generation.
The channel is speaking.
The waves are clear.
And after some much-needed, long overdue, and well-deserved pain, 100,000 on the Dow remains not just possible — but inevitable. Let’s hope so, anyway.
Elliottwavecount

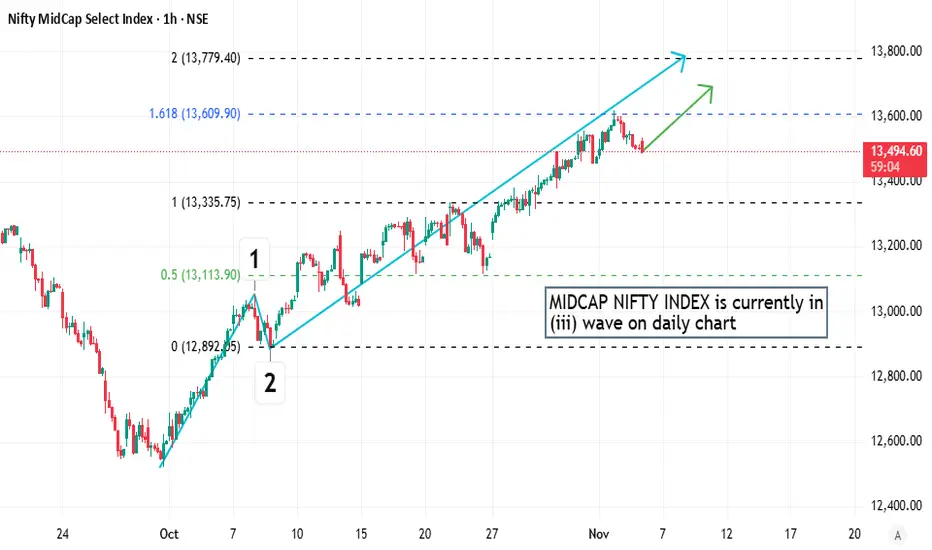
Elliot Wave Analysis of MIDCAP NIFTYThe chart is currently doing (iii) up sub-wave on daily chart and this up wave is underway and more to go. After that, a retracement down should follow in sub-wave (iv).
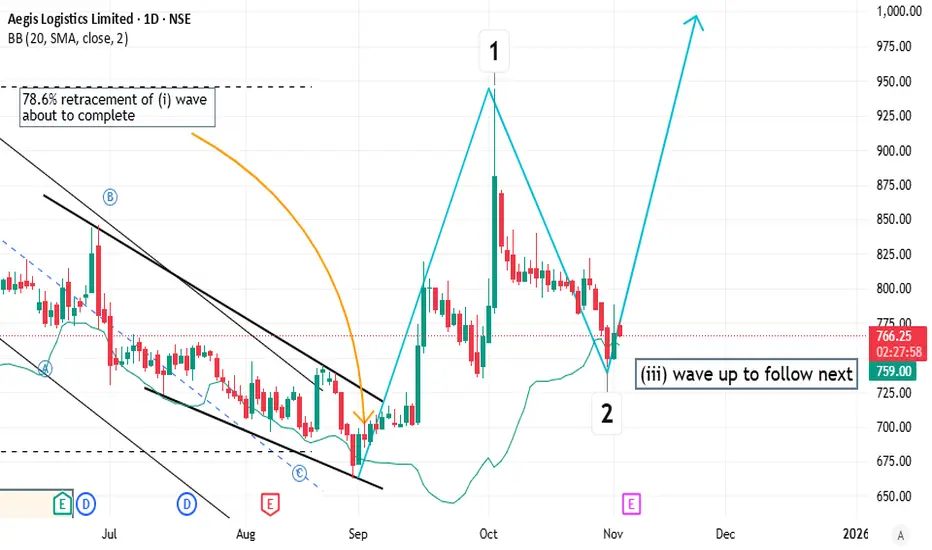
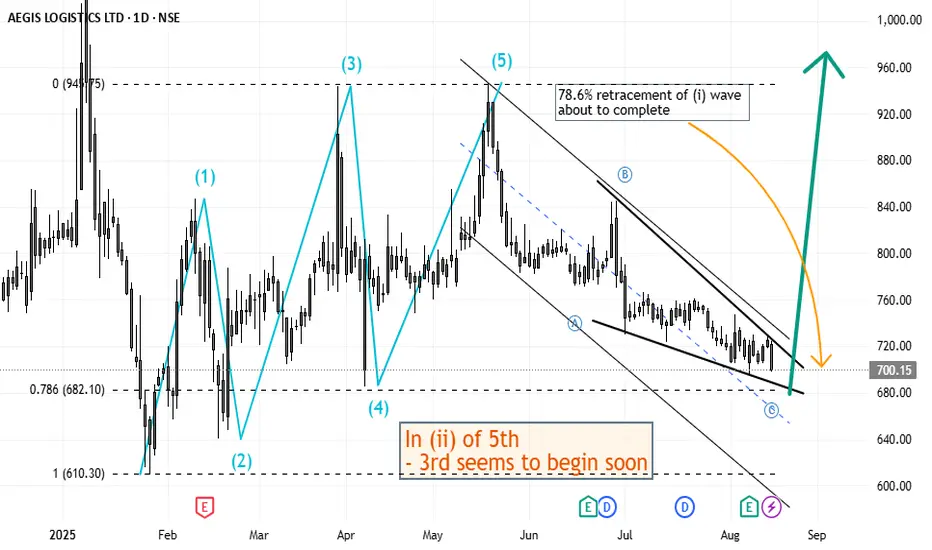
Elliott Wave Analysis of AEGISLOGIn line with previous analysis,
(ii) subwave retracement is done
(iii) wave up should follow next
Elliott Wave Analysis of CNXFMXGFMCG index is well underway its 3rd wave
Currently in (ii) of 3rd
(iii) up swiftly should follow next

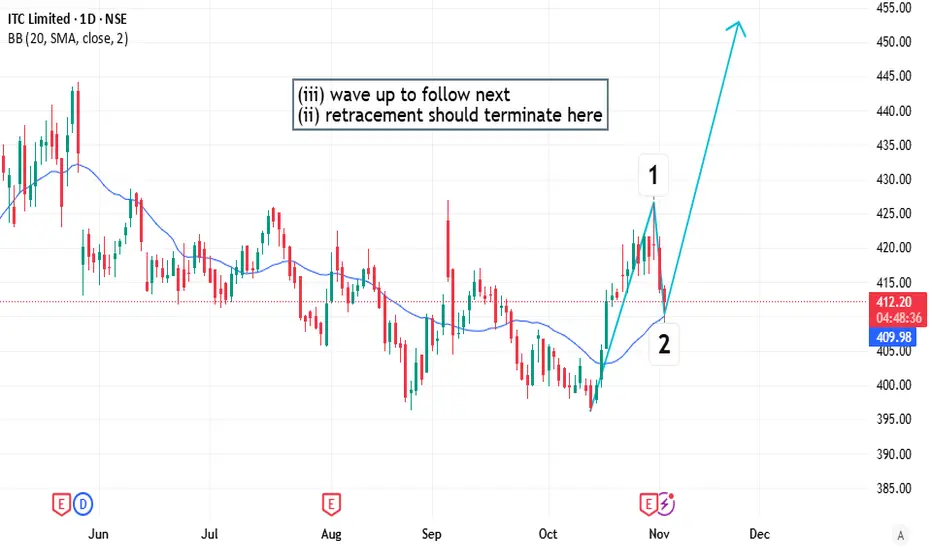
Elliott Wave Analysis of ITCITC and FMCG index will start their (iii) - 3rd wave next and (ii) wave should terminate here.
(ii) wave in ITC had a flat corrective structure, that means (iii) wave might be extended.
EUR/USD Elliott Wave Update: Wave (iv) Correction UnfoldingThis EUR/USD chart shows the market undergoing a complex corrective phase, labelled as wave (iv), likely forming a triangle pattern (a)-(b)-(c)-(d)-(e) after an impulsive rally. The correction is taking place within a well-defined base channel, suggesting consolidation before a potential breakout into wave (v) targeting higher levels near 1.19–1.20. As long as the channel holds, the Elliott Wave structure supports a bullish continuation once the correction completes.
Keep following for regular breakdowns as the bigger trend unfolds.

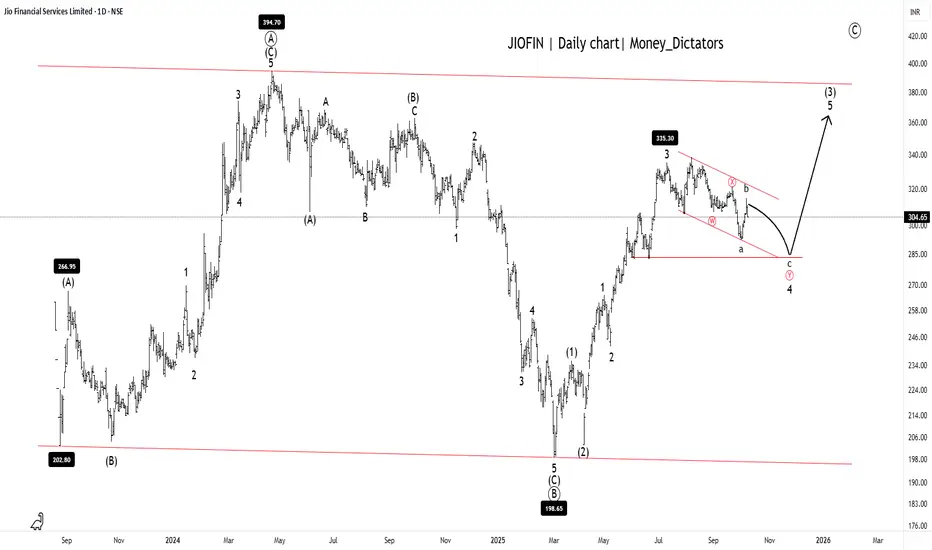
JIOFIN Setting Up for the Next Big Breakout!JIOFIN Daily chart
Possible short-term dip toward 285 - 290.
Long-term Levels: 335, 368, and 342.
Overall Trend: Bullish
Short-term trend: Bearish
JIOFIN is ready for the final upsurge as the correction ends at wave (C). A major A-B-C correction of the primary degree is clearly visible on the daily timeframe chart. Upon closer examination, it appears that the JIOFIN is currently in wave (Y) of wave 4. After completion of the wave 4 structure, Stock will set for the wave 4 for the given long-term levels.
Stay tuned!
@Money_Dictators
Thanks :)
NQ TradesB wave is in. Currently within 1st minutte wave of the intermediate C wave down, of the current 4th wave. Entry of the 382 retracement of the most recent 3rd wave, SL coveres upto 618. Looking for just 161.8% trend based fib of the 1-2 waves. Effectively predicting the terminus of the 3rd wave, we then allow a 4th to occur, then 5 to complete the first wave down of the C wave. Bosch.

Understanding Elliott Wave Analysis: A Daily Outlook ExampleHello Friends, Welcome to RK_Chaarts!
Today we're going to explore Elliott Wave Analysis using a daily outlook example of Lloyds Enterprises Ltd Chart. Please note that this is for educational purposes only.
Important Disclaimer:
- This analysis is not trading advice.
- I am not a SEBI-registered analyst.
- Please consult your financial advisor before trading or investing.
Understanding Elliott Wave Analysis
In this educational guide, we'll walk through a daily outlook analysis using Elliott Wave theory. Our goal is to identify potential price movements and understand the underlying wave structure.
Current Market Analysis
We are currently analyzing a daily chart, and our analysis suggests:
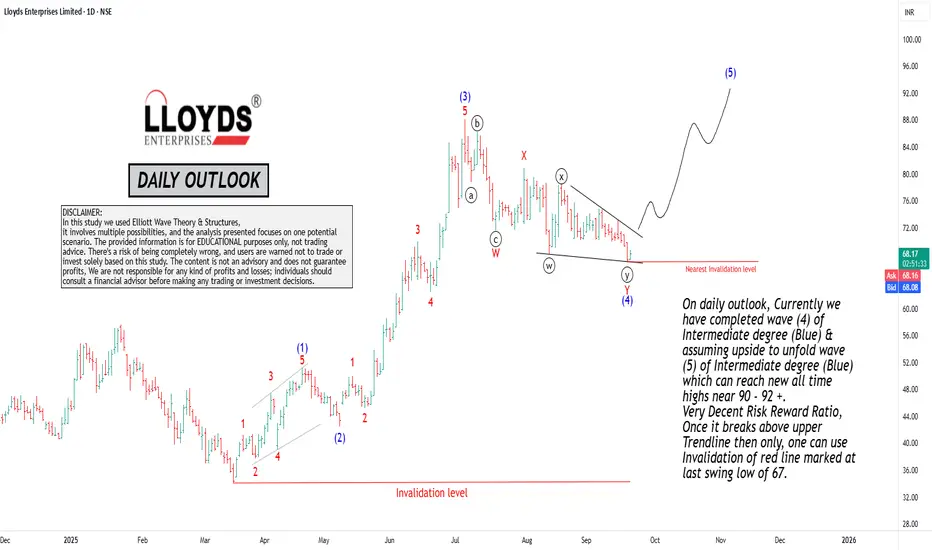
- We have completed wave (4) of Intermediate degree (blue).
- We assume an upside movement will unfold, forming wave (5) of Intermediate degree (blue).
- This wave (5) has the potential to reach new all-time highs near 90-92+.
Risk-Reward Ratio
Our analysis indicates a very decent risk-reward ratio. This means that the potential upside movement is substantial compared to the potential downside risk.
Trade Setup
To validate our trade setup, we are watching for a break above the upper trendline. Once this break occurs, we can consider using the invalidation level marked at the last swing low of 67.
Key Takeaways:
1. Elliott Wave Structure: Understand the current wave structure, including the completed wave (4) and the anticipated wave (5).
2. Potential Price Movement: Recognize the potential for wave (5) to reach new all-time highs.
3. Risk-Reward Ratio: Acknowledge the decent risk-reward ratio, which supports the trade setup.
4. Trade Validation: Wait for a break above the upper trendline to validate the trade setup.
By applying Elliott Wave analysis and understanding the underlying wave structure, traders can make more informed decisions and identify potential trading opportunities.
Remember:
Most investors treat trading as a hobby because they have a full-time job doing something else. However, if you treat trading like a business, it will pay you like a business. If you treat it like a hobby, hobbies don't pay, they cost you!
Hope this post is helpful to the community!
Thanks,
RK
Disclaimer and Risk Warning:
The analysis and discussion provided on in.tradingview.com are intended for educational purposes only and should not be relied upon for trading decisions. RK_Chaarts is not an investment adviser, and the information provided here should not be taken as professional investment advice. Before buying or selling any investments, securities, or precious metals, it is recommended that you conduct your own due diligence. RK_Chaarts does not share in your profits and will not take responsibility for any losses you may incur. So please consult your financial advisor before trading or investing.
Elliott Wave Analysis of Optiemus Infracom OPTIEMUSOn hourly chart, Optiemus has completed diagonal 1st. 3rd will go up after 2nd completed. 2nd might be forming a flat correction or a combination pattern.

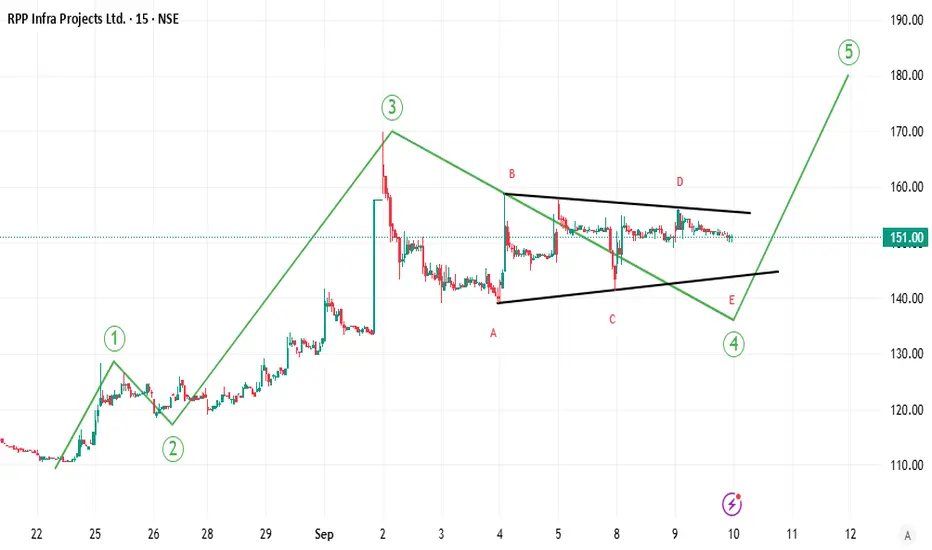
Elliott Wave Analysis of RPP Infra Projects RPPINFRAThe script is in (iv) wave on hourly chart of 1st wave on daily chart. The (iv) has formed a triangle and in last E sub-wave.
EURUSD | TRADING PLAN | DAY 28🔵 Demand Zone (Buyers’ Area):
1.1623 – 1.1580
Price has completed an ABC corrective structure and is now entering the demand zone.
Expectation: Buyers to step in and push the price higher.
🔴 Supply Zones (Targets):
1. 1.1658 – 1.1688 → First supply zone, ideal for partial profit-taking.
2. 1.1705 – 1.1720 → Major supply zone, where strong sellers may re-enter.
📌 Trade Idea:
Look for bullish confirmation (reversal candle / liquidity sweep) inside the demand zone.
Entry: 1.1625 – 1.1600 (within demand zone).
Stop Loss: Below 1.1573 (protected low).
Take Profit 1: 1.1658
Take Profit 2: 1.1688 – 1.1720
⚖️ Risk–Reward Ratio (RRR):
Approx. 1:3 to 1:4 depending on entry execution.
---
✅ This plan is valid as long as price holds above 1.1573.
📌 Discipline with SL & partial profits is key.

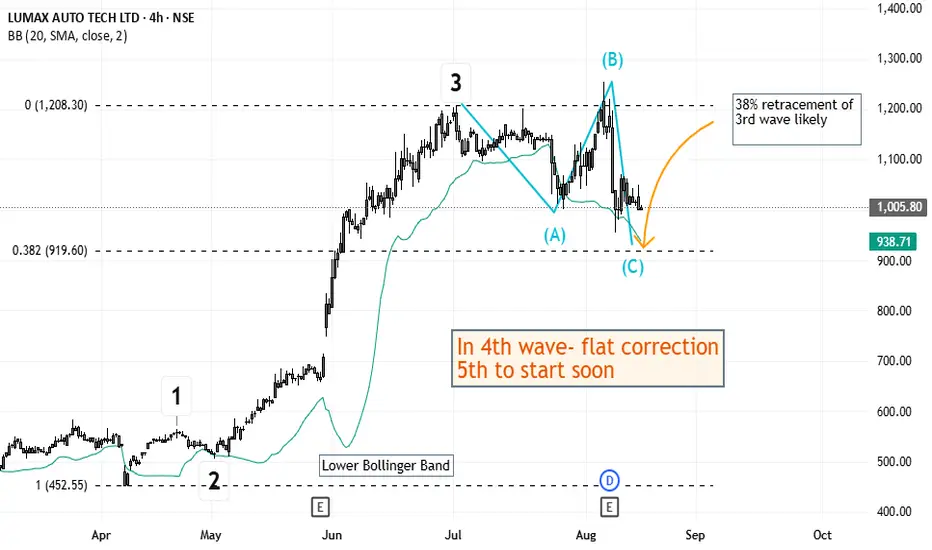
Elliott Wave Analysis of Lumax Auto Technologies LUMAXTECHLumax appears to be in 4th wave currently. The 4th wave turned out to be a flat corrective wave with (3-3-5) internal waves. One lower low is probably remaining before 4th is completed.
Elliott Wave Analysis of Ashapura Minechem ASHAPURMINThe script is currently in retracement wave 4 and at a crucial support. When completed, next 5 waves impulse should follow in 5th wave.

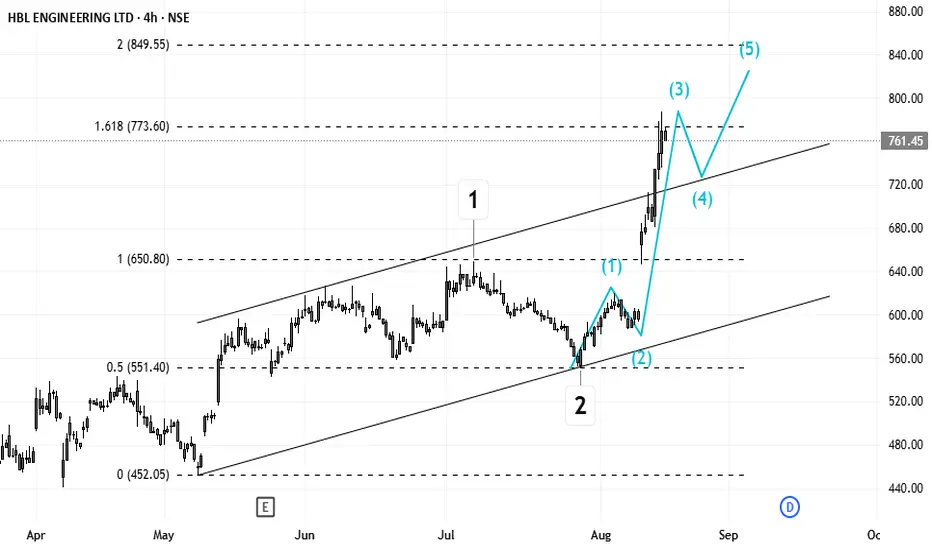
Elliott Wave Analysis of HBL Power Systems HBLENGINEThe script seems to be doing 3rd wave on daily time-frame. The first wave was diagonal. After 3rd is done, a retracement should follow and then again an impulse wave 5th to complete the larger impulse move.
Elliott Wave Analysis of Apollo Tyres APOLLOTYREApollo Tyres has completed a complex correction which seems to be a combination of a flat wave and a zigzag wave. Also, the B wave in zigzag was a triangle retracement. A 5 wave impulse should follow after this.

Elliott Wave Analysis of Aegis Logistics AEGISLOGThe script is doing 5th of weekly time-frame and seems to about to complete (i) of 5th with 78.6% retracement. The (i) was a diagonal impulse wave. And now in retracement, the C wave also appears to be forming an ending diagonal. After this is completed, (iii) wave should start.
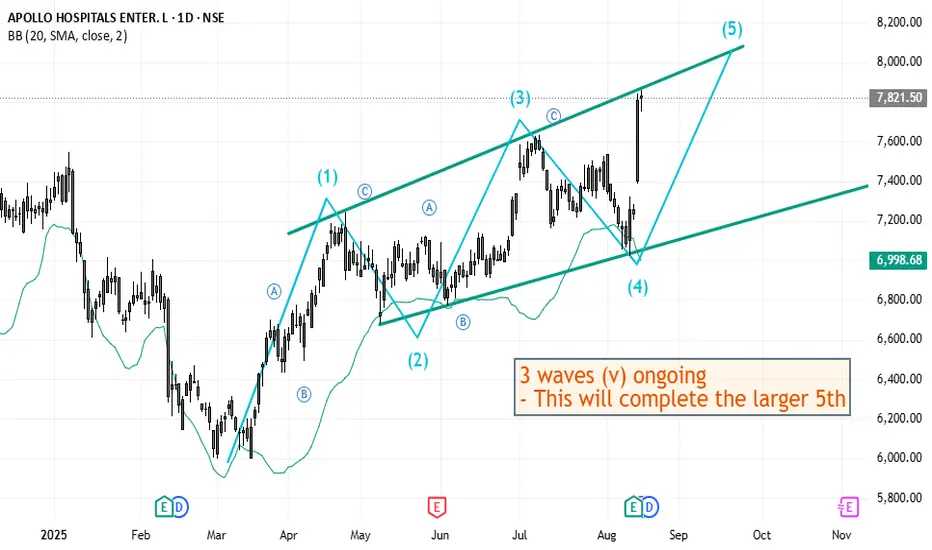
Elliott Wave Analysis of Apollo Hospitals APOLLOHOSPApollo Hospitals has been doing a diagonal and is currently in the (v) wave of the diagonal 5th. After this short term long, it appears to be followed by a bigger retracement.
GOLD (XAU/USD): 12 AUG, 2025 | ElLLIOTT WAVE ANALYSIS©Hua Cuong (Shane), CEWA-M | Certified Elliott Wave Analyst - Master Level
Conclusion: Wave C))-green is moving lower.
Key Points: Wave C could be headed towards 3,322 or lower like 3,267.937.
Alt wave count scenario is gaining weight, but in the short term, it will probably also target 3,322.056. If gold then moves above 3,409.040, it will trigger the ALT count, otherwise it will continue to move lower to 3,267.
-> Key Point: 3,322.056.

Potential Reversal Ahead: Elliott Wave AnalysisHello friends,
Welcome to RK_Chaarts,
Today we're going to analyze chart of stock named IDFC First Bank, based on Elliott wave theory.
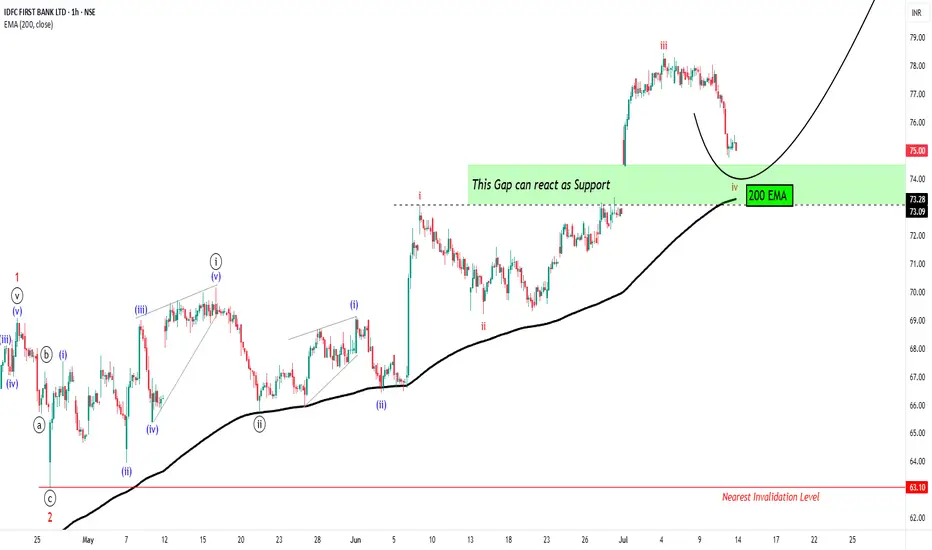
Today, we're analyzing the chart of IDFC First Bank using Elliott Wave theory. On the chart, we've marked the Elliott Waves, indicating that:
- Red wave 1 and 2 (Minor degree) have ended
- Price is unfolding into red wave 3 (Minor degree)
- Black wave ((i)) and ((ii)) (Minute degree) have completed
- Black wave ((iii)) (Minute degree) is ongoing
- Blue wave (i) and (ii) (Minuette degree) have finished
- Blue wave (iii) (Minuette degree) is in progress
- Red wave i, ii, and iii (Subminuette degree) have completed
- Possibly in the correction phase of red wave iv (Subminuette degree)
We observe that the price gapped up, retraced to correct wave iv, and is now supported by the gap zone. Along with 200Exponential Moving Average is also at Gap level which can also provide a good Support to same view.
Our estimate suggests a high probability of a price reversal. However, market uncertainties exist.
Potential price targets: 81, 93, and 100+
Nearest invalidation level: 73.09 (wave iv should not overlap wave i)
Please note that this analysis is for educational purposes only. I'm not a SEBI-registered analyst, and you should consult your financial advisor before trading or investing.
Let's see how the market unfolds. This entire study is shared solely for educational purposes. Thank you so much.
I am not Sebi registered analyst.
My studies are for educational purpose only.
Please Consult your financial advisor before trading or investing.
I am not responsible for any kinds of your profits and your losses.
Most investors treat trading as a hobby because they have a full-time job doing something else.
However, If you treat trading like a business, it will pay you like a business.
If you treat like a hobby, hobbies don't pay, they cost you...!
Hope this post is helpful to community
Thanks
RK💕
Disclaimer and Risk Warning.
The analysis and discussion provided on in.tradingview.com is intended for educational purposes only and should not be relied upon for trading decisions. RK_Chaarts is not an investment adviser and the information provided here should not be taken as professional investment advice. Before buying or selling any investments, securities, or precious metals, it is recommended that you conduct your own due diligence. RK_Chaarts does not share in your profits and will not take responsibility for any losses you may incur. So Please Consult your financial advisor before trading or investing.
DXY Monthly Analysis | Smart Money Concept + CHoCH BreakdownPair: US Dollar Index (DXY)
Timeframe: 1M (Monthly)
Strategy: Smart Money Concept (SMC) + Market Structure + Demand/Supply Zones
Bias: Bearish (Mid to Long-Term)
Breakdown:
Price reacted strongly from the monthly supply zone (110–104), showing signs of exhaustion.
Clear CHoCH (Change of Character) visible at the top structure, confirming loss of bullish intent.
Internal structure printed a liquidity sweep + FVG (Fair Value Gap) ➝ BOS ➝ lower low.
Current PA (price action) is targeting the first demand zone near 92–94, but major interest lies at the macro demand zone (85.100–84.900).
This level aligns with unmitigated historical demand and potential long-term accumulation range.
---
📅 Projection:
Expecting a continuation to the downside after retesting minor imbalance zones.
Potential multi-year bearish leg forming Wave 3 (macro view).
Ideal accumulation/buy zone: 85.100–84.900 – if structure supports.
---
📌 Key Levels to Watch:
Supply Zone: 110.800 – 104.600
CHoCH Level: ~102.300
Short-Term Demand: 92.000 – 94.000
Long-Term Demand (Institutional Interest): 85.100 – 84.900
---
💡 Conclusion: Smart Money has exited from premium pricing, and the macro structure aligns with a bearish transition. As long as price respects current lower highs, we may see a deeper correction or possible trend reversal near 85 levels.
---
🧠 #DXY #SmartMoney #CHoCH #ForexAnalysis #SupplyAndDemand #PriceAction #Forex #Month

GOLD - Buy the dips toward the 50% / 61% retracement...the decline from the 22nd of April is in a very clear 3 waves with a perfect 100% retracement. the subsequent rally from the 15th of May is in a clear motive sequence. negative RSI divergence signals that some sort of 5th wave is complete.
the characteristics of this motive rally seems like a wave (i) of V is complete and we are now looking for a drop to complete wave (ii) of V.
buying dips toward the 50% / 61% retracement is my preferred strategy for now.
a rally and daily close above 3400 would invalidate this analysis. keep in mind possible volatility due to upcoming event risk.

Technical Analysis with Elliott Waves: A Combined ApproachHello friends, Welcome to RK Charts!
This Educational Post is based on technical analysis, specifically how to initiate analysis on a chart, and what points to consider. This is purely for Educational purposes.
This is not a trading or investing tip or advisory. Rather, it's a comprehensive guide on how to easily analyze a chart, intended for educational purposes. I hope that by reading and understanding this post, you'll gain valuable knowledge and insights. Your focused effort to understand this will surely provide you with something valuable and easy to grasp.
Let's dive in, During technical analysis, what we had observed certain points in this chart, I'm highlighting them here:
1. Resistance line breakout, where the price has closed above it.
2. The volume within that breakout.
3. The price closing above Weekly Exponential Moving Averages.
4. Elliott Wave Counts.
5. Projected Target along with Invalidation level as per Elliott Wave theory.
6. Projected Duration for Projected Targets.
Breakout of Resistance zone with Good Volume intensity:
So, friends, here we can clearly see on the chart that this is a weekly time frame chart of Shipping Corporation of India Limited. Over the last eleven months, from July 2024, the price has been falling, remaining largely bearish, but has now broken out of Curved Resistance Trendline for the first time with a bullish candle on Weekly (Closing basis), accompanied by good volume intensity.
Alongside this, the price has sustained and closed above Major EMAs:
- 50-Weekly Exponential moving average (red line plotted on the chart)
- 100-Weekly Exponential moving average (blue line plotted on the chart)
- 200-Weekly Exponential moving average (black line plotted on the chart)
on the weekly time frame.
Elliott Wave Theory:
Considering the Elliott Wave structure, if we look at it theoretically, the top it made on July 2024, was the completion of Wave III. After that, it completed Wave IV in 7 swings (WXY) and is now possibly moving higher, making higher lows. It has closed above the moving averages, broken out of the Curved Trendline, and has strong volume. So, possibly, we are unfolding an impulse Wave V.
In Elliott Wave Theory, the invalidation level means that the price should not go below that level, which in this case is the low of Wave IV at ₹130. If the price goes below that level for any reason, even by a single point, our wave counts will be invalidated, and we'll have to re-analyze the chart.
That's why we call it the invalidation level. Analysts and traders also refer to it as a stop-loss level. So, in Elliott Wave Theory, our wave counts remain valid as long as the price stays above the invalidation level and doesn't trigger it.
Now, regarding the target, if we take the measurement of Wave IV and calculate its 1.236 level, the target for Wave V should be above the high of Wave III. According to Elliott Wave Theory, the projected target for Wave V is near ₹440, which is the 1.236 Fibonacci level.
Projected Duration for Projected Targets:
In the chart analysis we conducted, where we prospectively projected a target, if everything goes right and the invalidation level is not triggered, what could be the duration of this target? It will definitely take more than a medium-term duration, maybe even a long-term duration.
This is because each candle represents a week, and we're currently looking at the weekly time frame. Since the fourth wave has just ended and the fifth wave is upcoming, it will take a long-term duration
I am not Sebi registered analyst.
My studies are for educational purpose only.
Please Consult your financial advisor before trading or investing.
I am not responsible for any kinds of your profits and your losses.
Most investors treat trading as a hobby because they have a full-time job doing something else.
However, If you treat trading like a business, it will pay you like a business.
If you treat like a hobby, hobbies don't pay, they cost you...!
Hope this post is helpful to community
Thanks
RK💕
Disclaimer and Risk Warning.
The analysis and discussion provided on in.tradingview.com is intended for educational purposes only and should not be relied upon for trading decisions. RK_Chaarts is not an investment adviser and the information provided here should not be taken as professional investment advice. Before buying or selling any investments, securities, or precious metals, it is recommended that you conduct your own due diligence. RK_Chaarts does not share in your profits and will not take responsibility for any losses you may incur. So Please Consult your financial advisor before trading or investing.
