ETHUSD Ascending channel breakdown selling strong🚨 ETHUSD Technical Update 🚨
📉 Breakdown Alert!
ETHUSD has officially broken down from its ascending channel and key support area around $3,950 — signaling potential bearish momentum ahead.
💥 Selling Zone: $3,950
🎯 Technical Target: $3,700 (next major support zone)
📊 Indicators:
✅ EMA 50 breakdown confirmed — bearish bias strengthening.
⚠️ EMA 20 is crossing down toward the EMA 50, which could confirm further downside pressure.
🧭 Bias: Bearish below $3,950
💡 Watch for potential retests of the breakdown zone before continuation lower.
#ETH #Ethereum #CryptoAnalysis #TechnicalAnalysis #TradingSetup #BearishSignal 🐻📉
Ema200crossover

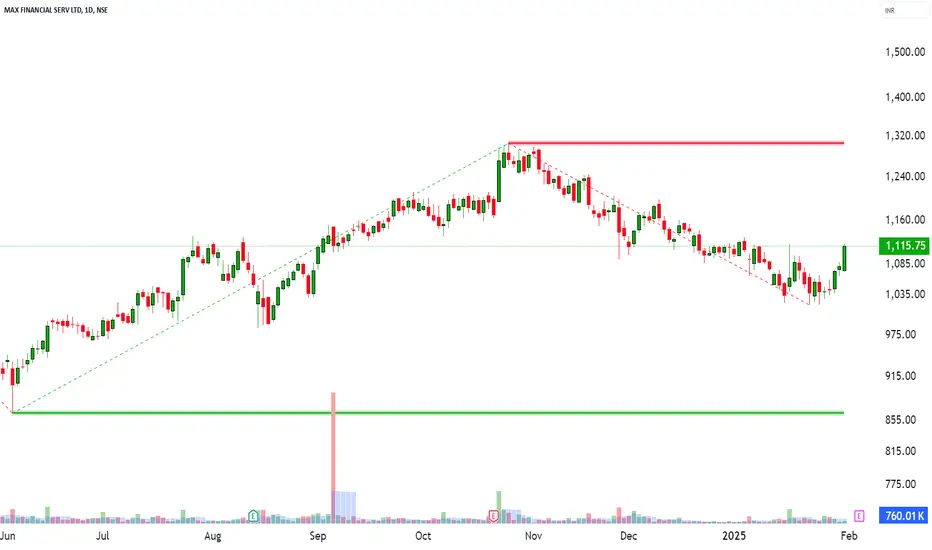
Stock Analysis – Max Financial Services Ltd (MFSL)📅 Date: January 30, 2025
📊 Timeframe: Daily Chart
📌 Market Snapshot
🔹 Change: +34.15 points (+3.16%)
🔹 Volume: 331.73K (Below 20-day avg: 727.74K)(Keep a watch on volume)
🔹 Momentum Indicator: RSI breakout, EMA 200 Crossover
🔹 Strong Bullish Candle (Bullish Marubozu) forming
⚡ Levels to Watch
🔴 Key Resistance Zones (Above Current Price)
🚀 1,135.40 – Immediate hurdle
🚀 1,148.85 – Next breakout zone
🚀 1,177.75 – Major supply area
🟢 Key Support Zones (Below Current Price)
🔻 1,086.85 – Short-term support
🔻 1,057.95 – Key demand zone
🔻 1,041.40 – Strong base
🚀 Conclusion
MFSL is showing strong bullish momentum, backed by an RSI breakout and a 200 EMA crossover.
"Could the price sustaining above recent levels indicate further upward momentum, with a critical support zone in place?"