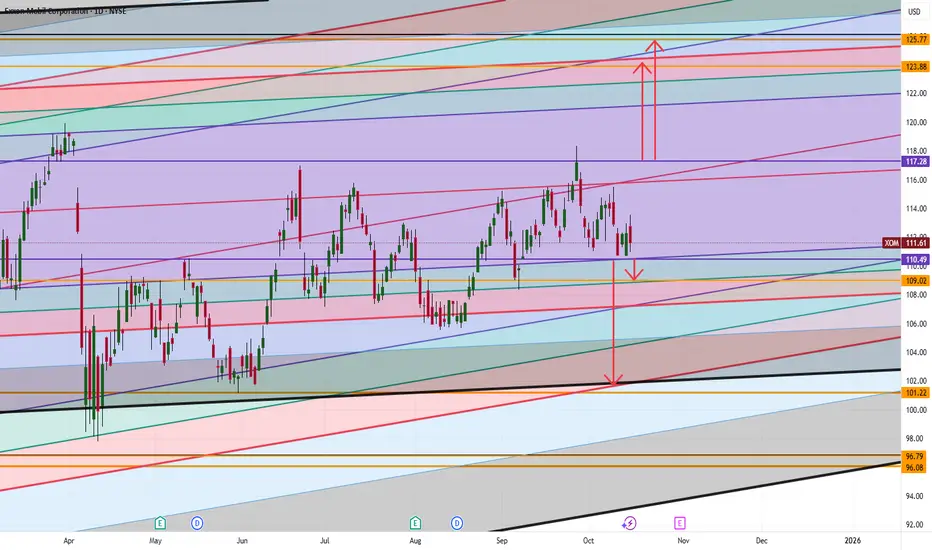
Exxon Mobil (XOM) Simple Market Breakdown!XOM’s sitting at a key level right now; momentum could go either way depending on the next breakout ⚡
Here’s what I’m watching:
📈 If we break above 117.28, that could open the door for a push up toward 123–125; that’s our next major target zone.
📉 But if we drop below 110.49, then we could see a move down toward 109, and possibly even 101 if selling pressure continues.
💡 So, short-term watch those breakout and breakdown levels closely.
Long-term ; whichever side breaks first will likely set the direction for the next big move.
Want to see how I’m tracking these levels and the signals I’m using to confirm the breakout?
💬 DM me “XOM” and I’ll share my private chart breakdown directly.
Energystock
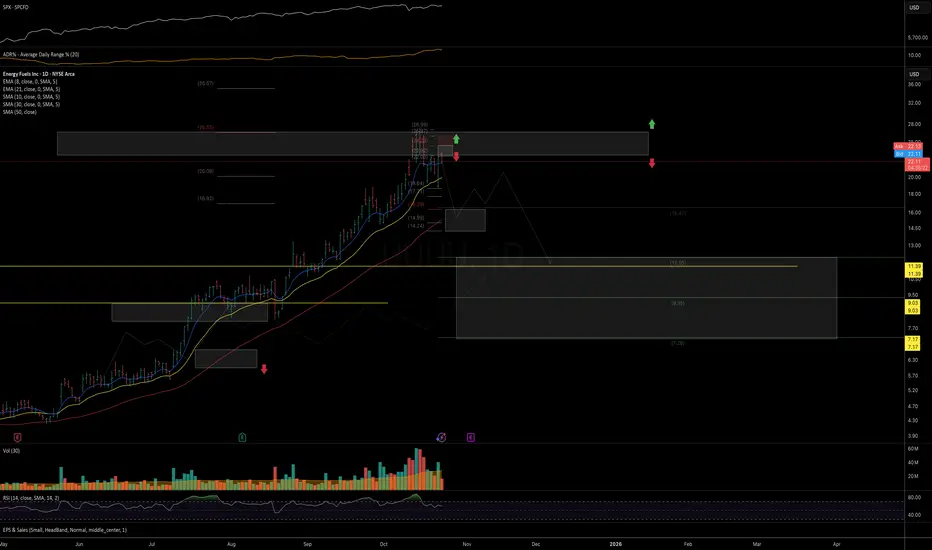
EOSE: macro trend structure Price has reached an important mid-term resistance zone and may be setting up for a pullback and consolidation in the coming weeks.
As long as price remains below 21, I’m watching for further downside toward the 13–10 support zone, followed by a potential base formation before the next swing move higher into the high 30s (possibly in 2026).
Chart:
Macro view:

UUUU expecting more downside As long as price remains within the 24–26 local zone, the odds, in my view, favor a continuation lower in the coming weeks — first toward the 16–14 area and potentially later toward 12.
Chart:
Weekly view:
Previously:
• On upside potential (Jul 16):
Link: www.tradingview.com
• On bullish trend structure (Jun 6):
Link: www.tradingview.com
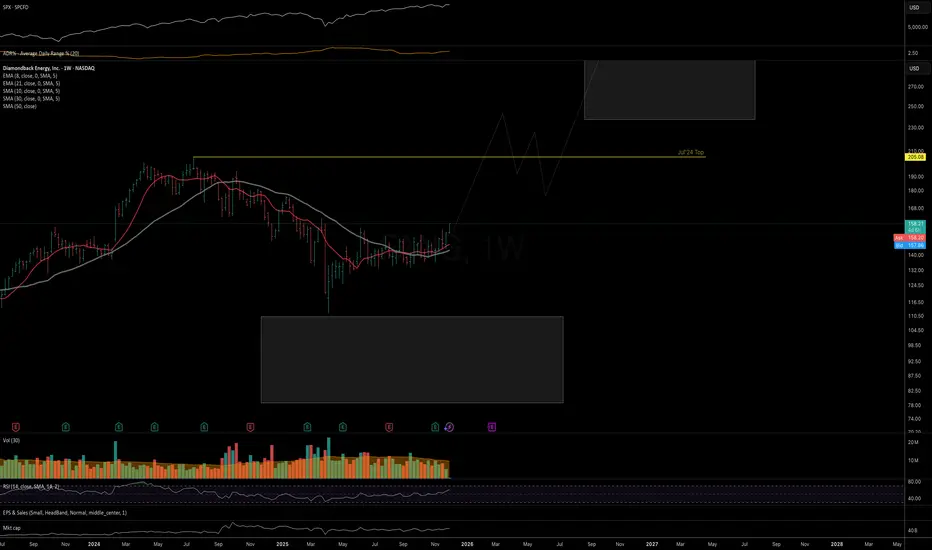
FANG: good looking macro structure Price atempting a breakout from a multi-month consolidation base. The macro trend structure remains strongly bullish into 2026, with 320+ as an ideal long-term resistance target — as long as price continues to hold above the April lows.
Weekly chart:
Macro view:
FLNC: double top potential Price has reached the key macro resistance target and may be forming a potential double top.
As long as price remains below 22, I’m watching for the first leg of downside to unfold toward the 21dEMA, with potential for a deeper move if bearish momentum starts to build.
Chart:
Previously:
• On bullish macro potential (Sep 18):
www.tradingview.com
• On follow-through (Sep 22):
www.tradingview.com

BE: price in important resistance zoneNYSE:BE price is currently trading within an important resistance zone, where a mid-term top formation is likely.
From here, I expect a pullback and consolidation within the 76–56 macro support area before the next potential upside leg toward the 160–190 / 255–310 macro resistance extensions.
Chart (Weekly):
Chart (Macro):

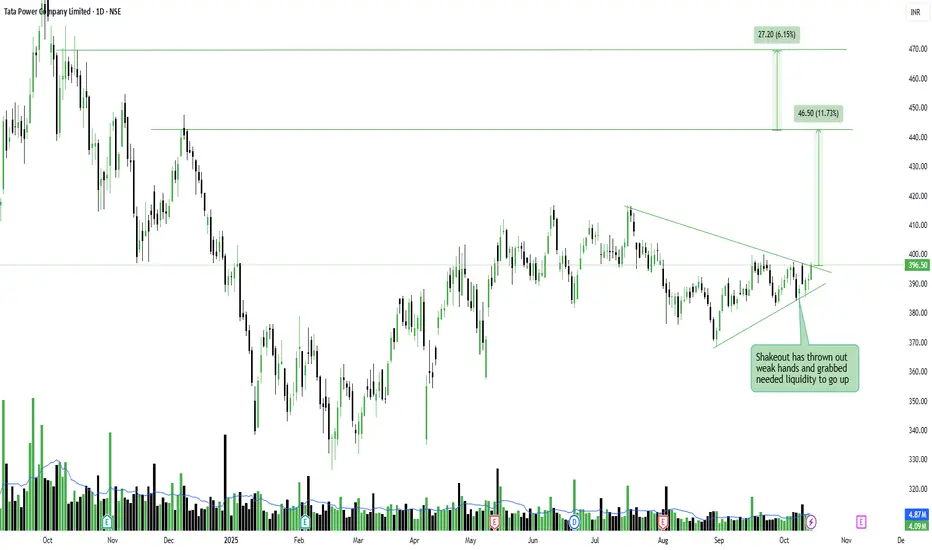
Tata Power – Coiling Tight for a Potential BreakoutTata Power Company Ltd – Coiling Tight for a Potential Breakout
#TATAPOWER
📈 Pattern & Setup:
Tata Power is currently forming a beautiful symmetrical triangle pattern after months of sideways consolidation. The repeated shakeouts near 380 have helped absorb supply, while higher lows over the past few sessions indicate silent accumulation.
The stock is now approaching the tip of the triangle around 398–400, where a decisive breakout with volume could trigger a swift rally toward 440–460 levels. The volume profile is gradually expanding, confirming that quiet accumulation may be taking place under the surface.
📝 Trade Plan:
✍Entry: Above 401 (breakout confirmation)
🚩Stop-Loss: 384 (below recent swing low)
🎯Targets:
Target 1 → 445 (11% potential move)
Target 2 → 470 (17% potential move)
💡 Pyramiding Strategy:
1. Enter with 60% position above 401
2. Add 40% more once price sustains above 410 with volume expansion
3. Trail stop-loss to 392 after price crosses 425
🧠 Logic Behind Selecting this Trade:
This setup represents classic pre-breakout compression, where volatility contracts before expansion. The shakeouts have flushed out weak hands, creating a base of strong holders ready for a momentum move. If volume confirms, Tata Power could lead the next leg in the energy sector rally.
Keep Learning. Keep Earning.
Let’s grow together 📚🎯
🔴Disclaimer:
This analysis is for educational purposes only. Not a buy/sell recommendation. Please do your own research or consult your financial advisor before trading.
NSE:CNXENERGY
FAg / DIAMONDBACK ENERGY / Fractal and Seasonality / LongHave we reached this years bottom yet?
For me it is finding entry at any good price action and in case price droppes I have my reason to add more to the position when price should hit 128 as a low.
Seasonality tells us in PE+1 we are bullish until 26th of November for FANG.
Then rather bearish until 19th of December.
This is for educational purpose only. not a trade call or financial advice.....
Have fun, let's discuss. Comment or write to me in private chat.
Cheers!
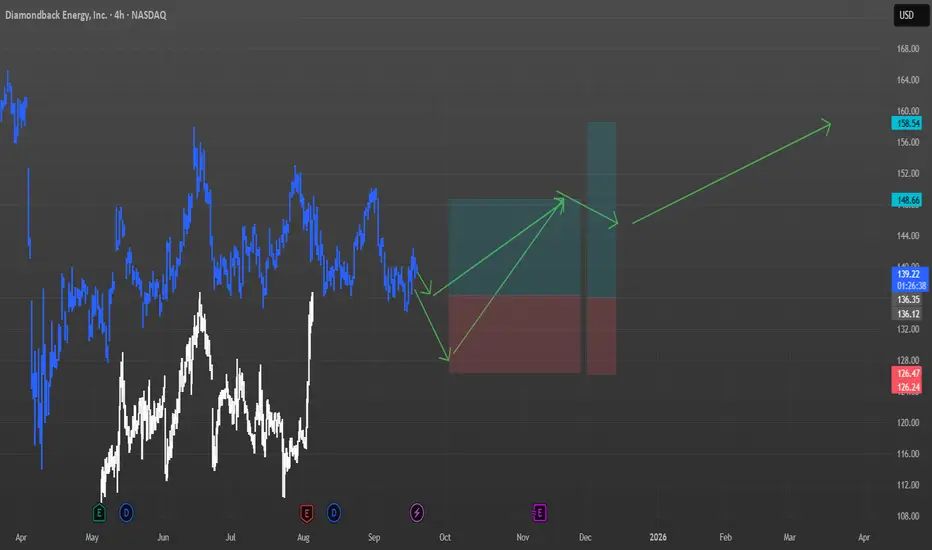
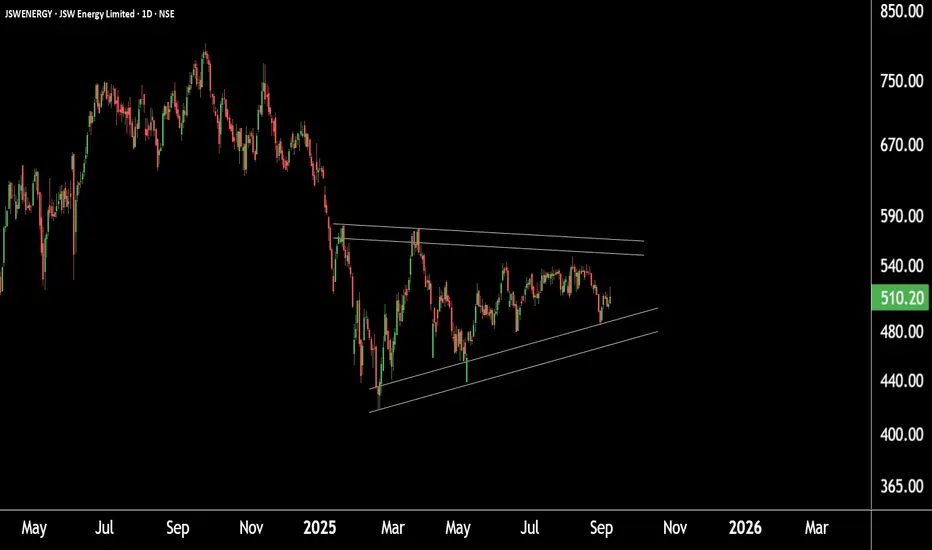
Chart Alert: Major Pattern Formation in JSW EnergyThis is the daily timeframe chart of JSW Energy.
The stock is currently forming a symmetrical triangle pattern with support around ₹465–₹475 and resistance near ₹564–₹570.
If JSW Energy sustains above this resistance zone, it could trigger a breakout, potentially leading to higher price levels in the coming sessions.
Thank you.
News mentions of Nuclear this & Uranium that, whats the Macro?This is a look into the macro developments happening currently in UROY.
This is strictly a TA look into the big picture. We zoom out to Timeframes bigger than 1W.
At times zooming in to check (3 Day, 5 Day, maybe 1D) for potential swing trades.
I tend to look into things like price action, indicators, volume and other data to sway probabilities of where an asset may go and determine best opportunities of supply and demand zones based on my interpretations.
So jumping right in this is a look into price action on the 1 Month timeframe.
Looks to me like a massive macro falling wedge.
But theres massive volume. So thats a little contradicting.
In anycase always look for confirmation of breakouts.
On another negative note: this is only 5 years of data. Would have loved more price data.
Also note potential bullish cross of STOCH RSI, a momentum indicator. Still need confirmation though. If blue and orange line above 20 level on STOCH at monthly candle close.
COuld be a positive.
But key is to watch for confluence of many signs and or indicators.
I will be keeping my eyes on this.
Look for more posts as things develop on UROY.
DISCLAIMER: This is not financial advice, i am not a financial advisor. The thoughts expressed in the posts are my opinion and for educational purposes. Do not use my ideas for the basis of your trading strategy, make sure to work out your own strategy and when trading always spend majority of your time on risk management strategy.

Natural Gas Crisis: Profits were made!Nat Gas plunged to a 1-week low Monday on the outlook for cooler US temperatures.
A report came out that Nat gas has heat peak demand which is scaring investors.
Nat GAs equities got demolished which could indicate that this breakdown is real.
We got rejected off the daily 50 MA & Knifed through the 200 Daily MA.
Some clear technical breakdowns are now in affect.
We banked on EQT put options that ran over 400%. This trade was called out free on our channel. You tube Short.

ADANI GREEN ENERGY Ready to FIRE ( LONG TERM IDEA ) !!!Weekly counts for ADANI Green Energy are recommended, with a bullish wave structure.
Both appear to be optimistic, and this stock's invalidation number is 758.
Investing in declines is a smart move for long-term players.
Long-term investors prepare for strong returns over the next two to five years.
The energy sector has a promising future.
Every graphic / chart used to comprehend the theory of elliot waves, harmonic waves, gann theory, and time theory
Every chart is for educational purposes.
We have no accountability for profit or loss.

Centrus Energy corp. Gann chartThe symmetry on this chart is just so clean. I would watch out for the next resistance (arc).
L

Defensive Sector with Growth PotentialSupporting Arguments
Current Market Uncertainty Sustains Demand for the Defensive Sector. NEE represents the defensive utility sector. Given the current political and economic uncertainty in the market, there could be an additional catalyst for the company's stock price growth.
Demand for Green Energy from the IT Sector. More than 80% of the company's portfolio consists of renewable energy sources (RES). Demand from data centers in the IT sector may allow the company to outperform competitors.
Attractive Valuation Levels and Technical Outlook
Investment Thesis
NextEra Energy (NEE) has strong long-term growth prospects due to the increasing demand for RES and the electrification of various sectors. Their integrated business model, combining the regulated utility business FPL and the competitive renewable energy business NEER, ensures both stability and growth opportunities. NEE's leadership in RES production, along with investments in battery energy storage and gas infrastructure, allows the company to benefit from the growing demand for clean energy solutions.
Current Market Uncertainty Could Drive Stock Price Growth. Tariffs imposed by the administration on imports and their potential impact on the U.S. economy remain in investors' focus. The market has responded to high uncertainty with a significant correction in overheated sectors, and pressure may persist for some time. As a representative of the utility sector, NEE benefits from uncertainty and may continue its growth.
Demand for Green Energy from the IT Sector. The largest public companies continue to increase capital expenditures on AI infrastructure to stay competitive. A key component of such infrastructure is data centers, which consume large amounts of energy and contribute to increased environmental pollution. As a result, data center owners create strong demand for companies that provide access to RES. More than 80% of the company’s portfolio consists of renewable energy sources. Already, the company’s annual profit growth rate is twice as high as that of its competitors.
Attractive Valuation Levels and Technical Outlook. The company's stock is trading at the 200-day moving average and recently rebounded from the resistance line at the 50-day moving average, which could serve as a strong catalyst for movement toward the previous peak of $84.8. Based on the forward PEG ratio, the company is trading at about the same level as companies engaged in traditional energy sources for household supply, while maintaining profitability 5-15% higher than competitors. Based on the forward P/E ratio, the company appears cheaper than its closest direct competitors (18x vs. 20.5x).
Our target price is $82, with a "Buy" recommendation. We recommend setting a stop-loss at $64

$NNE longNNE is in a channel right now, but basic support has formed, with a sucessful bounce. Besides the TA, the company in general has quite a bit to offer.

JinkoSolar: Defying Downgrade,Aiming for Bullish MomentumJinkoSolar Holding Co., Ltd. ( NYSE:JKS ) has recently been downgraded by Daiwa Securities from " Underperform " to " Sell ," with a revised price target of $20 .
Despite this downgrade, the stock has demonstrated bullish momentum, with a mid-term target of $33.42.
Notably, JinkoSolar's Relative Strength (RS) Rating has improved, rising from 71 to 82 , indicating that the stock is outperforming a majority of stocks in terms of price movement over the past 52 weeks.
Additionally, China's solar sector is showing signs of recovery, with increases in polysilicon prices and potential growth in renewable energy markets in Southeast Asia and India.
In conclusion, while the recent downgrade by Daiwa Securities reflects certain concerns, the stock's bullish momentum and improving technical indicators suggest potential upside, with a mid-term target of $33.42 .

Energy Stock Surge? ENI S.P.A Bullish Breakout IncomingENI S.P.A, a leading global oil company, is currently trading at $14.18 , demonstrating strong bullish momentum on the weekly chart. Our proprietary W.ARITAs indicator reveals a significant buildup in bullish momentum, suggesting an imminent breakout from the well-defined inverted head and shoulders pattern .
This pattern, widely recognized as a reversal signal, aligns with ENI’s recent strategic moves, including its expansion in Alaska and increased shareholder rewards through a $2 billion share buyback . These developments underscore the company’s robust financial health and its commitment to growth and investor value, which are likely to fuel further stock appreciation.
Key Technical Levels:
Order Box (OB) Target 1: $18.05 - $19.62
Order Box (OB) Target 2: $23.18 - $24.29
Given the current bullish setup, these targets reflect potential zones for profit-taking, with the first Order Box (OB Target 1) offering a conservative target range and OB Target 2 representing an extended bullish goal.
With supportive corporate actions and technical strength, ENI is well-positioned for growth, making it a compelling opportunity for investors seeking exposure in the energy sector. Keep an eye on the weekly close to confirm the breakout from the inverted head and shoulders pattern for confirmation of further upside potential.
Disclaimer: This analysis is for informational purposes only and should not be considered as financial advice. Investing in stocks involves risk, and past performance does not guarantee future results. Please consult a financial advisor to assess your individual risk tolerance and objectives before making any investment decisions.

Trade Idea | COP | ConocoPhillips | LongLong Entry: 107.50
Stop Loss: 104.50
We are long on this one for now as oil and its peers are starting to advance due to the increasing tension in Middle East. USO is now at $72.11 and might be at $75.00 before this week ends, if no visible peace talks between each countries.
If the momentum to the upside sets in, COP might be able to test the $115 level in no time. If that happens, moving the stop to $110.00, which is now above the entry price is highly recommended to somehow protect the floating gain.
I will stay long on this one as long as the narrative on this situation stays the same.
-BB

SUZLON Stock 780% Profit So Far! MASSIVE!What a beauty.
The only problem is, people have less patience to trade or invest in equity.
People with patience and big money always trade in Equity.
Thank you SUZLON! This was my under dog in 2023, but holding for 1+ years really paid off.
Had bought around 9-10 average price.
Nice catch.

Kamala Leads, Solar Stocks Shine Again?I'm closely watching the solar sector again, especially stocks like NASDAQ:FSLR , NASDAQ:ENPH , and $RUN.
After the Trump/Biden debate, solar stocks plummeted because it looked like Trump might win. But now, with Kamala Harris running, the odds have shifted her way, and I'm optimistic about the sector since she's likely to support clean energy like Biden did.
These solar stocks have been stable over the last month compared to tech.
First Solar has strong financials, Enphase has solid earnings and big potential, and Sunrun just teamed up with Tesla.
Definitely worth watching all three, in my opinion.

$CELH great R/RDespite the indicators showing a downtrend in the stock, I believe that the risk/reward ratio for NASDAQ:CELH is quite favourable.
Why? The risk is mostly mitigated; even if the company reports less-than-stellar results, this is already factored into the price.
However, if it does report even slightly better than anticipated results, we might witness a rally.
Take note of the bullish divergence between the price and the MACD-Histogram.
What are your thoughts? Do you anticipate further decline or a potential bounce from this point?"

CHENNPETRO CHANNEL MOVEMENTNSE:CHENNPETRO pattern chart pattern observation in 2024. High Volume breakouts leading to all-time highs followed by retracement and support at the bottom of the channel. Overall channel movement is in the upward direction. Possible dip for the next ATH?
Disclosure: I am not SEBI registered. The information provided here is for educational purposes only. Consult your financial advisor before making any decisions. Study is neither advice nor endorsement.

DANA GAS_ Next Target is Wedge Pattern Top, Achieve +99% PROFIT DANA GAS PJSC is forming a Wedge Pattern. The Next Target is the Wedge Pattern Top, Offering a chance to Achieve a +99% PROFIT. A Breakout is expected in the market once this wedge pattern is reached. This is Long-Term Analysis, must follow the Trend Continuation Technique. Guess the 2nd Target ?????
Support me; I want to Help People Make PROFIT all over the "World".
