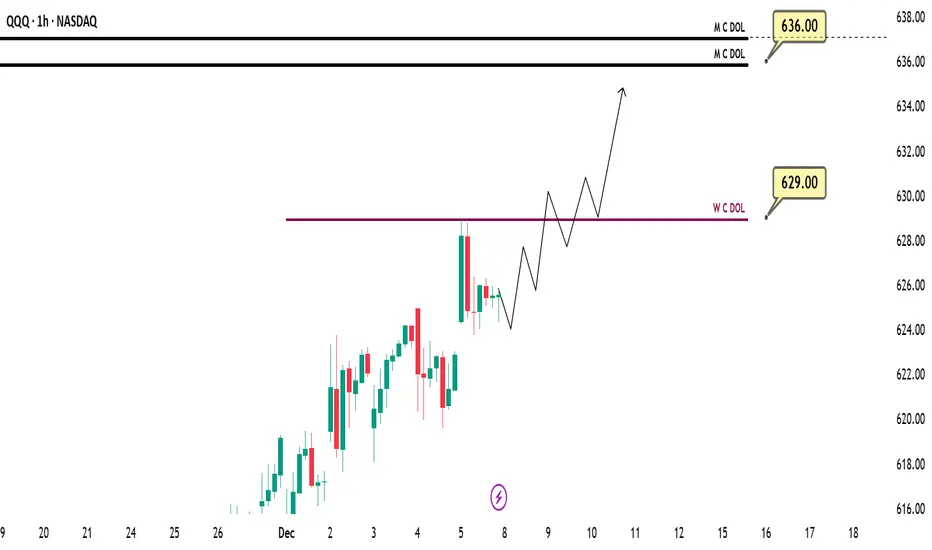
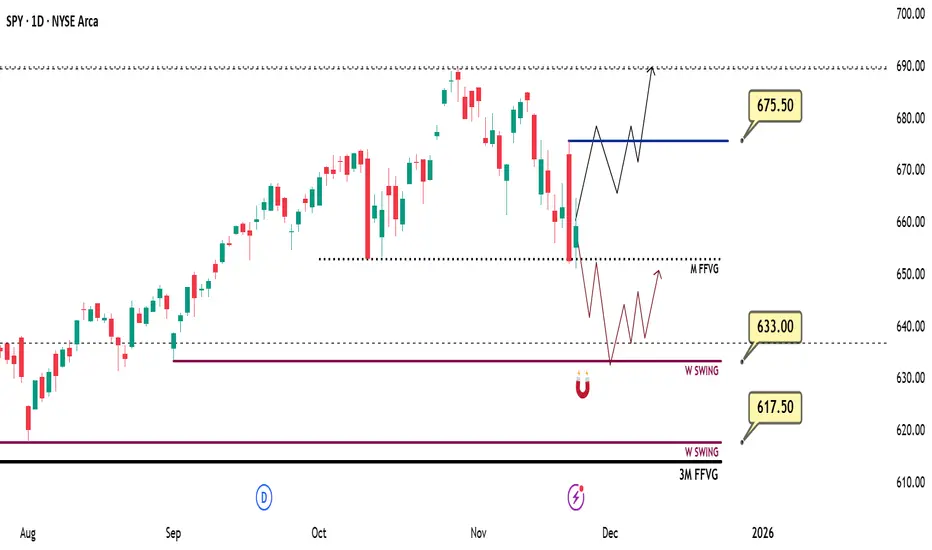
SPY (ES-US500-SPX) Weekly Prediction – Outlook (21 DEC)SPY (ES-US500-SPX) Weekly Prediction – Outlook (21 DEC)
📊 Market Sentiment
Market sentiment turned fully bullish after the CPI data came in significantly lower than expected on Thursday. While the expectation was 3.1%, the actual CPI print came at 2.7%, which was a meaningful downside surprise.
This data does not directly determine the outcome of the January FED meeting, as another CPI report will be released on January 13, 2026, which will be far more critical for the FED’s decision making process. However, the current soft inflation trend increased the probability of another lower CPI reading in January, which positively impacted risk sentiment across markets.
📈 Technical Analysis
In my previous SPY analysis last week, I clearly outlined the expectation of an early week pullback followed by a precise reversal level. That scenario played out exactly as anticipated.
Following the CPI release, price completed its reversal and closed the week with very strong bullish price action on Friday. In my opinion, this behavior suggests that the corrective phase has likely ended and price is now preparing for continuation to the upside.
📌 Game Plan
I think price may target the 683.5 level early in the week.
For call options and long positions, the key lower timeframe reaction zones I will be monitoring are 678.25 and 675.25.
If price rallies directly toward 683.5, I plan to sell the majority of my existing call positions around that level. However, if price first tests 678.25 or 675.25 before reaching 683.5, I am considering adding additional call exposure from those zones.
That said, my decision to enter will strongly depend on 1H and 4H candle closes. I will not enter positions in a market that simply breaks through these levels. If price tests these zones and prints strong bullish 1H or 4H closes, that is when I will begin executing call option entries.
💬 For deeper sentiment and strategy insights, subscribe to my Substack free access available.
This analysis is for educational purposes only and does not constitute financial advice. Always conduct your own research before trading or investing.
Es!

XAUUSD Daily – Five-Wave Impulse Toward 4,530On the XAUUSD daily chart I’m tracking a potential five-wave advance within the existing uptrend.
Wave (1)** marks the initial impulsive leg higher from trendline support
Wave (2)** is the corrective pullback that holds above the origin of wave (1) and respects the rising trendline
Wave (3)** extends beyond the wave
(1) high, confirming continuation of the bullish structure and establishing a new swing high.
* Price is now correcting as **wave (4)** back into the area of:
* the rising trendline drawn from prior lows, and
* the former consolidation / breakout zone around the previous highs.
While price holds above the wave (4) low and the trendline, I’m anticipating a continuation leg to the upside as **wave (5)**.
The projected wave (5) objective is around 4,527, where I have a confluence of measured extension and overhead resistance.
A decisive daily close below the wave (4) low and trendline support would invalidate this wave count and delay the bullish scenario.

ES for the Holiday WeekLooking at ES for the holiday week it seems generally bullish. After bouncing off this weekly support they seem to be targeting this untested daily level at 6907. There is also the 4hr sitting at 6912. Confluence of these levels being so close together makes me think they are targeting this area. If they continue to push with momentum 6942 is in play to attack those previous highs.
Trend plotted by TrenVantage LITE
Trades plotted by BreakPoint LITE

NQ for Christmas WeekNot entirely sure what will happen this week but volume will be odd over the holidays.
Would not expect this 200 point move, however after the most recent bounce off that weekly level it would make sense for this trend to continue.
Yellow levels are weekly. Orange level is most relevant 4hr level
BreakPoint LITE plotted the buy signal
TrenVantage LITE plotted the trends
Levels derived from TrenVantage TRADER pro indicator.

WEEKLY QQQ (NQ-US100-USTECH) Outlook - Prediction (14 DEC)WEEKLY QQQ (NQ-US100-USTECH) Outlook - Prediction (14 DEC)
📊 Market Sentiment
Market sentiment has turned slightly bullish again following the FED’s rate cut decision. We saw the market react quickly after Powell’s speech. QE has restarted, and the FED stated it will buy $40 billion of Treasury bills over the next 30 days. This narrative supports the bullish case; however, $40B is relatively small compared to the overall size of the U.S. market.
At the same time, the bearish narrative is strengthening. Powell stated that “rates are now in a plausible range of neutral,” and the FED emphasized that it will assess incoming data until the January meeting. No decision has been made for January yet.
This keeps the market in a state of uncertainty and when the market lacks a clear narrative, it often turns bearish. Keep this in mind.
📈 Technical Analysis
QQQ hit the 629 level, as I pointed out last week. I am linking last week’s QQQ prediction below for reference.
Price ran the 629 level but could not close above it. After that, we saw selling pressure due to SPY and YM hitting all time highs and getting rejected. QQQ was the weaker index last week, which explains why we did not expand as much as SPY and why QQQ failed to reach all time highs.
I believe the expansion higher will resume, but first price needs to gather more energy before continuing upward.
📌 Prediction – Outlook
I am tracking three different scenarios:
Scenario 1 (Black Line) – Bullish:
Price runs the 610.5 level and closes above it. If this occurs, I will be buying calls, targeting 617.5 first, with a runner for higher levels.
Scenario 2 (Orange Line):
Price retraces to 610.5 and closes below, creating a deeper pullback. Price then reaches 605.5 and closes back above it. This would likely initiate bullish momentum.
In this case, I would be buying calls, targeting 610.5 first and 617.5 as the second target.
Scenario 3 (Red Line) – Bearish:
Price retraces to 610.5 and aggressively closes below. Price then continues lower toward 597.5 without showing strength.
If price later closes back above 597.5, I will look to buy calls.
Initial profit targets would be 605.5 and 610.5.
💬 For detailed insights and broader market context, please check my Substack link in profile.
For educational purposes only. This is not financial advice.

WEEKLY SPY (ES-SP500-SPX-US500) Outlook - Prediction (14 DEC)WEEKLY SPY (SP500-SPX-US500) Outlook - Prediction (14 DEC)
📊 Market Sentiment
Market sentiment has turned slightly bullish again following the FED’s rate cut decision. We saw the market react quickly after Powell’s speech. QE has restarted, and the FED stated it will buy $40 billion of Treasury bills over the next 30 days. This narrative supports the bullish case; however, $40B is relatively small when compared to the overall size of the U.S. market.
At the same time, the bearish narrative is strengthening. Powell stated that “rates are now in a plausible range of neutral,” and the FED emphasized that it will assess incoming data until the January meeting. No decision has been made for January yet.
This keeps the market in a state of uncertainty and when the market lacks a clear narrative, it often turns bearish. Keep this in mind.
📈 Technical Analysis
Price ran the 690 level and printed another all time high, which I highlighted in last week’s prediction (see the linked idea below). However, although price tagged 690, it failed to close above it, and we saw a strong rejection.
This reaction is a textbook example of a range deviation model. When price cannot close above a key level, it often seeks lower prices to gather liquidity and energy for continuation.
📌Prediction – Game Plan
There are two scenarios I am monitoring:
Scenario 1 (Black Scenario) – Bullish:
Price targets the 678.75 level and runs that swing but fails to close below or closes back above 678.75. This would indicate that price has collected sufficient liquidity to expand higher.
In this case, I will be buying calls, taking partial profits at 684.25, and letting the remainder run toward all time highs.
Scenario 2 (Red Scenario) – Bearish:
Price aggressively breaks 678.75 and closes below it on a 4H candle. In that case, I will look to buy puts around 678.75 if price provides a retest.
My first target will be 670, followed by 660.5.
The 670 level may act as a reversal zone for SPY. If we tap this level and see a daily close above 670, I will consider that price is attempting to seek higher levels again.
💬 For detailed insights and broader market context, please check my Substack link in profile.
For educational purposes only. This is not financial advice.

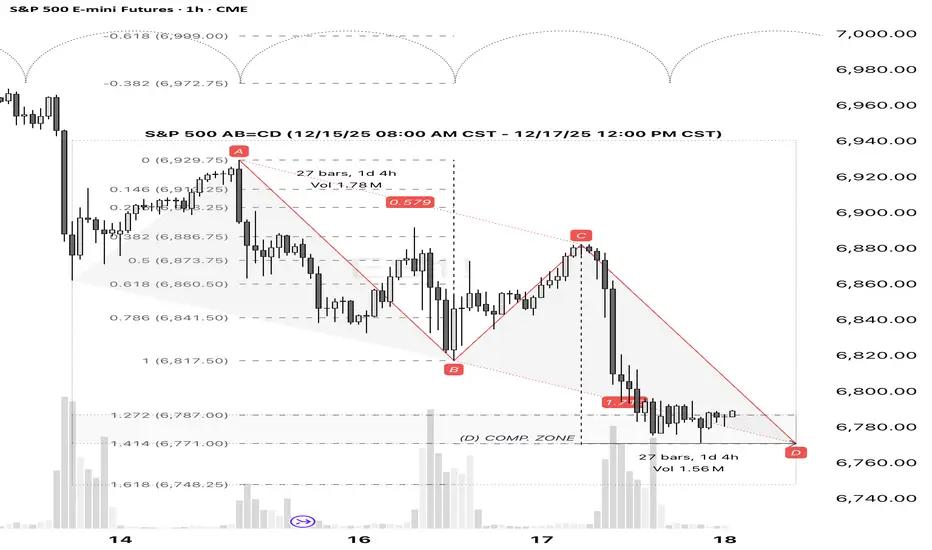
SPX: AB=CD Pattern Completion Suggests Long SetupS&P 500 (SPX) - Technical Analysis: Bullish Reversal Signal at AB=CD Completion
1. Pattern Recognition:
A classic bullish AB=CD harmonic pattern has reached its precise completion point (D). This validates the designated support zone as a significant technical area where buyer momentum is anticipated to overcome recent selling pressure.
2. Market Structure Implications:
The successful completion of this pattern suggests:
· The establishment of a firm, technically-defined support level.
· Exhaustion of the prior downward (CD) leg.
· An increased probability of a mean-reversion move higher, targeting a retracement of the recent decline.
3. Trade Thesis & Risk Management:
The confluence at the D point presents a favorable risk/reward opportunity for a long position.
· Action: Initiate long positions.
· Entry Zone: At or near the pattern's D completion point.
· Invalidation Level: A decisive close below the D point invalidates the pattern structure. Place stop loss accordingly.
· Primary Target: The 0.618 Fibonacci retracement of the CD leg.
· Secondary Target: The initiation point (C) of the pattern.
#EURUSD , Risky Setup📌 Market Insight: {#EURUSD }
⚠️ Risk Assessment: {High}
🚀 Approach:
Not a Quality setup at all ... need VALID LTF entry sign first. ... shouldn't go to Edge and then back up .... QuickScalp setup
#Ash_TheTrader #Forex #GBPJPY #MarketAnalysis #TradingSetup #RiskManagement #GOLD #Scalper #NQ #EURUSD

From Shutdown Relief to AI Anxiety — Two Narratives Driving ESMarket Theme
The week began on a strong footing, driven by a bullish Sunday reopen in ES after news broke that the 43-day government shutdown was set to end, following the Senate’s late-night support for a potential agreement on November 9th. This relief catalyst created early upside momentum, pushing the index toward all-time highs (ATHs).
However, the tone shifted mid-week. The rally lost steam as markets refocused on a growing concern: the sustainability of current Tech and AI valuations. Investors are becoming more sensitive to the possibility of overstretched AI-related capital expenditure and an emerging bubble narrative, especially with heavyweight earnings and forward-guidance looming. This led to a rotation out of high-beta tech and into safer or less-extended sectors.
On the macro front, Fed speakers adopted a more cautious—if not outright hawkish—tone, emphasizing that a December rate cut is far from assured. The recent government shutdown created a backlog in key economic data releases, leaving policymakers and traders alike without clear visibility into the true state of the economy. The lack of data has amplified uncertainty and reduced the market’s conviction around the timing of any potential policy easing.
In short:
The market is caught between two opposing forces:
The optimistic narrative (shutdown resolved, path to ATHs, resilience in U.S. growth), and
The risk narrative (valuation excess, policy uncertainty, narrowing breadth).
This push-pull dynamic has resulted in compression rather than continuation, with a heavy focus on clarity from upcoming data and major earnings.
What is the Market Doing?
Last week formed an inside week, with the entire range trading within the prior week’s range and settling close to the previous week’s close. This signals indecision and balance, as neither buyers nor sellers had the conviction to push the market into expansion.
Current price action shows the market compressing between:
6875 — previous week’s VPOC / 27 Oct weekly VAL
6740— 13 Oct weekly VAH / 10 Nov weekly volume ledge
These levels are well-defined and respected. The upward trendline continues to hold, with multiple strong rejections signaling responsive buyers stepping in to bid prices back up.
The battle is now between buyers attempting to defend 6740 area which is also confluent with the daily trendline support, and sellers leaning on the overhead resistance close to 6875.
What to Expect in the Coming Week
The key line in the sand (LIS) this week:
→ 6755.25 — Previous week's settlement
Bullish Scenario
If 6755 holds as support, expect buyers to attempt a push toward:
6874.50 — previous week's VPOC
6905.5— weekly 1-SD volatility high
Anticipate responsive sellers in this area.
However, if price breaks above 6874.50 with pace and volume and accepts above it, the path opens for a retest of the ATHs as momentum players and trapped shorts fuel continuation.
Bearish Scenario
If the market accepts below 6755 and fails to reclaim it on any pullback:
First downside target: 6660 — 13 Oct weekly VAL
If buyers fail to respond there, expect an acceleration lower from long liquidation toward:
6605— weekly 1-SD volatility low
6504 — previous month's low (deeper target)
This scenario strengthens if the trendline breaks and sellers begin stepping down aggressively.
Neutral / Compression Scenario
If the market remains trapped between 6875 and 6740 with no breakout supported by pace and volume:
Expect two-way rotational trade
Continued compression and balance within the well-defined range
A buildup of energy that may resolve later in the week with data, earnings or fundamental catalysts
Conclusion
As we start the new week, ES remains tightly coiled between well-defined levels, with the market waiting for clarity from data, earnings, and policy signals. Whether we break from compression or continue to balance, the key will be how buyers and sellers respond around 6755 and whether there are new fundamental catalysts.
As always, I’d love to hear your view on the markets and ES this week? — Drop it below — and give it a boost so more of the community can join the conversation.
Glossary Index for all technical terms used:
VAH (Value Area High)
VAL (Value Area Low)
VPOC (Volume Point of Control)
SD (Standard Deviation)

QQQ (US100 – USTECH – NQ) WEEKLY PREDICTION - (08 DEC)QQQ (US100 – USTECH – NQ) WEEKLY PREDICTION
📊 Market Sentiment
Market sentiment remains bullish, supported by expectations of a potential FED rate cut in December.
Additionally, Trump’s likely nominee for the next FED Chair Kevin Hassett, a strong advocate of aggressive rate cuts has strengthened this bullish outlook.
Markets have already begun pricing in the possibility of earlier and more aggressive cuts throughout 2026, fueling continued upside momentum.
📈 Technical Analysis
QQQ is strongly bullish at the moment.
In my opinion, as long as SPY continues pushing toward all time highs, QQQ is unlikely to experience any meaningful retracement.
📌 Game Plan – Prediction
I expect QQQ to reach 629 this week at minimum.
A strong move may occur right after the market opens however, since the FED decision will be released on Wednesday, the early part of the week may show some choppy or ranging price action.
💬 For deeper sentiment and strategy insights, subscribe to my Substack free access available.
⚠️This analysis is for educational purposes only and does not constitute financial advice. Always conduct your own research before trading or investing.
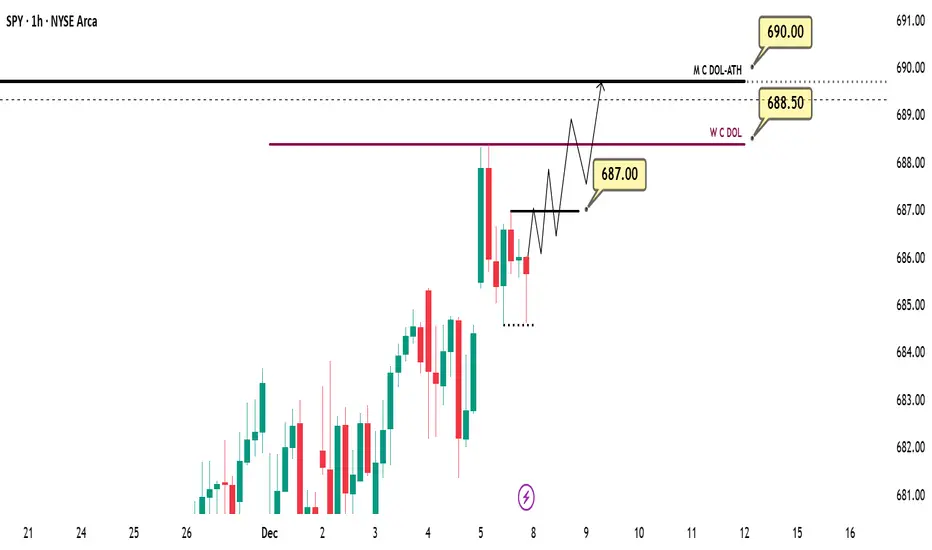
SPY (US500–SP500–SPX) WEEKLY PREDICTION (08 DEC)SPY (US500 – SP500 – SPX) WEEKLY PREDICTION
📊 Market Sentiment
Market sentiment remains bullish, supported by expectations of a potential FED rate cut in December.
Additionally, Trump’s likely nominee for the next FED Chair Kevin Hassett, a strong advocate of aggressive rate cuts has strengthened this bullish outlook.
Markets have already begun pricing in the possibility of earlier and more aggressive cuts throughout 2026, fueling upward momentum.
📈 Technical Analysis
SPY remains strongly bullish and is currently targeting new all time highs.
In my opinion, during this type of price behavior, I do not expect a deep retracement before the market attempts to run the previous highs.
📌 Game Plan – Prediction
I expect SPY to either push directly into new all time highs or consolidate until Wednesday’s FED decision.
If I see a strong daily close above 687, I plan to buy the retracement into 685, targeting:
First target: 688.5
Second target: All-time highs around 690
💬 For deeper sentiment and strategy insights, subscribe to my Substack free access available.
⚠️ This analysis is for educational purposes only and does not constitute financial advice. Always conduct your own research before trading or investing.
WEEKLY WARMAP: DOLLAR MARKETThe week begins with a balanced dollar, firm U.S. yields, and suppressed volatility.
DXY remains inside its 97.672–99.985 range, reflecting equilibrium rather than trend.
No directional signal is valid until structure breaks.
Short-end yields moved ~2.8% higher last week and extended another ~0.76% into Monday’s session.
The 10-year yield advanced ~2.88% last week with further upside today.
The curve is repricing risk while volatility remains suppressed following a ~16.6% decline.
This week’s macro catalysts:
FOMC decision + Powell press conference
JOLTS labor demand data
PPI
Weekly jobless claims
Federal budget and projections
All influence: credibility, yield expectations, liquidity conditions.
Cross-asset behavior remains neutral.
ES stays inside its 6540.25–6953.75 bracket — strong order flow but extended location near the monthly upper boundary and roughly +2 deviations above the mean.
Gold remains inside its 3996.2–4380.7 weekly range.
Key DXY levels:
98.175 — downside liquidity
98.917 — upside structural trigger
Inside this band = non-directional behavior.
Outside = actionable change.
The overall environment reflects structural tension, not directional conviction.
TECHNICAL CONTEXT (CORE5 STRUCTURE)
DXY trades only 0.11% from monthly balance, creating conditions for algorithmic defense at key price boundaries.
The current question:
rotation or continuation?
Price remains inside its daily range (97.672–99.985).
Structure is balanced, but location matters:
DXY sits within the dynamic discount zone on the DGM model
This typically supports accumulation
But there is a bullish volume cap beneath price — an unfinished orderflow pocket resembling a bookkeeping discrepancy
This imbalance often requires a downward corrective spike before any sustained upward movement.
If bearish flow develops:
Liquidity sits cleanly below 98.175 and may be targeted before stabilization.
If bullish flow emerges:
A daily close above 98.917 is required to confirm shift.
Anything below this level is intra-range noise.
Current read:
Structure: balanced
Geometry: supportive zone
Volume: incomplete
Order flow: neutral, awaiting data
Execution: conditional environment, not trend environment
This week’s direction depends on how DXY responds to the incoming data sequence.
WEEKLY TAKEAWAY
Two levels govern the week:
98.175 → downside liquidity
98.917 → upside structural trigger
Inside the band: neutral.
Outside the band: decisive.
— CORE5DAN
Institutional Logic. Modern Technology. Real Freedom.

Weekly US Market Outlook – SPY, QQQ, DXY, VIX (30 NOV)Weekly US Market Outlook – SPY, QQQ, DXY, VIX
Bullet points:
Market sentiment turned bullish again as the probability of a December Fed rate cut climbed to 87%.
Fear & Greed Index recovered from extreme fear (9) to 24.
Options sentiment still signals extreme fear → room for upside continuation.
DXY remains bearish until 99, supporting risk assets.
VIX continues to decline toward 15.70–14.20, but these levels historically precede sharp corrections.
Heavy data week ahead (ADP, Jobless Claims, PCE) → major volatility drivers.
SPY targets 690 → 700 zone; QQQ targets 625 → 637 → 647.5.
Market Sentiment
Market sentiment has shifted decisively toward a bullish stance after the probability of a December rate cut surged back to 86%. Markets are now pricing in one more cut before 2026, creating a supportive macro backdrop for equities. At the same time, the Fear & Greed Index has rebounded from extreme fear levels of 9 to 24, indicating a slow but clear improvement in risk appetite.
Stronger than expected earnings from NVDA continue to reinforce the narrative that the AI cycle is intact and far from bubble conditions. Additionally, easing geopolitical tensions specifically the US–China trade agreement have reduced risk premia across global markets. Taken together, these developments support a short to mid term bullish environment and increase the likelihood of a Santa Rally.
Options Sentiment
Despite improving market sentiment, options markets remain deeply positioned in the extreme fear zone. This divergence between spot indices and options positioning typically suggests that market participants remain hedged or underexposed, allowing equities to extend higher as positioning normalizes. In other words, options sentiment indicates there is still significant room for markets to explore higher price levels.
DXY – US Dollar Index
Monitoring the DXY is essential because of its direct correlation with risk assets. A rising dollar weighs on equities, while a declining dollar supports them. The DXY was rejected at the 100.30 level and is now retracing toward the HTF Key Zone, highlighted around 99.
My base case is a move down into the 99 region, followed by short term accumulation and a potential bounce back above this level. Until DXY reaches 99, the trend remains bearish, which historically provides strong support for equities, commodities, and other USD sensitive assets.
VIX – Volatility Index
VIX, which reflects S&P 500 options based volatility expectations, has been declining since the November 21 peak, which aligned with the recent local bottom in the S&P 500. I expect VIX to continue trending lower toward 15.70 and potentially 14.20 levels previously associated with S&P 500 all time highs.
However, it is crucial to note that when VIX reaches these zones, markets often experience rapid and unexpected corrections. Therefore, while volatility compression favors short-term bullish continuation, the risk of a sharp reversal increases as VIX approaches these historically significant thresholds.
Upcoming Data Releases
A high-impact macro week is ahead, especially between Wednesday and Friday. The key releases include:
ISM Manufacturing PMI – Monday
JOLTS Job Openings – Tuesday
ADP Nonfarm Employment – Wednesday
Services PMI – Wednesday
ISM Non-Manufacturing PMI – Wednesday
Initial Jobless Claims – Thursday
PCE Inflation (September, delayed) – Friday
Michigan Consumer Sentiment – Friday
The most influential dataset will be the combination of ADP Employment, Initial Jobless Claims, and PCE Inflation. If labor data comes in stronger than expected, the Fed may interpret it as a sign of a resilient labor market reducing the need for additional cuts. Conversely, if PCE inflation comes in hotter than expected, policymakers may see it as a reason to delay cuts.
Given that this PCE print is delayed due to the U.S. government shutdown, the market reaction may be muted, but it still matters for the December policy narrative.
SPY Weekly Outlook – Prediction
In my opinion, SPY is positioned to target new all time highs early in the week. Price may first test 686, followed by a brief retracement or consolidation, and then continue higher toward 690, marking a fresh ATH. Under strong bullish momentum, SPY may extend into the 700 zone by the end of the week. These levels represent the primary upside targets I will be monitoring closely.
QQQ Weekly Outlook – Prediction
QQQ remains structurally weaker than SPY, yet it also maintains strong bullish momentum. The 617 level is a key zone for potential call entries. Price may initially target 625, where a short term rejection could occur, followed by a small pullback. Afterward, QQQ could advance toward its all time high at 637, and in a stronger continuation scenario, possibly extend to 647.5.
Conclusion
Overall, market conditions have turned constructive again. Sentiment is stabilizing, central bank expectations are supportive, volatility is compressing, and the dollar remains weak all providing a tailwind for equities. This week’s heavy macro calendar may bring volatility spikes, but unless data significantly challenges the rate cut narrative, both SPY and QQQ appear positioned to continue their upward trajectory toward new highs.
⚠️ This analysis is for educational purposes only and does not constitute financial advice. Always conduct your own research before trading or investing.

#ES_F Daily TF Longer Outlook UpdateBack in October we broke down Daily Outlook after we had topping signals and strong trend break. When that was posted we were looking to two possibilities after the trend was broken, we either needed to get back under Smaller MA without reaching the top to show no acceptance in New Range to then proceed with trend change and a slower correction or stay above Smaller MA to push for higher VAH/Edge areas to make this our range for some time and possibly balance between VAH/VAL with pushes out of them finding their way back in.
What ended up happening is we got a push back into MA but closed over it and more buying came in to push and gap us over VAH into Range Top, of course we had no way of knowing that Range Edge would be the top but we pushed into it and showed clear topping/rejection from it.
This time Edge Top rejection was much stronger and got us back under VAH/Smaller MA, flushed VAL with Medium MA which again provided Temp Support and as mentioned we got that balancing action between VAL / VAH with pushes out rotating back in until we broke/closed under Medium MA and got more selling which took us under Range Edge Low, flushed Previous Range VAH and Large MA but as that was first tag of big MA after spending quite some time away it naturally provided buying to get us back in New Range which we showed acceptance in by Previously Tagging the Top which meant once price is back in, it doesn't need much big buying as it just wants to rotate back towards Supply which so happens to be at/over VAH.
Where can we go from here ?
The flush under Edge Low temporarily changed Medium Trend into correction but the bounce didn't let us stay in correction and instead we go that rotation into Supply and are now technically again in Up Trend over MAs.
Yes we can stay in up trend and continue with sideways/strength/inside days that will keep us up Over/Around VAH while we let Smaller/Medium MAs catch up and continue pushing us towards Edge Top and maybe even push us into New Range Above.
But few things we have to consider... We are at the top of Big Big area (under new price level of 7000), We had a huge run this year, We have showed multiple Topping Patterns here around 6800 - 6900 +/- Areas, We have showed good trend breaks and attempts at trend change, We are back in area of Supply where bigger failures/sellers have came in, We are extended from Medium and Small MAs which provide support in New/Untested areas and this time we are extended away into Supply Area not New area.
With all that in mind will we have strong buyers who will come in here and start buying the extension inside Supply ? Or was this extension all momentum buyers who aren't planning to hold us up.
My current bias is if we look at Cost Basis break out area up to our Top, then the Flush to Large MA and back up, to me it looks like one side of a bigger M topping pattern which happens at bigger tops. If that is the case then either Friday or somewhere close we should be marking our Lower High and if buyers from Last Week will not hold this then price will want to head back towards some sort of Support which would be Smaller MA as the first spot which means back under VAH. Something to be careful of is that since now VIX is down, Volume will be down as well with holidays coming which means even if we start moving down it might be more of the same way we got up here last week which was more of Slower Balance(Back and Forth) Up days. Way down could be similar with slower balance down days.
From there Smaller MA and areas under it can Provide Support and keep us in some sort of sideways action around it BUT as long as we keep holding under VAH 860s - and under Edge Top 920s then that will mean Weakness, we would look for a move under VAH that can stay under it even if it consolidates around, then into Mean where Medium MA should be by the time we get there, of course it could happen fast as well but have this feeling that it might be a drag this time around IF it happens.
We already have a week of fresh Supply up here from Last Week and if we again get under Smaller MA and can again change trend under Medium MA then that will bring in more weakness to continue for lower targets back towards VAL which could also provide holds BUT if trend stays in correction and we are to follow through with the M pattern then we will eventually see a move back under Range Edge Low and aim to take out the low we made on the last Flush Nov 21st which would be the M middle which could give us more weakness to take us towards our Correction Areas lower into the Cost Basis. Again if market has topped out and all the large selling for now is done, if this is to happen then careful of forcing for it to happen quick as this can play out over a longer period of time as market may need a longer breather/correction/consolidation before it can start a new stronger trend again.
If we don't end up getting a correction under Medium MAs under VAL/Edge then staying over VAL can keep price in balance with us going back and forth in 6700 - 6900s areas for some time, to not have a correction or prevent price balance and see more strength price would need to let some MAs catch up and push us over Previous High AND be able to stay above it, until then we will be looking at either more Balance or Balance with Weakness which can give us a correction.

a HighRisk QuickScalp on #USDJPY📌 Market Insight: {#USDJPY }
⚠️ Risk Assessment: {High}
🚀 Approach:
Not a Quality setup right now ... and need a valid LTF entry . without it , should skip this setup ... NO RUSH
#Ash_TheTrader #Forex #GBPJPY #MarketAnalysis #TradingSetup #RiskManagement #GOLD #Scalper #NQ #EURUSD

a Risky QuickScalp on #EURUSD📌 Market Insight: {#EURUSD }
⚠️ Risk Assessment: {High}
🚀 Approach:
Not a Quality setup and market seems need time be sorted out .
We can have it as a Quickscalp by a nice valid momentum Structure .
#Ash_TheTrader #Forex #GBPJPY #MarketAnalysis #TradingSetup #RiskManagement #GOLD #Scalper #NQ #EURUSD

#CHFJPY , Lets give her a chance !!📌 Market Insight: {#CHFJPY }
⚠️ Risk Assessment: {High}
🚀 Approach:
Not a fan of these kinda pair ... but lets see
with a nice momentum structure we can take it as a QuickScalp .
#Ash_TheTrader #Forex #GBPJPY #MarketAnalysis #TradingSetup #RiskManagement #GOLD #Scalper #NQ #EURUSD

Weekly QQQ (NQ-US100) Outlook - Prediction (23 NOV)Weekly QQQ (NQ-US100) Outlook - Prediction
📊 Market Sentiment
Market sentiment is driven by fear at the moment. In my opinion, we are trading inside a bearish zone. Unless we get meaningful data or positive news, I expect the market to continue declining. Core PPI will be released on Tuesday at 08:30, which could create a minor bullish reaction; however, I personally do not think this will shift the overall sentiment. PPI is not a strong catalyst for a major sentiment change, so bearish conditions are likely to remain in play.
📈 Technical Analysis
Price ran the 613 level strongly and reversed aggressively on Thursday after NVDA earnings. This move trapped the bulls and filled institutional put positions. As I mentioned on Thursday evening, a weak bounce was possible and that is exactly what occurred.
📌 Outlook – Prediction
Scenario 1 (Bearish Scenario):
I believe this scenario is more likely to play out. I expect price to retrace toward 559. If we see strong bullish momentum on Monday, I will likely become more cautious with my puts.
Scenario 2 (Bullish Scenario):
If price shows strong momentum on Monday and reprices toward 614, then I will consider buying calls around 606, targeting all-time highs afterward.
Follow me for daily SPY–QQQ updates. I will update the idea based on evolving price action.
💬 For detailed insights and broader market context, please check my Substack link in profile.
⚠️ For educational purposes only. This is not financial advice.

Weekly SPY (ES-US500-SPX) Outlook - Prediction (23 NOV)Weekly SPY (ES-US500-SPX) Outlook - Prediction
📊 Market Sentiment
Market sentiment is driven by fear at the moment. In my opinion, we are trading inside a bearish zone. Unless we get meaningful data or positive news, I expect the market to continue declining. Core PPI will be released on Tuesday at 08:30, which could create a small bullish reaction; however, I personally do not think this will shift overall sentiment. PPI is not a strong catalyst for a major sentiment change, so bearish conditions are likely to remain in play.
📈 Technical Analysis
Price ran 675.5, trapped the bulls, and then reversed sharply to the downside exactly as I anticipated in my previous weekly outlook. Price tapped 653 and bounced from that level, which aligned with Friday’s projection.
📌 Outlook – Prediction
Scenario 1 (Bearish Scenario):
I think this scenario is more likely early in the week. Price may retrace toward 633, which is a significant institutional liquidity pool for me. From there, price could gather energy for a higher expansion or bounce.
Scenario 2 (Bullish Scenario):
If price aggressively reprices back to 675, I will consider the bias short-term bullish. In that case, I will be buying after a retracement to 667.
Follow me for daily SPY–QQQ updates. I will update the idea based on evolving price action.
💬 For detailed insights and broader market context, please check my Substack link in profile.
⚠️ For educational purposes only. This is not financial advice.
#USDJPY , Second Round ?📌 Market Insight: {#USDJPY }
⚠️ Risk Assessment: {High}
🚀 Approach:
Second Round ? ... Lets see .
Need momentum Structure .... just for QuickScalp
#Ash_TheTrader #Forex #GBPJPY #MarketAnalysis #TradingSetup #RiskManagement #GOLD #Scalper #NQ #EURUSD

#USDJPY , another Runner on Buyside !📌 Market Insight: {#USDJPY }
⚠️ Risk Assessment: {High}
🚀 Approach:
Not a Quality Setup ... Due the Structure of Friday but lets have it in our watchlist
Maybe by a Nice LTF Momentum Structure we can take it as QuickSclap .
#Ash_TheTrader #Forex #GBPJPY #MarketAnalysis #TradingSetup #RiskManagement #GOLD #Scalper #NQ #EURUSD

#EURUSD , BuySide QuickScalp ?📌 Market Insight: {#EURUSD }
⚠️ Risk Assessment: {High}
🚀 Approach:
Same as UJ , Not a perfect setup
We can take it ONLY and ONLY by LTF Entry sign ... No rush on it .
#Ash_TheTrader #Forex #GBPJPY #MarketAnalysis #TradingSetup #RiskManagement #GOLD #Scalper #NQ #EURUSD

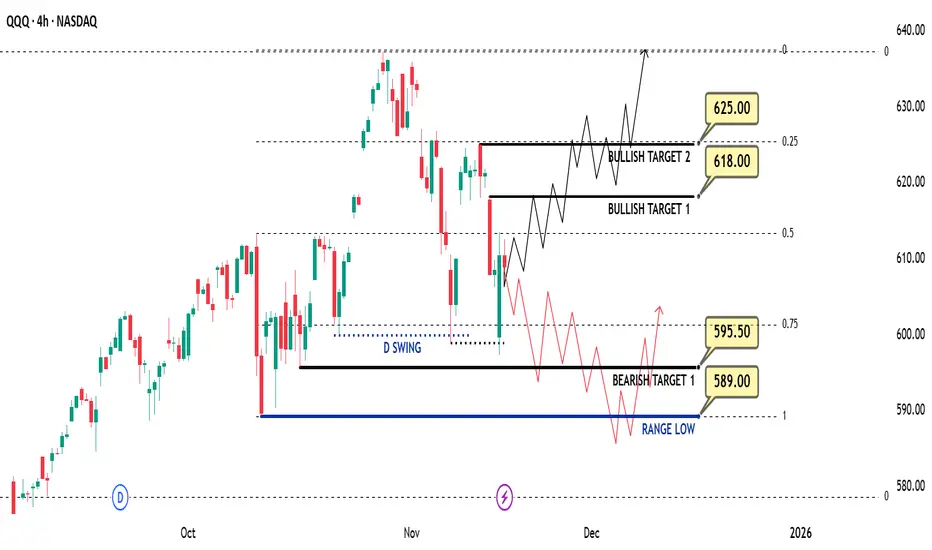
Weekly QQQ (US100-NQ) Outlook - Prediction (16 NOV)Weekly QQQ (US100-NQ) Outlook - Prediction (16 NOV)
📊 Market Sentiment
Market sentiment appears bearish right now, in my opinion. The FED may pause rate cuts in December, which has contributed to recent selling pressure and possible hedging flows. However, with the U.S. government reopening last week, we will start receiving updated economic data again. If employment data weakens and CPI comes in low or stable, it could trigger a renewed bullish momentum.
NVDA will report earnings this Wednesday after market close. I will be watching closely in my view, if NVDA were to miss expectations, QQQ and SPY could see a strong retracement. However, I think this is unlikely. I expect solid earnings growth and believe the AI cycle continues to support upside.
Additionally, U.S. Treasury Secretary Scott Bessent stated that the Trump administration aims to finalize its trade agreement with China by Thanksgiving (November 27). This could add further bullish sentiment to the market.
📈 Technical Analysis
The market showed a strong bounce on Friday after tapping the 599 level. RSI has also reset, meaning price is no longer overbought. We remain inside the weekly range, and price has reached the 0.75 max discount zone for the second time.
📌 Game Plan – Prediction
Bullish Scenario (Black Line):
I think this scenario is more likely. I want to see price close a 4H candle above 613. If that happens, I will be targeting 618 next. Price may run 618, pull back slightly, then eventually push toward 625 and potentially all-time highs around 637.
Bearish Scenario (Red Line):
If we see strong selling on Monday, I will assume price may follow the bearish path. In that case, I expect a move toward 595.5 and then the range low at 589. From there, we could see a bounce and a reclaim of 595.5.
💬For detailed insights and broader market context, please check my Substack link in profile.
⚠️ For educational purposes only. This is not financial advice.