#ETC/USDT Might Be Good Zone to Bounce From#ETC
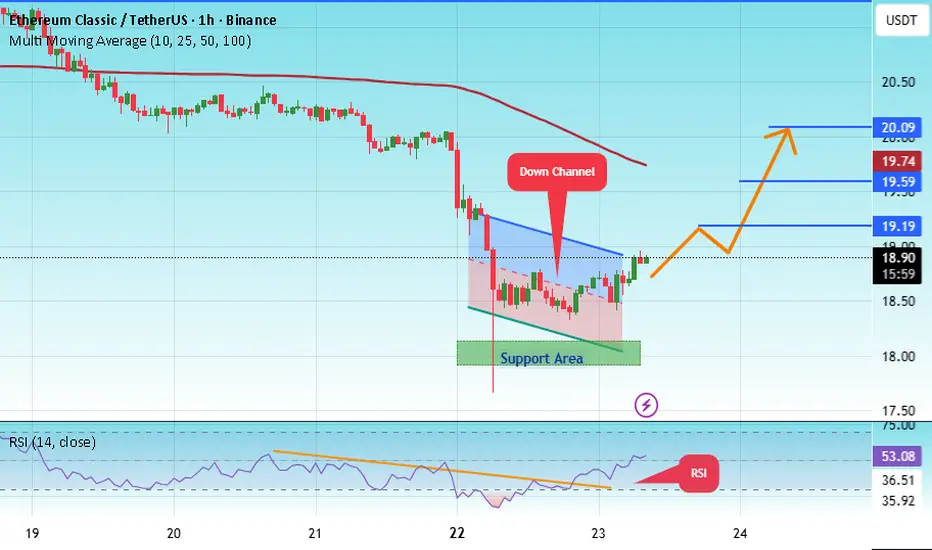
The price is moving within a descending channel on the 1-hour frame, adhering well to it, and is heading for a strong breakout and retest.
We have a bearish trend on the RSI indicator that is about to be broken and retested, which supports the upward breakout.
There is a major support area in green at 18.00, representing a strong support point.
We are heading for consolidation above the 100 moving average.
Entry price: 18.80
First target: 19.19
Second target: 19.60
Third target: 20
Don't forget a simple matter: capital management.
When you reach the first target, save some money and then change your stop-loss order to an entry order.
For inquiries, please leave a comment.
Thank you.
Etc
ETC/USDT — Major Support Retest, Breakout or Breakdown?🔎 Current Market Outlook
Current price: ~20.49 USDT
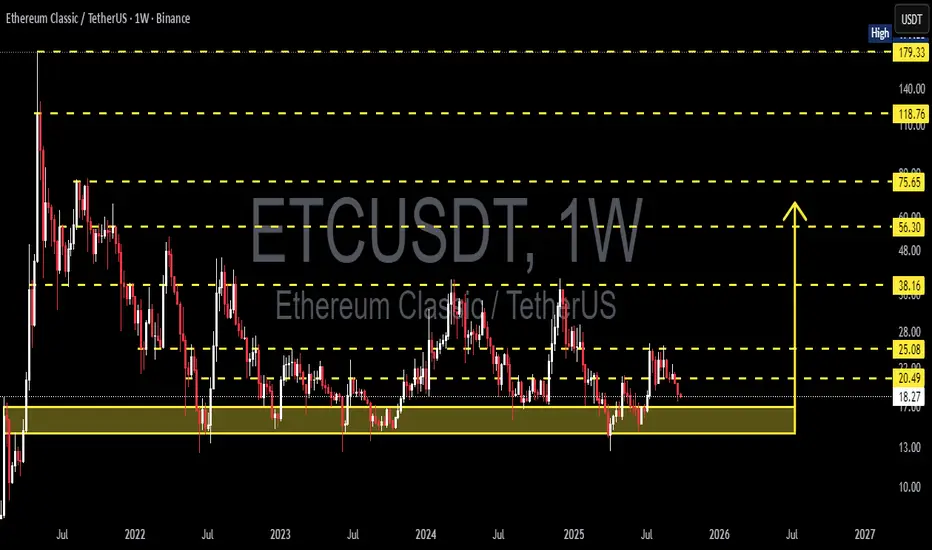
Price is approaching the critical support zone at 17–14 USDT (highlighted yellow).
This area has acted as a multi-year demand zone since 2021, where buyers repeatedly defended the level and triggered rebounds.
However, ETC has consistently failed to break major resistance levels, forming lower highs within a prolonged sideways range.
This makes the 17–14 zone a decision point: will buyers once again absorb supply and push for a rebound, or will sellers finally break the structure and trigger a deeper bearish trend?
---
📐 Market Structure & Price Pattern
1. Major Support Zone (17–14 USDT):
Tested multiple times since 2021.
Holding above → suggests strong accumulation.
Breaking below → could end the long-term sideways trend.
2. Key Resistance Levels:
25.08 USDT → first resistance to watch for breakout.
38.16 USDT → medium-term resistance.
56.30 & 75.65 USDT → major long-term supply zones.
Higher targets: 118.76 & 179.33 USDT (only relevant in a super bullish cycle).
3. Price Pattern:
Large sideways structure with lower highs.
Repeated tests of 17–14 → showing this demand zone is still crucial for market direction.
---
🐂 Bullish Scenario (If Buyers Defend)
Confirmation: Weekly close above 25.08 with strong volume.
Implication: Signals a new higher high on the weekly timeframe.
Targets:
TP1 → 38.16
TP2 → 56.30
TP3 → 75.65
Key Note: As long as 17–14 holds, ETC remains in accumulation territory with potential for a strong rebound in the next bullish phase.
---
🐻 Bearish Scenario (If Sellers Break Through)
Confirmation: Weekly close below 14 USDT.
Implication: Multi-year demand zone is invalidated.
Targets: Without solid support below, price could drop towards the psychological 10 USDT level or even lower.
Warning: A breakdown here would mark the end of the long-term sideways phase and trigger a deeper bearish leg.
---
🎯 Trading Strategy & Risk Management
1. Conservative Approach:
Wait for breakout >25.08 → enter long.
Targets: 38.16–56.30.
Stop loss below 22.
2. Aggressive Approach (buy the zone):
Enter within 17–14.
Stop loss below 14.
First target 25.08, scale out at 38.16.
3. Short Setup:
Only valid if weekly close <14 (confirmed breakdown).
Short-term target: 12 → 10 USDT.
⚠️ Note: This is a high risk/reward zone. Position sizing and clear stop-loss levels are critical.
---
✨ Conclusion
The 17–14 USDT support zone is ETC’s lifeline.
Holding above → accumulation continues, with rebound potential toward 25.08 → 38.16.
Breaking below 14 → long-term bearish breakdown with risk of a sharp decline.
Breakout above 25.08 → the first real trigger of a bullish trend reversal.
ETC is at a make-or-break moment. Traders should closely watch how weekly candles react around 17–14.
---
#ETC #EthereumClassic #Crypto #Altcoins #TechnicalAnalysis #PriceAction #SwingTrade #SupportResistance #CryptoAnalysis #ChartPatterns
ETC is forming a potential double bottom pattern📊 BME:ETC Market Update
BME:ETC is forming a potential double bottom pattern 🔄. If it breaks out of the red resistance zone 🔴, the first target will be the 🔵 blue line level 🎯.

ETCUSDT 1D chart reviewTrend and structure
• The price is currently in the 20.40 USDT area.
• You can see the downward trend line (orange), from which the price was rejected several times.
• The next support:
• 20.40 USDT (local, just tested)
• 19.01 USDT (stronger support from earlier holes).
• The nearest resistance:
• 21.09 USDT (SMA + local level)
• 22.64 USDT (strong resistance, last peak before fall).
Medium walking
• SMA (red/green lines) show that the short -term price is below most of the average → supply advantage.
• Only breaking above 21.1–22.6 USDT could change the fondness for more bullfinches.
MacD
• The histogram grows slightly up (less red), but MacD lines and signal are close to each other → no clear trend, rather consolidation with slight relegation.
RSI
• RSI around 45–50, i.e. neutral.
• There is neither a sale (<30) nor purchase (> 70).
⸻
📊 scenario
• bull:
If ETC persists above 20.40 and boots over 21.1 USDT, it is possible to move in the direction of 22.6 USDT (main barrier).
• Bear:
If the price drops below 20.4 USDT, another goal is 19.0 USDT. Punction of 19 could open the road even towards 18-17.5 USDT.

#ETC/USDT Might Be Good Zone to Bounce From#ETC
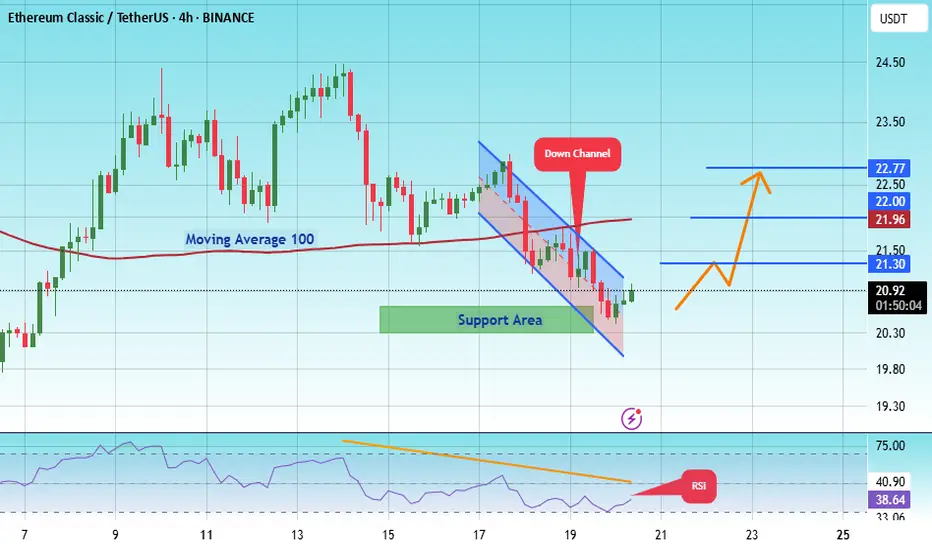
The price is moving within an ascending channel on the 1-hour frame, adhering well to it, and is on its way to breaking strongly upwards and retesting it.
We have support from the lower boundary of the ascending channel, at 20.00.
We have a downtrend on the RSI indicator that is about to break and retest, supporting the upside.
There is a major support area in green at 20.43, which represents a strong basis for the upside.
Don't forget a simple thing: ease and capital.
When you reach the first target, save some money and then change your stop-loss order to an entry order.
For inquiries, please leave a comment.
We have a trend to hold above the 100 Moving Average.
Entry price: 20.95
First target: 21.30
Second target: 22.00
Third target: 22.77
Don't forget a simple thing: ease and capital.
When you reach the first target, save some money and then change your stop-loss order to an entry order.
For inquiries, please leave a comment.
Thank you.
ETCUSDT positionEthereum Classic Price Analysis:
Trend & Behavior: Price has dropped from 22.33 and is near support at 19.68. If it rebounds from this level, we could see an upward move, but if it breaks below 19.68, the downtrend could continue.
Support & Resistance:
Support: 19.68 is the key level. A bounce here may lead to an upward move toward 21.88 or 22.33.
Resistance: 22.33 and 21.88 are key resistances. If price fails to break them, expect a possible retracement.
Scenarios:
Bullish: If price reacts positively at 19.68, consider buying with targets at 21.88 or 22.33.
Bearish: If price breaks below 19.68, watch for further support at 18.87 or 17.36.
Strategy: Best to enter long if the price bounces from 19.68, but be cautious if it breaks below, as further declines could follow.

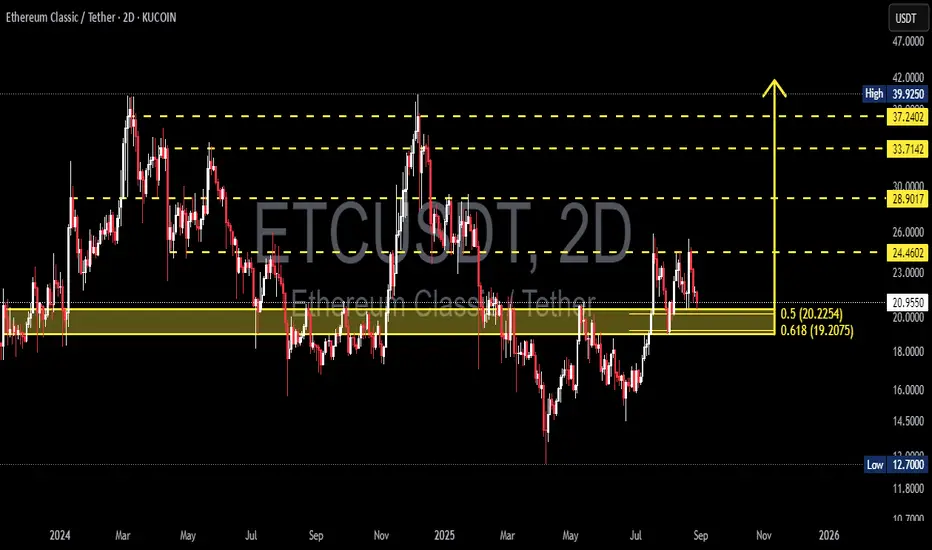
ETC/USDT — Testing Golden Pocket: Rebound or Breakdown?Ethereum Classic (ETC) is currently at a critical decision zone after being rejected around the 24.46 USDT resistance. The price has now pulled back into the Fibonacci golden pocket (0.5–0.618) at 20.22–19.20 USDT, a key support zone that previously acted as a major flip level (resistance → support).
This area carries heavy significance as it has served as a battleground for liquidity multiple times. The reaction here will likely determine whether ETC continues its mid-term bullish structure or slips back into a deeper bearish trend.
---
🔎 Market Structure & Pattern
Mid-term structure: ETC is trading within a wide range between the historical support of 12.70 and the upper resistance near 39.93.
Short-term focus: The 19.20–20.22 golden pocket is the decision point for the next move.
Bullish bias holds as long as this level remains intact.
Bearish risk emerges if the golden pocket fails, triggering a deeper breakdown.
---
🚀 Bullish Scenario
1. Strong rejection at the golden pocket with bullish reversal candles (engulfing / pin bar) → buyer confirmation.
2. Short-term target: 24.46 (nearest resistance).
3. Break and close above 24.46 on the 2D timeframe opens upside targets at 28.90 → 33.71 → 37.24 → 39.93.
4. Supporting signals: RSI holding above 50 + volume expansion on breakout.
---
⚠️ Bearish Scenario
1. Breakdown confirmed if the 2D candle closes below 19.20 → support failure.
2. Downside targets: 16.00 → 14.50 → 12.70 (historical low).
3. A weak bounce forming only a lower high below 24.46 would strengthen bearish continuation.
4. Confirmation: high volume on breakdown + strong bearish candles without lower wicks.
---
📝 Trader’s Notes
The golden pocket zone (19.20–20.22) is the decision point for the next macro move.
Aggressive traders may consider longs here with tight stops below 18.00.
Conservative traders should wait for a confirmed breakout above 24.46 before entering.
Risk management is crucial: aim for at least 1:2 risk-to-reward ratio.
---
📌 Key Levels
Support: 19.20–20.22
Nearest resistance: 24.46
Bullish targets: 28.90 → 33.71 → 37.24 → 39.93
Bearish targets: 16.00 → 14.50 → 12.70
#ETCUSD #EthereumClassic #ETC #CryptoAnalysis #Altcoin #TechnicalAnalysis #SupportResistance #Fibonacci #PriceAction #SwingTrade
ETC Breakout Alert!🚨 BME:ETC Breakout Alert! 🚨
BME:ETC is currently testing the red resistance zone 🔴
If price breaks out, the first target will be the green line level 🎯
A confirmed breakout here would signal bullish continuation and could push price higher ✅

ETC 100$+Let's take BME:ETC as the face of most altcoins.
Same fractal, same psychology.
This cycle is much longer than the previous one, so I won't give any exact dates, but I feel that we will be trading at high prices in 2026.

Ethereum Classic Above EMA55 Weekly, Mixed Bullish BagEthereum Classic (ETCUSDT) is trading below EMA89 but also above EMA55 on the weekly timeframe, a mixed bag. We have a long-term consolidation phase, the longest ever, with mixed market conditions. Mixed short-term but bullish on all other terms. There is no doubt we are going up, 100% certain.
ETCUSDT has a long-term triple bottom pattern present on this chart, with flat volume. The flat volume in those three years of neutral sideways action indicates lack of participation by traders, this is the classic consolidation period, when whales accumulate in preparation for long-term growth.
Cryptocurrency is a young growing market, after each stop, it goes up. A bull market every four years, more or less, so far working perfectly and be ready to see it working again.
Between late 2018 and early 2021 Ethereum Classic was trading at bottom prices and produced a consolidation pattern. As soon as ETC broke above EMA55/89 weekly we saw a major bull market. This is what we are seeing now but things change based on the law of alternation.
We are seeing a very long consolidation period between 2022 and 2025. Since the last period was short in duration, this period is long. Since the last bullish wave was very steep, this one can result being gradual.
Fast or gradual, we are going up. The fact that many people are losing patience means we are getting very close. Everything can be neutral today, shy not bearish; it can all turn green in a single day.
Watch how the market grows. Think about it, five weeks the market stalls with no growth but there isn't any bearish action either. This is accumulation before the next leg-up. Mark my words. Market conditions continue to improve and this will soon be reflected on the price and chart. $283 or maybe even $450 next.
Namaste.

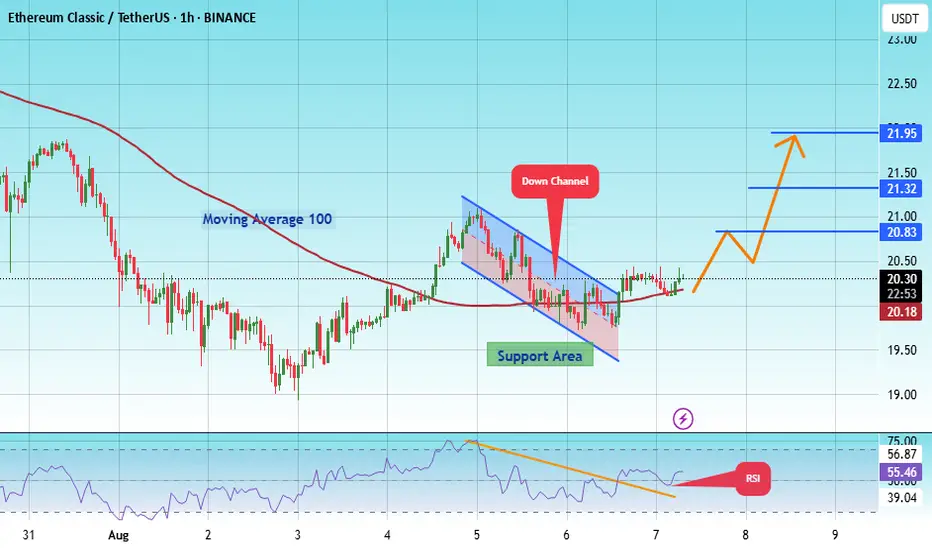
#ETC/USDT Might Be Good Zone to Bounce From#ETC
The price is moving within an ascending channel on the 1-hour frame, adhering well to it, and is on its way to breaking strongly upwards and retesting it.
We have support from the lower boundary of the ascending channel, at 19.61.
We have a downtrend on the RSI that is about to be broken and retested, supporting the upside.
There is a major support area in green at 19.34, which represents a strong basis for the upside.
Don't forget a simple thing: ease and capital.
When you reach the first target, save some money and then change your stop-loss order to an entry order.
For inquiries, please leave a comment.
We have a trend to hold above the 100 Moving Average.
Entry price: 20.30.
First target: 20.83.
Second target: 21.32.
Third target: 21.95.
Don't forget a simple thing: ease and capital.
When you reach the first target, save some money and then change your stop-loss order to an entry order.
For inquiries, please leave a comment.
Thank you.
ETC/USDT 1D Chart1. Trend and price structure
• The price is currently 23.71 USDT (+6.75% on the day).
• After an earlier inheritance trend (yellow dotted line - trend line), you can see an attempt to break up and maintain above SMA 1 (approx. 22.30 USDT).
• The next resistance is 24.50 and 26.00 USDT - you can see that the supply of supply was already 24.50.
• The next support is 22.30 and stronger at 21.02 USDT.
2. Medium walking (SMA)
• SMA #1 (red) - short -term, the price is above, which is a bull signal.
• SMA #2 (green) - medium -term, also below the current price, which supports the upward scenario.
• SMA #5 (blue) - long -term, is lower (approx. 18.85), so the main trend is not completely inverted yet, but the momentum is growing.
3. MacD
• The MacD line pierced the signal line from the bottom - buy signal.
• The histogram has gone down in positive values - the growing pressure of buyers.
4. RSI
• RSI around 55–60 - far from the purchase zone (70+), so theoretically there is still space for growth.
• RSI has pierced its average, which is confirmed by bull's sentiment.
5. Scenarios
• Bull: Maintenance of a price above 22.30 and a possible retest 24.50 with an attempt to break in the direction of 26.00. At 26.00 - road to 27.00–28.00.
• Bear: a decrease below 22.30 opens the road to 21.02, and a deeper descent - around 19.80 or 18.85.
6. Applications
• Short -term - advantage of buyers, but strong resistance at 24.50.
• A good moment for swing traders to watch the reaction at 24.50.
• For long -term positions - full confirmation of the trend reversal only after 26.00.

Ethereum Classic 2025 · 2 Months, 4 Months or 12 Months?Ethereum Classic is already on the other side, as you can see from this chart. 7-April 2025 was a turning point.
The correction developed from a high point in December 2024 and ended early April 2025. The day this correction ended, Ethereum Classic entered a new bullish cycle. This new bullish cycle as an uptrend is only confirmed after the chart produces a series of higher highs and higher lows, rising prices. This sequence is already present. We have two main lows and two main highs.
Ethereum Classic is already growing, it has been growing for months, and will continue to grow long-term.
This is a daily timeframe. I will do a new publication where we look at ETC long-term and project some new and updated 2025 bull market targets. We looked at ETC dozens of times in the past since 2022 and now we are ready to look at the numbers again.
The numbers will be the same as I used long-term numbers back then but it is good to refresh our minds.
Patience is key. Continue to hold strong.
Market conditions are great for this pair, ETCUSDT; notice the rising volume at the bottom of the chart. Notice MA200 as well.
If you go back to 2024, when ETCUSDT moved above MA200 with rising volume, a major high showed up. This time it is better though. There was a full flush and ETC is trading above MA200 coming from a low point. This gives further strength to the bullish case, because it makes it clear that there is still plenty of room left available for growth.
The bullish phase can last for months. The bull run phase alone can last 1-2 months. The entire period 4-6 months. If we count the build up phase, we have a duration of 8-12 months for the full completion of a bull market bullish wave.
Namaste.

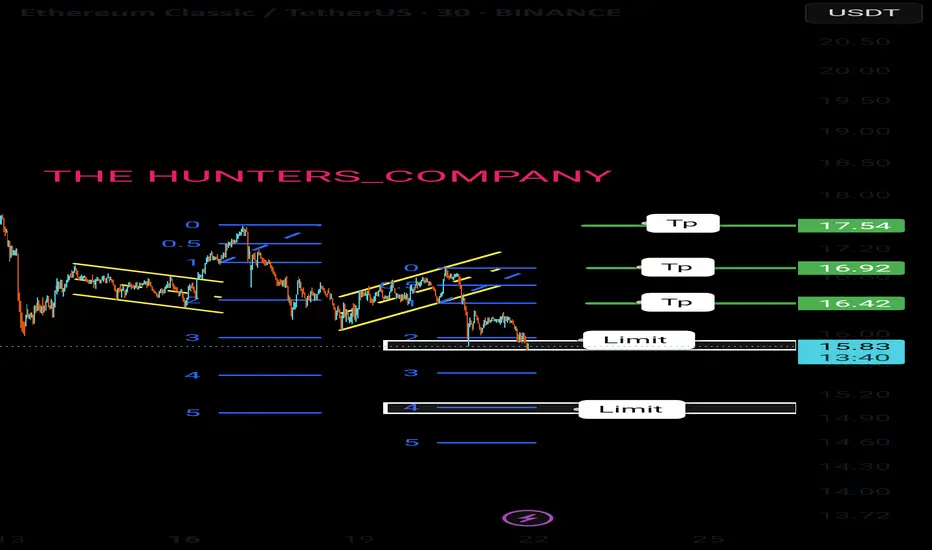
ETC 4H Analysis : V-Pattern Breakout , $23M Buy & Key Fib LevelsHey , how's it going? Come over here — Satoshi's got something for you !
⏱ We are analyzing Ethereum Classic (ETC) on the 4-hour timeframe .
👀 After breaking above the $19.1 level, Ethereum Classic started a strong and high-momentum bullish move and reached the $25.28 resistance, where it was rejected and entered a deep correction .
A V-pattern support has now formed, and a breakout of this pattern could serve as a signal for the end of the correction .
🎮 We're observing the key Fibonacci zones , drawn from the breakout level and its pullback area .
The 0 level is considered our support base , while the other Fibonacci levels act as resistances and potential long-entry triggers .
The most important upcoming resistance is at $21.16 , which serves as the main trigger for our long position .
We will now monitor whether ETC forms a higher low before reaching this resistance , or reacts to it and then forms a higher low — both scenarios would be valid setups for a long position .
As for the 0.236 Fibonacci level , it's the nearest support, and a pullback to this zone is also possible .
⚙️ The RSI oscillator previously had a key resistance at 57.78 , which has now been broken to the upside , and RSI is currently holding above this level .
🔼 Volume may increase again tomorrow during the New York session .
Today, in the marked candle , $23 million worth of Ethereum Classic was bought , and this market maker buy helped save ETC from a deeper correction .
🖥 Summary :
The breakout of the V-pattern allowed ETC to push upward and form a higher low .
Once the pullback to the identified Fibonacci zone completes , we can open our long position , or alternatively , set a buy stop at that level with a wider stop-loss to manage risk properly .
💡 Disclaimer :))) .

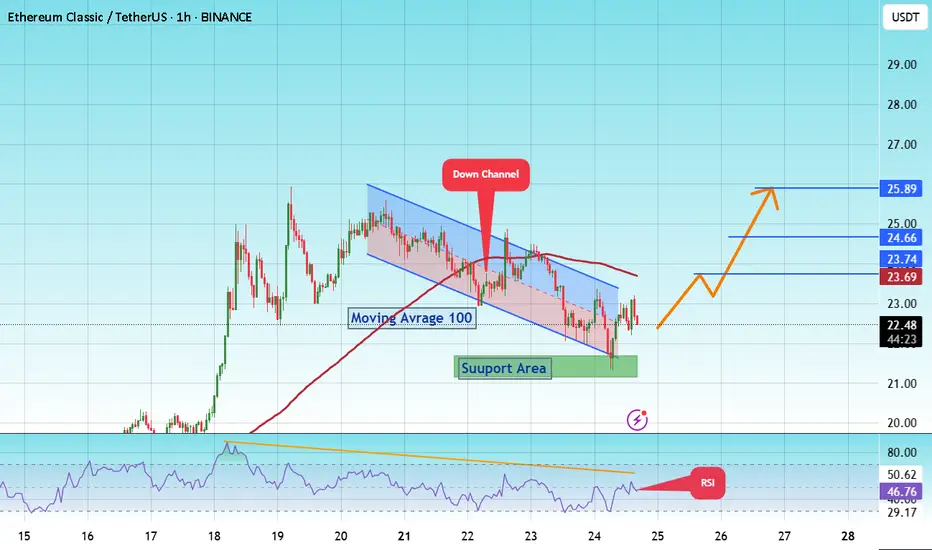
#ETC/USDT Forming Strong Bullish Potential#ETC
The price is moving within a descending channel on the 1-hour frame and is expected to break and continue upward.
We have a trend to stabilize above the 100 moving average once again.
We have a downtrend on the RSI indicator that supports the upward move with a breakout.
We have a support area at the lower boundary of the channel at 21.80, acting as strong support from which the price can rebound.
We have a major support area in green that pushed the price upward at 21.20.
Entry price: 22.50
First target: 23.70
Second target: 24.66
Third target: 25.90
To manage risk, don't forget stop loss and capital management.
When you reach the first target, save some profits and then change your stop order to an entry order.
For inquiries, please comment.
Thank you.
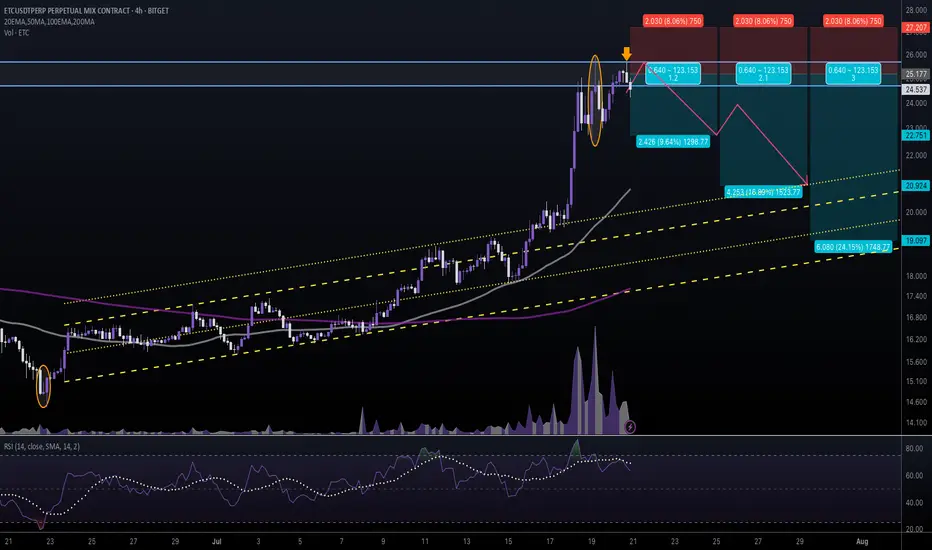
#ETCUSDT #4h (Bitget Futures) Ascending channel retestEthereum Classic printed two evening stars in a row, looks locally topped and ready for correction towards 50MA & 200MA supports.
⚡️⚡️ #ETC/USDT ⚡️⚡️
Exchanges: Bitget Futures
Signal Type: Regular (Short)
Leverage: Isolated (5.0X)
Amount: 5.0%
Entry Zone:
24.679 - 25.675
Take-Profit Targets:
1) 22.751
2) 20.924
3) 19.097
Stop Targets:
1) 27.207
Published By: @Zblaba
CRYPTOCAP:ETC BITGET:ETCUSDT.P #4h #EthereumClassic #PoW #L1 ethereumclassic.org
Risk/Reward= 1:1.2 | 1:2.1 | 1:3.0
Expected Profit= +48.2% | +84.5% | +120.7%
Possible Loss= -40.3%
Estimated Gaintime= 1-2 weeks
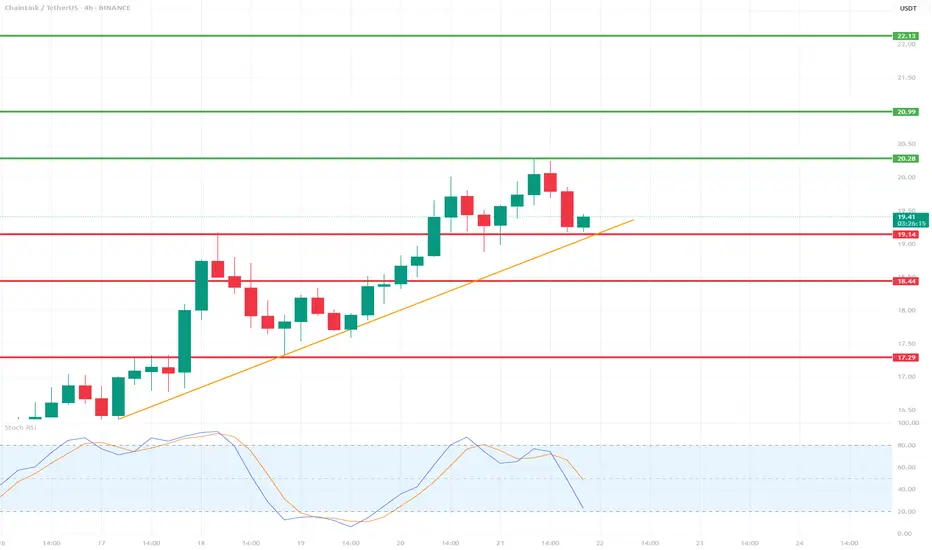
LINK/USDT 4H Chart📉 Indicators and Market Structure:
🔶 Trend:
Current trend: up, as long as it remains above the trend line and the 19.14 USDT level.
Local resistance: 20.28 USDT (recent high).
Next resistances: 20.99 USDT and 22.13 USDT (green lines).
Supports: 19.14 USDT, 18.44 USDT, 17.29 USDT (red lines).
🔷 Stochastic RSI (lower indicator):
Located in the oversold zone (below 20) and starting to reverse upward.
Potential signal of buying pressure if the %K and %D lines cross bullishly.
🧠 Scenarios:
✅ Bullish scenario (trend continuation):
Bounce from the trend line and the 19.14 level → breakout of 20.28 → test of 20.99–22.13.
Confirmation will be a clear bullish candle with high volume and a Stochastic RSI cross up.
❌ Bearish scenario (trend break):
Closing below the trend line and the 19.14 level → correction towards 18.44, and then even to 17.29.
An oversold RSI could support continued declines if a rebound does not occur.
📌 Summary:
Currently, the key level is the trend line and support at 19.14 USDT.
The market is waiting for a reaction – a rebound or a downward breakout.
Stochastic RSI suggests a possible rebound, but candlestick confirmation is needed.
etc sell shortterm"🌟 Welcome to Golden Candle! 🌟
We're a team of 📈 passionate traders 📉 who love sharing our 🔍 technical analysis insights 🔎 with the TradingView community. 🌎
Our goal is to provide 💡 valuable perspectives 💡 on market trends and patterns, but 🚫 please note that our analyses are not intended as buy or sell recommendations. 🚫
Instead, they reflect our own 💭 personal attitudes and thoughts. 💭
Follow along and 📚 learn 📚 from our analyses! 📊💡"

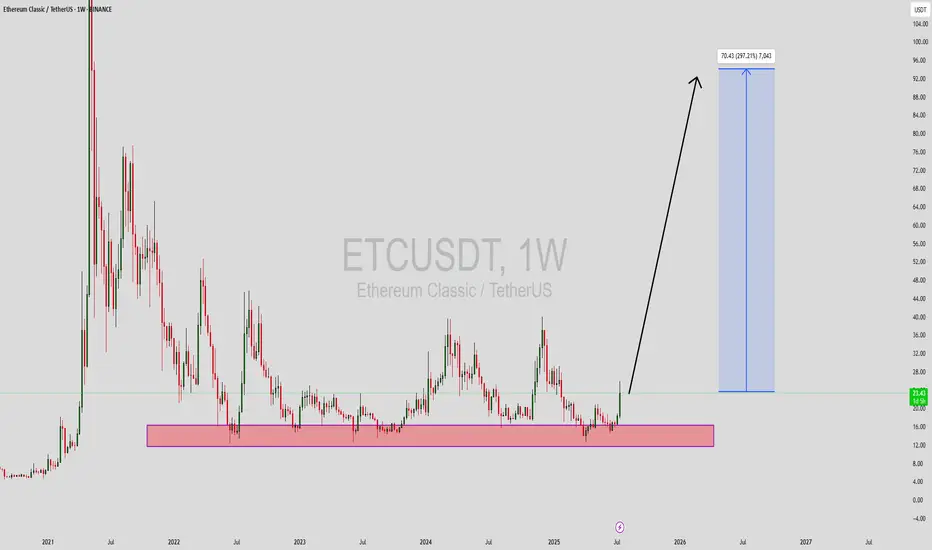
ETCUSDT Forming Strong Bullish PotentialEthereum Classic (ETCUSDT) is currently showing strong bullish potential as it emerges from a long-term accumulation zone. The weekly chart highlights a clearly defined support range where ETC has consistently rebounded in past cycles, and recent price action suggests another powerful move to the upside is brewing. With increased volume and momentum forming around the $15–$17 range, the price has broken out with significant strength, targeting an impressive 240% to 250% rally in the mid to long term.
Technically, ETC has printed a long-term rounded bottom pattern, signaling a possible trend reversal. Such formations often lead to explosive upside moves once the neckline resistance is broken, and ETC appears to be in that breakout phase now. A projected target near $80–$95 aligns well with historical resistance zones from previous bull runs. This is an ideal setup for position traders looking for a high-risk, high-reward opportunity.
Investor sentiment around Ethereum Classic is turning bullish again, driven by renewed interest in proof-of-work (PoW) assets and a potential alternative to Ethereum following its full transition to proof-of-stake. With Ethereum Classic maintaining its original blockchain structure, it continues to attract a niche set of supporters and miners. Growing community support and speculative demand could be key drivers behind this expected price surge.
✅ Show your support by hitting the like button and
✅ Leaving a comment below! (What is You opinion about this Coin)
Your feedback and engagement keep me inspired to share more insightful market analysis with you!
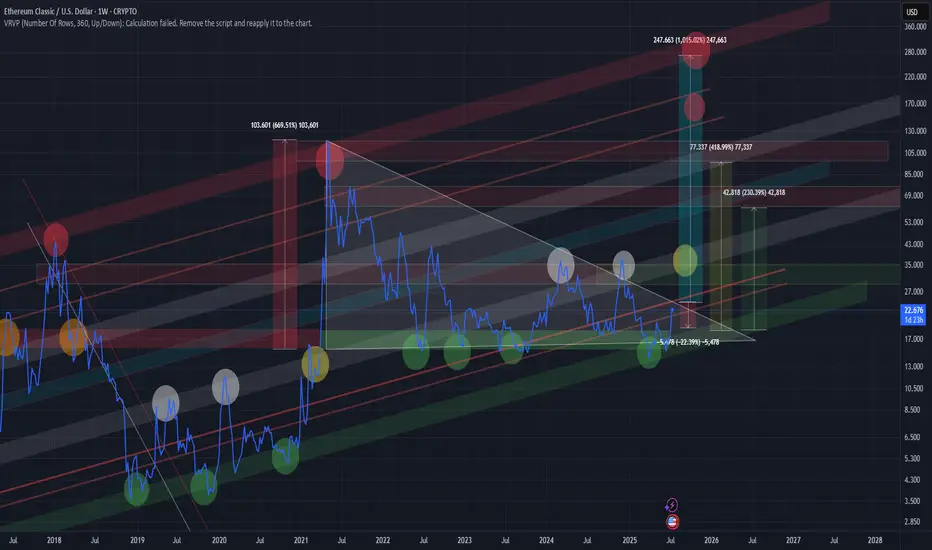
ETC/USD – Weekly Chart Overview Ethereum Classic is trading at a key long-term support zone, bouncing from the lower bound of a multi-year ascending channel. Historically, this zone has triggered large rallies (2019, 2020, 2021).
Major resistance levels are stacked at $24, $42, $77, and $103. If the price holds above $22–24 and breaks out with volume, it could retest the mid/high zones of the channel.
Structure remains bullish above $20. Break and hold above $26–27 may signal the start of a new macro wave.
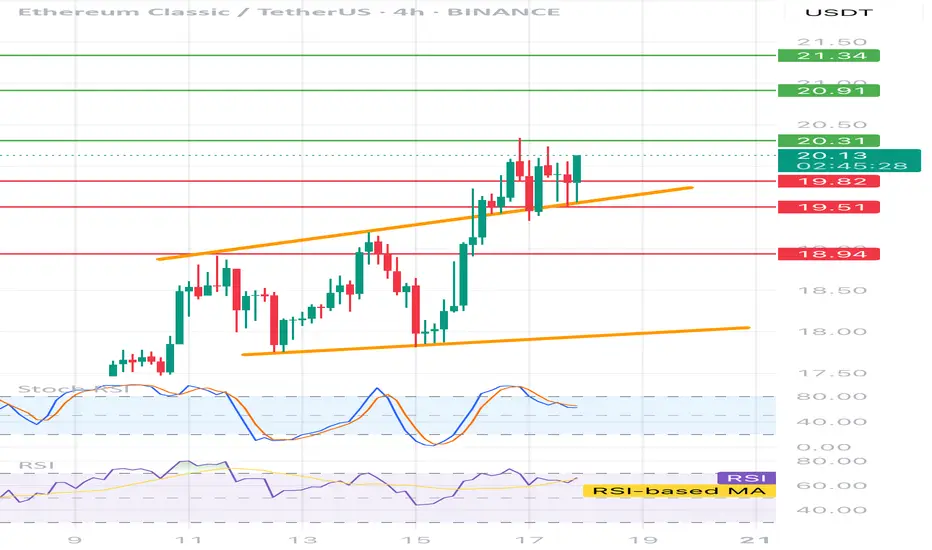
ETCUSDT 4H📊 Price:
Currently around 20.05 USDT
⸻
🔶 Technical formation:
• Ascending channel - clearly marked with two orange trend lines.
• The price is currently testing the upper edge of the channel - it is possible to break or correction.
⸻
📉 Support and resistance:
• ✅ Support:
• 19.73 (local, on the closure of the candles)
• 19.51 (technical, tested several times)
• 18.94 (stronger, historical)
• 🚫 resistance:
• 20.31 - the closest local resistance
• 20.91 - key level
• 21.34 - strong resistance from higher intervals
⸻
🔄 oscillators:
• STOCHASTIC RSI - in the inheritance phase (descent from buying), possible local decline / correction.
• RSI (14) - approx. 60, slightly positive trend, but without exaggeration - no purchase, place for further increases.
📌 Fast strategy:
• 🟢 Long: After breaking and Retescia 20.31 → TP 20.91 / 21.34
• 🔴 Short: after rejection 20.31 or the upper line of the channel → TP 19.73 / 19.51
• 📉 SL: In both cases, it is best 0.3–0.4% above the last high/low
Ethereum Classic:Buying opportunity?hello friends 👋
Considering the price drop we had, you can see that buyers are coming in less and less in the support areas that we specified for you, and this can be a good signal to buy in these areas step by step with capital and risk management and move to the specified goals.
🔥Follow us for more signals🔥
*Trade safely with us*
Ethereum Classic Long-Term Consolidation & The 2025 Bull MarketIt feels like we've been looking at the same chart for three years. Remember June 2022? A "small" 260% price bounce and we all did pretty good. Market conditions have not changed.
It's been three years and three years Ethereum Classic (ETC) continues to move, trade, sideways. A long-term consolidation phase.
The 2021 bull market was also preceded by a consolidation phase. This is marked on the chart.
The 2025 bull market is getting ready, we are still loading and I call for your patience once more but, you can know for certain that Cryptocurrency—the altcoins market—will meet all of your expectations and beyond.
The consolidation pattern has three major lows. June 2022, June 2023 and April 2025.
The last bull market produced total growth of 5,757% from bottom to top.
The current consolidation pattern has a technical triple-bottom. Higher lows each time but only by a few cents. We are only missing the bull market wave and bull run phase.
Think of something similar to what we saw between December 2020 and May 2021. Or, instead of a 6 months long bullish wave, we can get a 12-18 months long bullish cycle. Slow and steady growth.
It is likely to go fast because the consolidation phase has been so long. There is no need for long drawn-out bullish cycle, the market had plenty of time to test everyones patience and reset.
You know how Crypto goes, once it starts moving there is no going back. Nothing slow, fast and strong. That's my guess of course but I am open to seeing anything develop and I will update, adapt and change if something different happens.
One thing is certain, Ethereum Classic will grow.
We are getting closer with each passing day. The best is yet to come.
Namaste.
