Etcusdlong

ETC Bullish Flag BrokenAll necessary Levels Are on the chart . Remember only Open Position After a Candle on Lower Time Frame close above 6.186$. Good Luck!

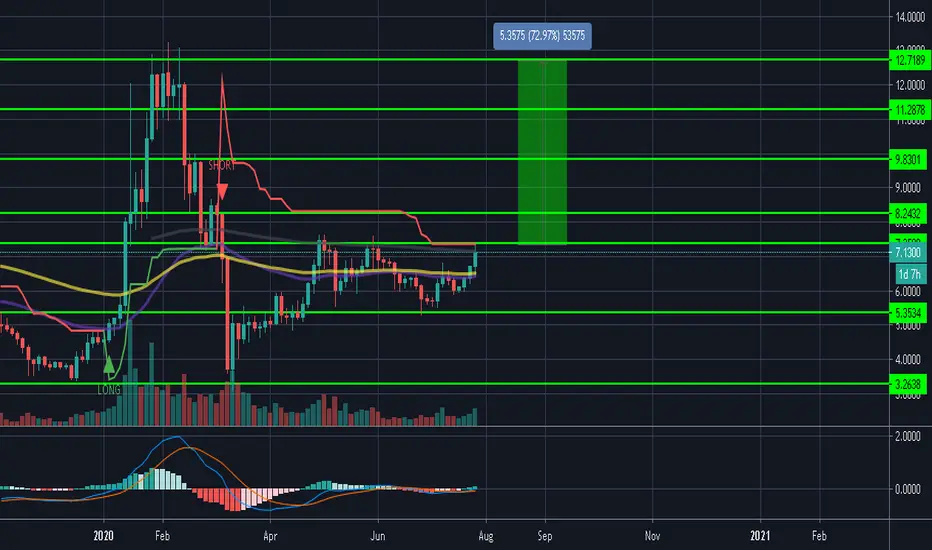
ETCUSD: Analysis using Ichimoku 22/07/2020H4
On D1, the cloud is directing upward, indicating an uptrend. You can visually see how the triangle price correction model is forming.
Conclusion:
We recommend selling from the upper line of the triangle pattern when the RSI reaches the overbought level again.
Also, we recommend to close sell and open buy when the price reaches the range of $5,8 - $5,5, and the RSI reaches the oversold level.
H1
At H4, the cloud is directing upward, indicating an uptrend. RSI is in an undefined state.
Conclusion:
You can try to sell with a short stop loss when the RSI H1 reaches the overbought level. However, it should be borne in mind that the upward movement may be higher for H1. A great option is to sell according to the H4 scenario from the upper line of the triangle.
In the medium term, we should expect the price to rise to the level of $8, possibly higher.

ETC is looking for head and shoulders patternETC is going to retrace back after being rejected from weekly level on 1st test at 7252.
The candles followed three levels. ( Middle Trend Line, Bottom Trend Line and Monthly Horizontal Level).
The middle trend line acted as resistance throughout the downward trend, where as bottom trend line as well as at times monthly level acted as a support.
We can call bottom trend line and monthly level as DUAL SUPPORT for ETC.
Once Monthly support level broken on 07 may 2020, it became resistance, as on breaking monthly level candle has to find a support, which in this case was weekly support at 6383.
Current Condition
From 27 June 2020 to 05 July 2020, ETC was in accumulation zone, mean bullish move ahead was on cards, and it happened. During that bullish move, it broke the weekly level at 6383, and it had to find a new resistance which was the next weekly level at 7252.
ETC has found a new zone of support and resistance between two weekly levels, 7252 (Weekly Resistance) and (6383 Weekly support).
Weekly resistance and weekly support has been tested both for the first time, and right now we may see some retracement back to 7252 level.
If you want to enter the trade on daily candles, during the next week 10 to 12 percent rise is expected. You can trade long but must excite before 7252, as it can retrace back. making HEAD AND SHOULDERS PATTERN.
Lookout for Head and Shoulders pattern for now in coming 10 days.
Trade according to the pattern.

ETCUSD: Analysis using Ichimoku 12/07/2020H4
On D1, the cloud is directing upward, indicating an uptrend. The price also broke the downtrend line at D1.
Conclusion:
Locally, we recommend buying when the RSI reaches an oversold level on the H4 near the Fibonacci level of 61.8%.
H1
At H4, the cloud is directing upward, indicating an uptrend. The RSI is not far from the overbought level, indicating a possible continuation of the correction. Also, the divergence has formed on H1 between price and RSI.
Conclusion:
Selling ETC looks risky, since the correction model may take the form of a “triangle”, but you can use this setup and sell ETCUSD when RSI reach overbought level at H1. Stop loss must be set at 6.8.
Also, we recommend buying when the RSI reaches an oversold level on the H1 near level of 6.2.

Cryptocurrency Ethereum Classic buy signals.Ethereum Classic (ETC/USD), daily timeframe: Support line + Side of Bollinger bands + Harami + Dragonfly doji

ETC: Analysis using Ichimoku 06/06/2020H4
The visually visible upward channel, the borders of which in the near future will be tested by the price.
The ETC price is trading below the Ichimoku cloud, indicating a local correction.
RSI is near the oversold level, indicating the possibility of a change in trend.
Conclusion:
We recommend buying from the key Fibonacci support levels of 50% and 38.2%.
H1
Visually, the border of the downtrend is clearly visible.
The price slowly declines below the Ichimoku cloud.
The RSI is near the oversold level, indicating a possible end to the downward movement.
Conclusion:
We recommend buying when the RSI of the oversold level is reached, and also continuing to buy after the price is fixed above the downtrend line.
Good luck!

ETC $9+ by June 3rd $21 before January 1, 2021I know my charts are ugly but they make sense to me. I didn't go to school for finance so this isn't going to be some mathematical lexicon of jargon ridden "fairness". I believe in Charles Hoskinson and IOHK. I read the white paper because I was a part of the Ethereum ICO after "missing" my bitcoin opportunity at $600 or whatever the price was then. I've watched this guys moves since 2017 and while everyone else went crypto crazy he warned people and continued to work on scholarship. The Phoenix hardfork is happening on June 3rd. The most important part of the update is the interoperability of the ETC blockchain with other ETH client. I know many of you are just traders but these things are actually useful and there are some awesome Dapps so far and more to come. When Defi and Ethernet are commonly used the ETC blockchain will be one of the most valuable in the space because of IOHK's strict adherence to scholarship and principles or decentralization. Due to his past problems with voting and having his work stolen he's created incentives and systems to combat problems before they arise.

ETCUSDT LONGSignal
ETCUSDT
LONG
Open 5.1957,
SL 4.9174,
TP 6.4857,
Risk/Reward: 1/4.64,
Leverage: 2x

ETCUSD has formed bullish Shark | Upto 384% big bullish movePreviously I published a post on Ethereum Classic where the ETC was forming a bullish Butterfly and as per prediction after completion the ETC produced more than 270% big gains.
Formation of another harmonic pattern:
This time on again 2 day chart the price action of Ethereum Classic has formed a bullish Shark pattern and entered in potential reversal zone.
Buying And Sell Targets:
The buying and sell targets according to harmonic Shark pattern should be:
Buy between: $4.359 to $2.236
Sell between: $6.413 to $10.837
Stop Loss:
The potential reversal zone area which is up to $2.236 can be used as stop loss in case of complete candle sticks closes below this level.
This idea is for midterm and long term traders not a short term idea; I will be keep posting more trading ideas.
Note: This idea is education purpose only and not intended to be investment advice, please seek a duly licensed professional and do you own research before any investment.

The update for ETCUSD:10/03/2020 (review by SAVFinance)I expect the completion of correction in wave C-Minute and the beginning of price growth in the framework of wave 1-Minute.
Locally high probability of testing the lows.
Friends, support this idea with your Like and any Comment.
Thanks.

ETCUSD: Good prospect for the price increase (07/03/2020)I expect the start of an increase in the price of ETCUSD in the wave (v) of 1.
Friends, support this idea with your Like and any Comment.
Thanks.

ETCBTC - Buy 24/02/2020Friends, support this idea with your Like and any Comment. Thanks.
I expect the continuation of price growth of ETCUSD within the framework of wave (III) of (5).
Trade entry, take profit, stop loss levels are available to participants of the SAV Trading Room.
You will find more trading ideas in SAV Finance community.

ETC : Quick 50% Profit (Spot Trade)Hello Friend, back with another FULL TRADE.
If you are new to my posts, please hit like and give a follow if you find value. I am a budding FOREX/ CRYPTO trader, with much of my experience coming from trading CRYPTO markets since 2016. In my Full Trade Setups I provide the Market sentiment, Entry Strategies, Stop Loss and Target Points for the Category of trade I will be posting. Discussion section is included to point out to the Fundamental Outlook.
--- FULL TRADE INFO ----
Category : Short Term --- Spot Trade --- ALTCOIN-USD Pair.
Entry : Enter now or retest of triangle ceiling
Target Zone : $8 (confluence of weekly resistance + TD Sequential ceiling)
Stop Loss Type : Manual (Non Trailing given the volatility)
Stop loss zone: 1 Full body close below the triangle.
Market Sentiment : ETC would see multiple pump this season as the ETH adapts to ETH 2.0 with an ongoing debate of how this classic fork can help ETH with supplement the shift of algorithms. It's already completing the consolidation since quite few days and could blow off top soon.
--- END ---
Discussion : Given the BTC printed a bullish weekly HH disregarding most of the bearish case in coming months, this potential ETC which such high CT sentiment has high chance to play out.
Please hit the LIKE button friends for more such trades.
Do your own research. I only post trades I myself take. :) Enjoy. Will keep you gyz updated.

ETC Up And Trending!So ,it looks like ETC is rising and we can expect atleast a 10% rise in the price

When to buy ETC if we get a pull backETC is getting into oversold territory. Check out this daily RSI, ridiculous. I don't think I would short it with this type of strength, but we definitely want to keep an eye on it if it comes crashing down. As of right now just above the $5 area is the zone to look for.
Happy trading and hodling.
-Sherem

ETCUSD forming bullish Butterfly | Upto 100% move expectedThe price action of Ethereum Classic / US Dollar is forming bullish Butterfly pattern and soon it will be entered in potential reversal zone.
This PRZ area can be used as stop loss point in case the complete candle stick closes below this area.
I have used Fibonacci sequence to set the targets:
Buy between: 4.027 to 3.378
Sell between: 5.025 to 6.767
Enjoy your profits and regards,
Atif Akbar (moon333)


ETC/USD TARGET $12.393 (MASIVE 40% PUMP COMING ? )Entry at: $9.025
Risk Reward: 15.24
Stop loss: $8.804 ( -2.45%)

ETC 7 $ if...A crucial moment there must be ready! The ride can be violent. A big profit is in sight
I will update if I have more than 30 likes.


Trading plan ETCUSD 2.14.2019After the candlestick fixation of the model "pennant" abroad, buy with a target of 4.8.
