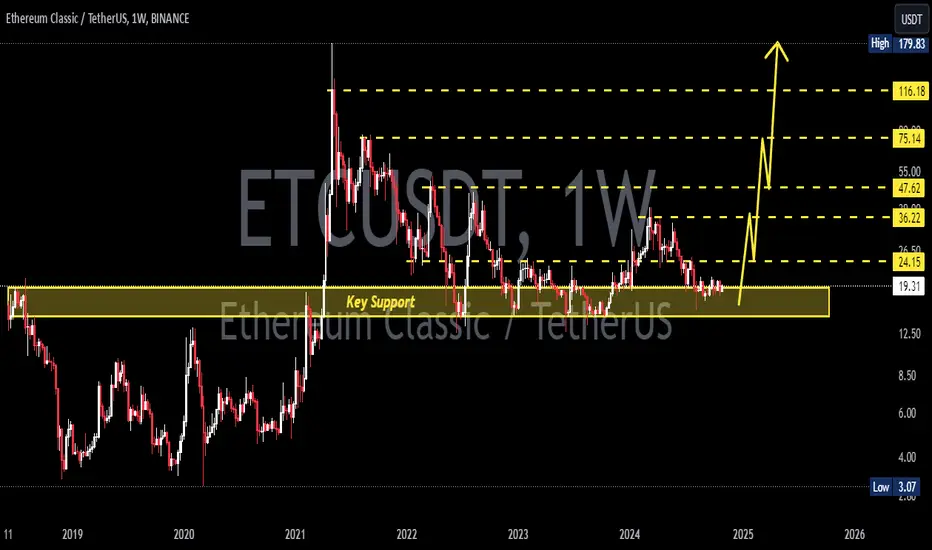
ETCUSDTETC ~ 1W
#ETC So far it continues to maintain this support block. Buy in stages here. with a target of at least 20%++ from here.
Etcusdtlong
ETC — August 2024 ATHBITFINEX:ETCUSD is not a clone of BITSTAMP:ETHUSD , but a continuation of the original Ethereum launched in 2015, which The Ethereum Foundation forked away from by launching a new protocol one year later in 2016.
Applications on BITFINEX:ETCUSD have been operating uninterrupted for a year longer than on Ethereum™, making ETC the longest-running and most reliable Smart Contract Platform.
This analysis suggests that BITFINEX:ETCUSD is likely to reach all-time high in August 2024.
NFA. DYOR.

ETCUSDTETC ~ 1W
#ETC If you have Conviction on this coin,. This is a great time to start buying again. So far this support block has been able to withstand selling pressure on sellers. this proves the Buyer is stronger.

Linkusdt on supportLinkusdt is on support level which is major support we have now and its looking bullish now

ETC ( Ethereum Classic ) tm:1hHello traders.
I hope you doing well.
These areas are based on my personal strategy and I will share it with you.
Open a sell position on the supply area or open a buy position on the demand area.
Your entry point, stop loss, and target point are based on money management and the amount of money in your trading account.
But I promise you that by trading in the areas of my trading strategy, you will definitely make a profit, because these areas, although they seem simple, are my experience of 8 years of learning and trading.
I hope you will achieve maximum continuous profit with me by using supply and demand areas.
Good luck traders.
Mohammad Goodarzi

#ETC/USDT#ETC
We have a bullish trend pattern on a 4-hour frame, the price moves based on it and adheres to its limits well
We have a tendency to stabilize above moving average 100
We have an uptrend on the RSI indicator that supports the price higher
Entry price is 26.00
The first goal is 27.87
Second goal 30.16
Third goal 32.15

ETC Holders! FOLLOW ME~!Good day, friends!
This is ESS team.
Let's see the ETCUSDT.
If Candle is supported by the lower GREEN uptrend line, We expect that candle breaks through the RED long-term downtrend line.
The waves that supported the lower GREEN uptrend line have broken through the downtrend line in the past.
If it fails to break through the RED long-term downtrend line this time, It may be expected to rise after accumulation from the ORANGE uptrend line.

ETCUSDT Bullish Opportunity with XABCD Harmonic PatternOverview:
ETC/USDT has exhibited the formation of an XABCD harmonic pattern, coinciding with price action nearing a crucial support zone. This confluence suggests a potential bullish reversal from point D, indicating favorable trading opportunities for market participants.
Key Technical Observations:
1. XABCD Harmonic Pattern: The chart analysis reveals the emergence of an XABCD harmonic pattern, characterized by distinct price swings that conform to Fibonacci ratios. This pattern indicates a potential reversal zone, with point D signaling a probable shift in market direction.
2. Key Support Area: Price action has approached a significant support area, enhancing the likelihood of a bullish rebound. The convergence of the harmonic pattern and the support zone strengthens the validity of the anticipated bullish move.
Trade Recommendations:
- Entry: Consider initiating a long position near 32.8150, aligning with the anticipated bullish reversal at point D of the harmonic pattern.
- Stop Loss: Implement a stop-loss order at approximately 31.1750 to mitigate potential losses in case of adverse price movements.
- Take Profit Targets:
1. TP-1: Set the first take-profit level at 34.5800 to secure profits as the price advances in the bullish direction.
2. TP-2: Aim for the second take-profit level at 36.1933 to capitalize on further upward momentum.
3. TP-3: Consider a third take-profit target at 37.8760 to maximize returns as the bullish trend potentially extends.
Risk Management:
Maintain prudent risk management practices by adhering to the specified stop-loss level and adjusting position sizes according to individual risk tolerance. Periodically reassess the market conditions to adapt trading strategies accordingly.
Conclusion:
In summary, the technical analysis of ETC/USDT suggests a favorable outlook for bullish opportunities, supported by the formation of an XABCD harmonic pattern and price action nearing a critical support area. Traders are advised to consider the provided trade setup, incorporating appropriate risk management measures to optimize potential returns while safeguarding against downside risks.

"Fly Like There Is No Tomorrow Left" #ETCETC is currently forming an Adam&Eve formation.
According to Elliot Waves Theory, this is the road map for ETC.
If you are using Leverage on your trades, wait for it to close above 34 in daily time frame.
Use only 2X, accept the fee and hold until the wave 3's final rotation which is 69.
If you are buying products like an investor, you will have 2 options;
-Buy now and wait until first target (69)
-Or simply buy and hold until second target which is 95 (it will take months)
Remember that it's a long term time frame and it will not be achieved in a couple days (I hope it would).
All Targets Specified On The Chart.
Good Luck To Us All.

#ETC/USDT#ETC
The price is moving in a descending channel on a 4-hour frame
It is expected that this channel will be broken upwards with stability above Moving Average 100
Entry price is 24.67
The first goal is 25.51
Second goal 26.28
The third goal 27.19

ETC Mar 3 UpdateOne of my favorite coins is in breakout mode!
Sharing this most recent chart from TTR. We are very long #ETC
And the long-term ETC chart update. I am looking for the C&H formation off $46-50 level.
The main targets are:
-
-
-
First target box got hit! Beautiful thing!

ETC Price PredictionI am bullish on this coin.pls save some profit after reaching t1 and put sl at entry.

SasanSeifi 💁♂ ETC / 3DAY⏩ 28$Hey everyone,
As you can see in the 3-day timeframe, the price has been rising from the demand zone and bullish order block. It broke the downtrend line and retraced back to the 22-dollar price range. It is currently trading at 22.30 dollars.
In the medium term, the price may continue to rise to the BEARISH BB zone.
Here are two scenarios we can consider:
1 The price could rise from the 22-dollar range.
2 The price could range between 21 and 20 dollars for a while, and then rise to the target ranges of 27 and 28 dollars.
If the price rises, it will be important to see how it reacts to the BEARISH BB zone. This will help us to understand the continuation of the trend.
⭕On the other hand, if the price breaks below the 20-dollar range and consolidates, it may be facing a correction.
I hope this helps!
🔵Remember, always conduct your analysis and consider other factors before making any trading decisions. Good luck!"✌️
❎ (DYOR)...⚠️⚜️
Sure, if you have any more questions or need further clarification, feel free to ask. I'm here to help!
if you found my analysis helpful, I would appreciate it if you could show your support by liking and commenting. Thank you!🙌✌

ETC/USDT 1W Bullish Long AnalysisAfter BITCOIN SPOT ETF approval, ETC has broken descending channel and seems to be bullish.
targets 35, 44, 52, 62
Invalid below 22

ETCUSDTETC is showing signs of consolidation after a period of sideways movement. Keep an eye out for a potential uptrend if the price consistently holds above the key support level.
My predict.
I hope it helps you find your entry point.
Not financial advice!

ETC is +173% profit in the long run.Hi everyone, it's time to talk about ETC.
For more than a year the asset has been in a large accumulation zone and the stopping factor for the price growth was the 200 day EMA and the descending trendline, which is one of the facets of a symmetrical triangle/descending triangle.
The price recently managed to consolidate above the EMA-200 but further growth was stopped by the downtrend line.
The price range is now maximally narrowed and on the background of the changed general market trend I expect a breakdown of the downtrend line and further movement to the important Fibo level of 0.236.
I plan to open positions also from 0.236 Fibo level.
Targets on the chart: 0.382 Fibo (+45%) 0.5 Fibo (+99%) and 0.618 Fibo (+173%).
Additionally on the chart I marked the price resistance/support levels with blue lines.
In the long term, we can expect an ATH update on the chart.
Also, if you have extra funds, you can place buy orders around $14-$16
This is not financial advice, everything you do you do at your own risk!

ETC/USDT shows signs of strength for a potential breakout.I anticipate the price to breach the trendline resistance, possibly resulting in a 15-30% upward movement in the short term. Let's monitor closely.
This idea is for educational purposes only and not financial advice. Always conduct your research before making any trading decisions.

ETC target 2612h time frame
-
ETC is breaking and retesting the bottom triangle and getting support at 0.5 Fibonacci Retracement. Considering the symmetrical structure and previous highs, there are lots resistance zones which will provide pressure for price. However, we can still set a trading plan woth good risk to reward ratio here.
TP: 26 / 38
SL: 17.295

ETCUSD fibonacci supportETCkeep climbing with bullish trendline, and found fibonacci support at $19.34
If trendline not broken, target at $23.394
Don't forget to support this analysis,
If you have any question, do not hesitate to contact me
Your support at this analysis will also support ETCUSD to reach bullish target
Click here to check my other analysis

Ethereum Classic (ETC) forming bullish BAT for the next pumpHi dear friends , hope you are well and welcome to the new update on Ethereum Classic (ETC) with US Dollar pair.
Previously we caught a nice trade of ETC as below:
Now on a 4-hr time frame, ETC is about to complete the final leg of a bullish BAT move.
Note: Above idea is for educational purpose only. It is advised to diversify and strictly follow the stop loss, and don't get stuck with trade.

ETCUSDTThe current situation of Ethereum Classic is as follows:
In general and in the long term, the trend is bearish, but in the medium and short term, we have seen a strong bullish trend that brought the price from the bottom of the descending channel to the top of the channel in less than 20 days.
Now we are witnessing a price decline from the top of the channel.
In my opinion, the $18 price level can be a suitable area to open a long position with the target being the top of the channel.
But why $18?
In this area, we have both the 0.5 Fibonacci retracement level and a region with high liquidity, which I have indicated on the chart with a blue box.
⚠️"Daily crypto market analyses I provide are personal opinions & not financial advice. Trading carries risks, so do your own research & seek advisor's help."
Don't forget to like and comment

ETC/USDT - Ethereum Classic: Resistance_Breakout_Confirmation◳◱ A Resistance Breakout and Confirmation has been detected on the SET:ETC / CRYPTOCAP:USDT chart. The price has broken above a key resistance level and has been confirmed by a strong candle, indicating a potential bullish trend. The next resistance key levels are located at 15.73 | 16.24 | 17.42, and the major support zones can be found at 14.55 | 13.88 | 12.7. Consider entering a trade at the current price zone of 18.96 and targeting higher levels.
◰◲ General info :
▣ Name: Ethereum Classic
▣ Rank: 30
▣ Exchanges: Binance, Kucoin, Bybit, Huobipro, Gateio, Poloniex
▣ Category/Sector: Infrastructure - Smart Contract Platforms
▣ Overview: Ethereum Classic is a decentralized computing platform designed to execute smart contracts, which are applications that run as programmed without the possibility of censorship or third-party interference. It is a distributed network consisting of a blockchain ledger, a native cryptocurrency (called ETC), and an ecosystem of on-chain applications and services. Ethereum Classic is the legacy chain that split from Ethereum following a contentious hard fork, known as The DAO fork, in Jul. 2017. Like its sister chain, Ethereum Classic features an execution engine optimized for smart contract processing (known as the Ethereum Virtual Machine or EVM) and a Proof of Work (PoW) consensus system. While it shares some aspects with Ethereum, Ethereum Classic offers a more defined monetary policy and inflation schedule.
◰◲ Technical Metrics :
▣ Mrkt Price: 18.96 ₮
▣ 24HVol: 41,062,576.734 ₮
▣ 24H Chng: 11.007%
▣ 7-Days Chng: 23.16%
▣ 1-Month Chng: 6.54%
▣ 3-Months Chng: -7.22%
◲◰ Pivot Points - Levels :
◥ Resistance: 15.73 | 16.24 | 17.42
◢ Support: 14.55 | 13.88 | 12.7
◱◳ Indicators recommendation :
▣ Oscillators: NEUTRAL
▣ Moving Averages: BUY
◰◲ Technical Indicators Summary : BUY
◲◰ Sharpe Ratios :
▣ Last 30D: -1.28
▣ Last 90D: -1.19
▣ Last 1-Y: 0.60
▣ Last 3-Y: 0.89
◲◰ Volatility :
▣ Last 30D: 0.58
▣ Last 90D: 0.47
▣ Last 1-Y: 1.00
▣ Last 3-Y: 1.21
◳◰ Market Sentiment Index :
▣ News sentiment score is N/A
▣ Twitter sentiment score is 0.67 - Bullish
▣ Reddit sentiment score is 0.40 - Bearish
▣ In-depth ETCUSDT technical analysis on Tradingview TA page
▣ What do you think of this analysis? Share your insights and let's discuss in the comments below. Your like, follow and support would be greatly appreciated!
◲ Disclaimer
Please note that the information and publications provided are for informational purposes only and should not be construed as financial, investment, trading, or any other type of advice or recommendation. We encourage you to conduct your own research and consult with a qualified professional before making any financial decisions. The use of the information provided is solely at your own risk.
▣ Welcome to the home of charting big: TradingView
Benefit from a ton of financial analysis features, instruments and data. Have a look around, and if you do choose to go with an upgraded plan, you'll get up to $30.
Discover it here - affiliate link -

ETC target 3812h time frame
-
ETC is still under the downtrend so far.
The best entry is wait for breakout and retest the structure.
TP: 38
SL: 16.8
