Full top down on BTC & ETH, Geronimo for nowIt seems we are being given a once in a lifetime opportunity to start from the bottom and get another chance to strike huge on the next ATH run!
ETH-D

Time to buy altcoins? Ether ready to crash toward $800 - $1200 Let's consider a different scenario real quick, something doesn't add up.
Ethereum is now trading above the most important support ever based on price action. This is marked with a purple line on the chart—the 0.786 Fib. retracement level. A price tag of $2,150. This support has been valid since 2023, it has been working nicely from Ethereum long-term. What if it breaks?
Something doesn't add up. I see many projects have been growing now for days, weeks and some even months. Some projects have been rising slowly for 1.5 months or more. Ethereum keeps on going down.
Think of this: All the major projects, including Bitcoin, challenged their April 2025 low support. Ethereum, not yet. All the projects challenged this support level and some went even lower.
The entire market went through a crash, a flush, all-time lows, etc., yet Ethereum is safely trading at a very strong higher low compared to April 2025. What happens if this level breaks?
We can't say that Ethereum is still trading above this level because it is super strong, it isn't. On the last bullish cycle, it managed only to produce a shy all-time high, nothing extraordinary.
What if instead of strong Ethereum is just late?
Prepare for a massive crash
A massive crash that will challenge and break April 2025, giving us a price of around $1,100 or even $800. Yes, the first target would be $1,400 on a flash crash once the current support breaks but then lower for sure.
Ethereum crashes all the way down and as soon as ~$1,000 is hit a recovery happens. This would be the end of Ethereum's bear market.
How is it possible for Ether to end its bear market months and months before Bitcoin?
In 2022 ETHUSDT hit bottom in June, Bitcoin did so in November. That's a five months difference. Things like this can happen easily.
Bitcoin is trading already way lower than Ethereum yet Bitcoin is many times stronger.
A sudden crash as I am theorizing here would mean something like a Black Swan event. It can happen. Hundreds of projects already went through a crash, hit new all-time lows and are now even growing for months. What happened with Ethereum, will it not crash? Or, is it just late?
I think it is late. We saw how the bigger projects crashed after the smaller ones.
Prepare...
This is positive though, once the bottom is in, we get growth long-term.
Thank you for reading.
Namaste.

Vitalik Just Killed the "L2 Narrative."The market is missing the biggest pivot in Ethereum history.
For the last two years, the "Smart Money" trade was to Long L2s and Short L1. That trade ended this week.
On February 3, Ethereum co-founder Vitalik Buterin published a seminal critique declaring that the "Rollup-Centric Roadmap" (L2s acting as branded shards) "no longer makes sense".
Why? Because Ethereum L1 is scaling faster than anyone expected, and "Generic L2s" are failing to decentralize. Today, we are going to analyze the Fundamentals (The Research) and the Technicals (The Charts) to prove why the rotation back to Mainnet has already begun.
__________________________________________________________________________________
1. THE FUNDAMENTAL SHIFT (L1 is the Captain Now) 🚢
The narrative that "L1 is unscalable" was shattered by the recent upgrades.
* The "Fusaka" Upgrade: This upgrade has already doubled the L1 Gas Limit to 60 Million . Developers are now targeting 200M gas later this year.
* The Reality: With L1 capable of handling 20-30 TPS at sub-2 gwei fees, the average user does not need to bridge to a centralized L2 anymore.
* The "Stage 2" Ultimatum: Vitalik explicitly stated that L2s relying on multisigs (Stage 1) are NOT scaling Ethereum.
The "Parasitic" Economics ⚠️
Why is this bearish for L2 tokens? Look at the revenue split.
* Base Revenue (2025): >$75 Million.
* Rent Paid to ETH: ~$1.52 Million.
* The Squeeze: Base is operating at a 98% profit margin . But with the new EIP-7918 , L2s will be forced to pay a "Price Floor" for blobs, crushing their margins and forcing revenue back to L1.
__________________________________________________________________________________
2. THE TECHNICAL PROOF (The Charts Don't Lie) 📉
The "Smart Money" is actively dumping L2 governance tokens to buy Spot ETHUSD .
A) ARBETH (The "Dilution" Chart)
This chart confirms the "L2 Death" thesis.
* Trend Strength: The ADX is at 63.6 (Weekly). This is not a dip; it is a violent, trending crash.
* Structure: Price is trading below every major EMA (20, 50, 200). We have broken all support.
* Target: The bearish structure points to a flush to the swing low at 0.000029 ETH (-51% from here).
B) OPETH (No Buyers)
* Price Action: We just printed a "Hammer" candle, but with Low Volume ($119k) . Without institutional volume, this is just a pause before the next leg down.
* Risk: If support breaks, there is no structural demand until 0.000063 ETH .
__________________________________________________________________________________
3. THE "COMEBACK KING" PLAY ( ETHUSD ) 💎
While L2s bleed, Ethereum is setting up for a "Generational Opportunity."
* The Zone: We are testing critical support at $2,112 (Bottom of the Bullish Order Block).
* The Signal: Weekly RSI is resetting at 30 (Oversold border).
* The Confirmation: ADX has dropped to 20 . This is the "Smoking Gun." It means the bearish trend momentum has died. Sellers are exhausted, and the reversal structure is building.
__________________________________________________________________________________
🎯 THE VERDICT
The "Pure Rollup" narrative is fading.
* Sell: Generic L2s ( ARBETH , OPETH ) -> They are losing their moat.
* Buy: Spot ETH (at $2,112 ) -> Captures the value of returning L1 users.
* Watch: Only "Specialized" L2s (like Fuel or Aztec) are safe from the pivot because they offer features L1 cannot (Privacy/UTXO).
Are you rotating back to Mainnet?
Vote Below! 👇
A) Yes, Long ETH (L1 is King) 💎
B) No, Long L2s (Fees are lower) ⚡

Ethereum has some proving to do before I flip bullishETH remains in a clear bearish structure after losing key higher-timeframe support. Price is trading below the major moving averages, which are now acting as dynamic resistance.
The highlighted zone above is a supply / value area where previous support flipped into resistance. Any move into that region should be treated as a reaction zone, not an automatic long.
Downside structure is still intact. The recent bounce looks corrective, not impulsive. Momentum is attempting to stabilize, but there is no confirmed structure shift yet.
Key takeaway
– Trend remains bearish
– Below HTF resistance
– Wait for a clear structure change before taking risk
– Best trades come after confirmation, not anticipation
Patience here matters. Wait for structure.

ETH Rebuy Zone (1D)Honestly, the key support levels have already been lost.
Considering the selling pressure, the bearish momentum, and the current candle structure, it appears that the bearish wave is likely to conclude within the green zone.
This corrective move will require time and proper base formation before any meaningful reversal to the upside can occur. A sustainable recovery is unlikely without consolidation and accumulation in this area.
The optimal approach in the green zone is to enter positions gradually using a DCA (Dollar-Cost Averaging) strategy, while avoiding any form of impatience or emotional decision-making. Rushing entries in such conditions significantly increases risk.
Above all, capital management and risk control remain the most critical factors in navigating this market phase.
If you have a coin or altcoin you want analyzed, first hit the like button and then comment its name so I can review it for you.
This is not a trade setup, as it has no precise stop-loss, stop, or target. I do not publish my trade setups here.

ETHUSDT Moves on weekly supportThe current situation for Ethereum remains tense and largely determines the mid-term direction of movement. The price has approached the 2.300-2.491 level, which formally appears to have been broken. However, until the market breaks out of its current accumulation and consolidates below, this range still maintains support status. This very moment marks the situation as borderline, as the structure has already weakened, but a final break has not yet occurred.
A noticeable feature of the current phase is extremely high volume activity from wheels. Both large bulls and bears regularly enter the market, indicating a fierce struggle for price control. This is not a passive sideways movement, but an active redistribution of positions, where neither side has yet gained a sustainable advantage. Such conditions often precede a strong momentum, but the direction of this momentum will directly depend on who is the first to break through key levels and consolidate.
If the price breaks out of the current accumulation and confirms consolidation below the 2,300-2,491 zone, the market will likely begin searching for deeper levels. The closest significant support in this scenario is the daily level of 1,647-1,655, where significant buying interest has historically been evident and where a new phase of stabilization or reversal could begin.
For bulls, the key objective is to hold the current weekly range and prevent a downward trend. If they manage to seize control and begin dominating volumes, ETH will have room to recover and further move higher. In this case, the logical target for volume distribution is the daily resistance of 2,774-2,788. This zone is where the next stage of the standoff should be expected, provided bears respond and once again attempt to seize the initiative. Until then, the market will remain in an active phase of the struggle, where volumes and the nature of consolidation at key levels will be decisive.

ETH levels of interest (Y26.Video1).More lows to comeHi traders,
I'm looking for more lows for ETH and likely many ALTS. For now, here are my thoughts.
All the best,
S.SAri

ETHEREUM Channel Down got oversold but this isn't the bottom!Ethereum (ETHUSD) is extending its losses as, following the January 14 rejection on its 1D MA100 (green trend-line), it made a Lower High on its 4-month Channel Down that kick-started the new Bearish Leg.
The 1D RSI turned oversold (below 30.00) for the first time since November 21 2025 but besides a (potential) short-term dead-cat-bounce towards the 0.382 Fibonacci retracement like on November 10 2025, it should bottom lower, at least at $1900 making a -44.80% decline (at least), similar to the previous Bearish Leg, before any meaningful longer term relief rally.
Technically, the strongest pressure zone (demand at this point) is the 1385 Support of the April 09 2025 Low.
---
** Please LIKE 👍, FOLLOW ✅, SHARE 🙌 and COMMENT ✍ if you enjoy this idea! Also share your ideas and charts in the comments section below! This is best way to keep it relevant, support us, keep the content here free and allow the idea to reach as many people as possible. **
---
💸💸💸💸💸💸
👇 👇 👇 👇 👇 👇

Coinranger|ETHUSDT. Reversal or continued decline?🔥News
🔹Today, the US votes on the government budget.
🔹US manufacturing PMI at 18:00 UTC+3
🔥ETH
🔹Fell below 2170. What now:
1️⃣ Above there is 2450, but the level is dynamic. We'll look at the averages.
2️⃣ Below there are 2090 and 1970 - levels on h4 and h16. But we won't necessarily reach there; a pullback could begin around the current level.
Any negative will push prices lower. Entry points from the current level are dangerous; we're waiting for one of the following scenarios (a pullback or a further decline).
---------------
Share your opinion in the comments!

ETH/USDT – Daily Chart Analysis. ETH/USDT – Daily Chart Analysis
The market is in a clear bearish trend.
Price is trading below the descending trendline, confirming seller dominance.
Strong support at $2,500 has been cleanly broken.
Current price is hovering near the $2,250–2,300 demand zone, showing weak bounce attempts.
Resistance:
$2,500 (major flip level)
$2,900–3,000
$3,300–3,400 (trendline resistance)
Support:
$2,250–2,200 (immediate)
$1,900
$1,420 (macro support)
$1,020 (extreme downside)
Daily close above $2,500 → possible relief rally toward $2,900–3,300.

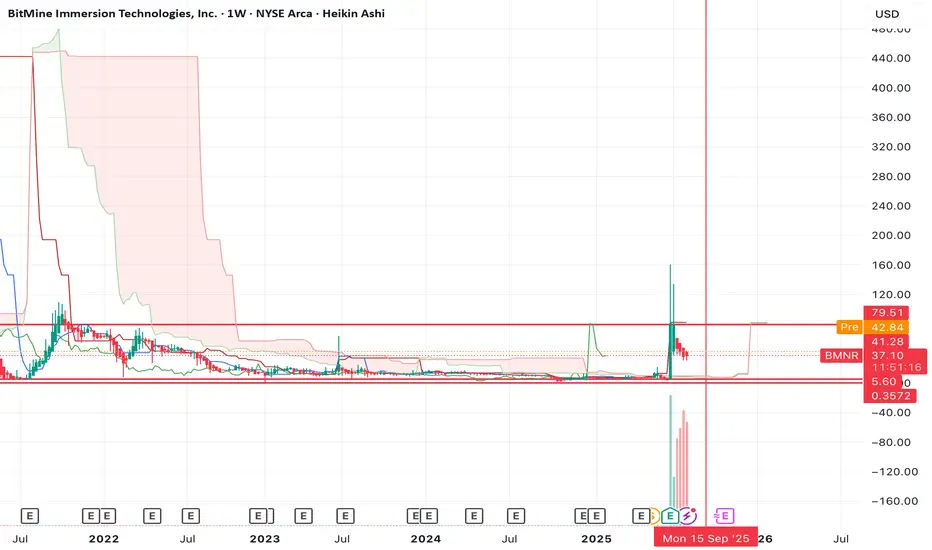
ETH is not having its "2017" moment, neither is BMNRDespite Tom Lee calling for ETH to $18k (which I happen to agree on btw), I think his timing is completely off. He's thinking that ETH is bullish here and that we're going to go to new highs this year.
I think the opposite. I think the top is already in for the year and that we're going to head to new lows first before we make our way to new highs.
BMNR doesn't look good either. The chart is bearish on the 3W and 1M timeframe with a bearish divergence on the RSI.
I think it's more likely that BMNR retests the lows before it sees any large pump.
Let's see how the chart plays out over the coming weeks/months.
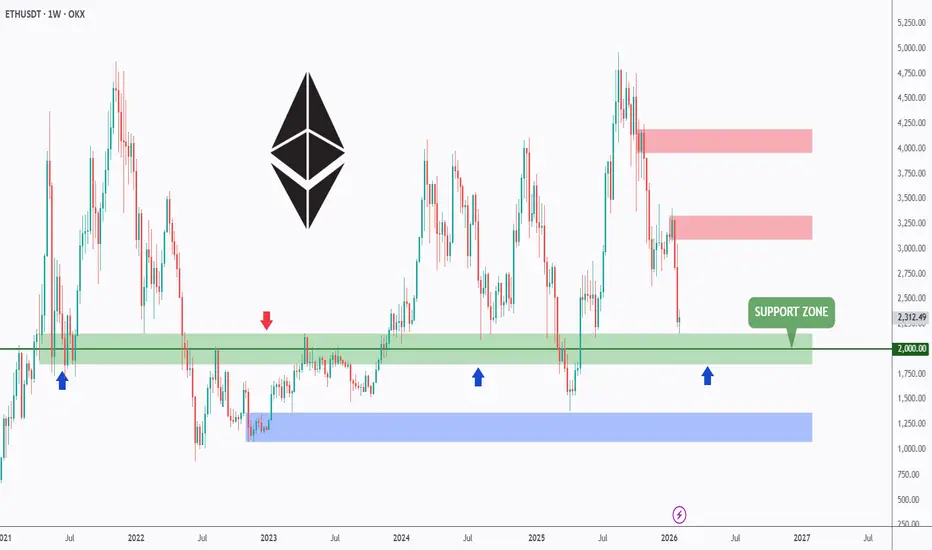
ETH at Big Support: Hold or Break?ETH is now retesting the $2000 support zone, a level that has acted as a major decision point multiple times in the past.
Each time ETH reached this area, the market paused, reacted, and chose its next direction carefully.
From a structure perspective, this is not a random level. It’s a long-term support that previously flipped roles between resistance and support, making it a key battlefield between buyers and sellers.
As long as this support holds, the focus remains on stabilization and potential recovery attempts from this zone.📈
But if this level fails, the door opens for a deeper move toward the lower demand area highlighted below.📉
Will buyers defend it one more time… or is this where the structure finally gives way? 👀
⚠️ Disclaimer: This is not financial advice. Always do your own research and manage risk properly.
📚 Stick to your trading plan regarding entries, risk, and management.
Good luck! 🍀
All Strategies Are Good; If Managed Properly!
~Richard Nasr.
Is Ethereum ready for another leg down to $2,000?Another day-trade setup on Ethereum. The $2,300 support range has broken—does this open the door for another leg down to $2,000? Bulls need to reclaim and hold above $2,330 to target $2,500.

Ethereum on 61%Ethereum is standing on 61% Fibonacci which is a very strong support now, there is a scenario to see ABC run to about 4k one more time

ETH/USDT 1W Long-term1️⃣ Market Structure (Most Important)
• We had an uptrend (trend line, higher lows)
• A breakout from the trend occurred
• Price did not return above the line → structure changed to BEARISH/distribution
📉 This is not a bullish correction, but a full breakout of the structure
⸻
2️⃣ Key Price Levels
🟢 Former Supports (Now Resistances)
• $4,015 – Major Weekly Supply ❌
• $3,435 – Strong Resistance after Distribution ❌
• $2,787 – Key Support ➜ Broken by Impulse
➡️ 2,787 = Now Resistance, Not Support
⸻
🔴 Current Situation
• Price: ~$2,340
• We are just above the local low
• Weak demand response, no strong Wicks
⸻
3️⃣ Momentum Indicators
🔹 Stochastic RSI
• Falling into oversold
• No clear upward crossover
📌 In a downtrend → not a long signal, but a warning for shorts
⸻
🔹 RSI (classic)
• Below 50
• Rejected from the mean
➡️ Bearish Momentum
⸻
4️⃣ Scenarios (realistic)
🔴 Baseline Scenario (60–70%)
• Short bounce to 2600–2800
• Rejection at former support
• Continuation of declines to:
• $2230 (local low)
• ~$2000 (psychological + liquidity)
• $1455 (weekly demand – (extreme)
⸻
🟡 Alternative scenario (30–40%)
• Defense 2230–2340
• Consolidation
• Attempt to return above 2787
❗ Only a weekly close > 2800 changes the bias

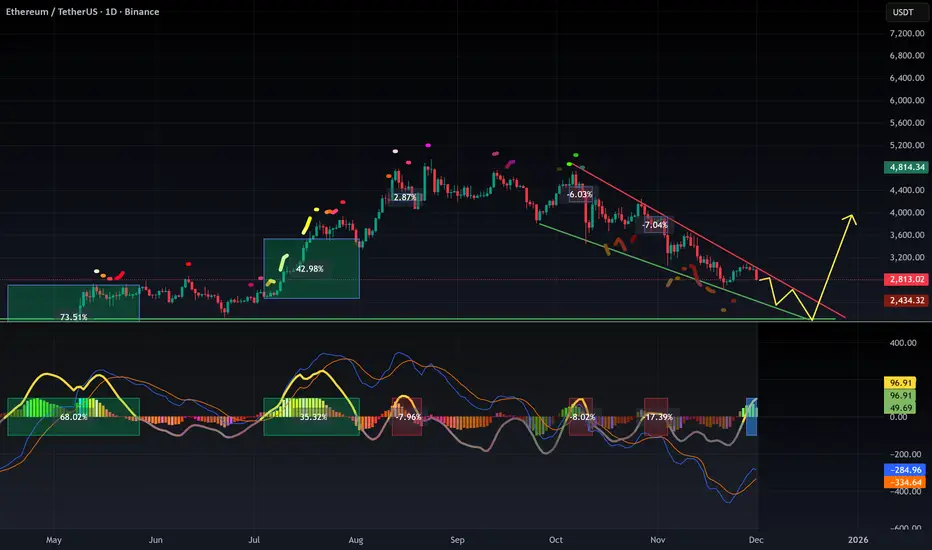
Ethereum —The highest volume (green) since May 2025We are now at the start of a bullish move. Keep in mind that a correction will follow this move and this correction is bound to end in a lower low, why? Because the chart now points to a lower high or double-top.
While I am showing several resistance zones, here we are not truly concerned right now with the next target. Can be a lower high or double-top or higher high, too early to say. What we do know is that a strong correction comes after the bullish wave.
The June 2025 support has been tested on a wick with a shy higher low. Most of the other big projects went all the way down to April 2025 but ETH behaved differently, this is very interesting and we will go deeper once the market starts to run.
Notice today's volume... This is it, this is the signal.
Today ETHUSDT is producing the highest buy-volume since August. It is likely that by the end of the day we will have the highest volume since May 2025. This tells us everything we need to know. This confirms the start of a very strong bullish wave.
Notice that just today Ethereum hit the lowest price in 225 days and today again the market turns bullish. The worst possible becomes the best possible. Crisis turns into opportunity. From the bottom we grow.
Stay true, stay tuned, stay alive... Thanks a lot for your continued support.
Keep trying, continue learning, keep on persisting and never give up.
The market is here to stay. It is no one's fault, we all make mistakes. From these mistakes, we can learn. This learning will be the basis for future success.
Thank you for reading.
Namaste.

Ethereum: relief rally or more downside? key levels to watchEthereum. Who else watching this knife finally stop spinning? After the brutal flush from the 3k area toward 2.2k, headlines talk about forced liquidations and a reset in leverage according to market sources. On that backdrop ETH on the 4H is parking right inside a major demand zone from December.
On the 4H chart we see price bouncing off 2.2k with a fat volume shelf below and a VPVR gap above into 2.4k. RSI was ultra oversold and is now turning up while price holds a slightly higher low - early bullish divergence. That combo for me points to a relief move rather than an instant new crash. I am leaning long toward 2.38k first, then 2.5k if shorts start to cover.
✅ Base plan: as long as 2.23k-2.25k support holds on 4H closes, I treat dips to 2.3k as buy-the-dip territory with targets 2.38k and 2.5k. More cautious traders can wait for a clean break and retest of 2.38k from above before stepping in. ⚠️ If 2.23k snaps and RSI dumps back under oversold, the structure flips and opens the door to 2.1k and maybe lower - I might be wrong, but I would not want to be holding longs there. I am flat for now, stalking either a sweep of 2.2k with strong rejection or a confirmed higher low before committing capital.

ETH: Gravity Still OnETH isn’t “crashing.”
It’s doing its job .
Zoom out and you’ll see the same thing repeating over and over:
lower highs → corrective bounces → unreached bearish C targets left behind .
Those Cs aren’t decoration.
They’re magnets .
Every time ETH tried to stabilize, it left another unfinished bearish sequence below. No proper resolution. No cleanup. Just more downside pressure stacking up.
That’s why every bounce feels weak.
That’s why upside keeps failing.
Price isn’t free to trend until this mess is resolved.
Right now:
Multiple HTF bearish Cs remain open
Structure keeps rolling over instead of reclaiming highs
Rallies look corrective, not impulsive
Until ETH clears these C target s, any bullish narrative is premature at best… and delusional at worst.
Could we bounce short-term? Sure. Markets breathe.
But structurally?
The draw is still down .
If ETH suddenly reclaims and holds above major broken structure, I’ll kill this idea myself. No ego attached.
Until then — unfinished business usually gets handled.
Bias : Bearish continuation
Focus : Unreached HTF C targets acting as draw on price

BMNR low liquidity movesAMEX:BMNR jumps all over the place for years between $4 and $300. Its a very low liquidity asset
I dont expect it do anything unless and CRYPTOCAP:ETH and CRYPTOCAP:BTC go into a new bull run.

Ethereum Lost Structure — Bearish Continuation Favored Ethereum has clearly shifted into bearish control on the 4H timeframe after a clean rejection from the $3,040–$3,080 resistance zone. That rejection was followed by a strong impulsive sell-off, confirming that the prior upside move was corrective rather than trend-reversing.
From a structural perspective, ETH is no longer rotating it is expanding to the downside.
Technical Breakdown
- Price failed decisively at the $3,040–$3,080 resistance zone
- ETH broke below the $2,935 key mid-range level
- Price is now trading below the declining EMA, confirming bearish trend alignment
- The recent bounce attempts are overlapping and weak, characteristic of bearish pullbacks, not accumulation
This sequence confirms a lower high → breakdown → continuation structure.
Primary Scenario (Bearish Continuation)
As long as Ethereum remains below $2,935, downside pressure dominates.
Key downside objectives:
First support test near $2,660
If that level fails to hold, price may extend toward $2,520–$2,550
Any short-term bounce into $2,760–$2,800 should be treated as corrective, not bullish, unless structure is reclaimed.
Invalidation / Reassessment
The bearish bias would only be questioned if ETH:
Reclaims $2,935 with strong acceptance
And follows through above $3,000
Without that, rallies are selling opportunities, not trend changes.
Ethereum is no longer in balance it has transitioned into markdown.
Until proven otherwise, the market is:
Below resistance
Below trend structure
Below momentum control
Let price confirm strength before calling a bottom. Structure comes first.

$ETH: Ethereum seems to be pointing toward a bottom at $...What I’m seeing on the daily chart is pretty clear:
The MACD is already deeply oversold, yet Ethereum continues to fall. Normally, such a setup would trigger a technical rebound — but the price action is not following.
This tells us one thing: bearish absorption.
Whales are unloading into every attempt to push upward, absorbing the buys and slowly forcing the price down. The ETH being sold is still changing hands, and until this process completes, CRYPTOCAP:ETH remains pressured to the downside.
Because the MACD is extremely oversold, we should expect some technical bounces — but opening a long here is extremely risky. Patience is better than gambling in a downtrend without support beneath your feet.
Right now, $2100 looks like the strongest support zone and a likely level for a meaningful bounce.
But in a broader bearish environment, even that bounce could just be a short-term relief before a new leg down or a reaccumulation phase.
So there’s no need to rush or FOMO into every green candle.
Bounces are normal — the trend remains bearish until ETH reaches the demand zone around $2100.
And if ETH doesn’t react at that level… that would be a very bad signal.
Statistically, $2100 has a high probability of being reached and acting as a solid reaccumulation zone.
DYOR
#Ethereum #ETH #CryptoAnalysis #TechnicalAnalysis #Altcoins #CryptoTrading #MACD #PriceAction #BearishTrend #SupportZone #CryptoMarket #BTC #CryptoNews
Ethereum Testing Key Support | Don’t Miss This Setup! (1D)📊 Ethereum Price Analysis | Strong Support Zone & Potential Bullish Reversal | Daily & Weekly Outlook
Ethereum is currently approaching a highly important and well-established support zone, which has historically acted as a strong demand area in the market. This level has proven to be reliable in previous price cycles and is now being tested once again.
Recently, Ethereum has swept major liquidity pools and triggered multiple stop-loss zones. Through consecutive bearish moves and strong downward momentum, the price has been driven toward this critical support region. This liquidity grab often signals a potential market reset and can precede a meaningful trend reversal.
Based on technical structure, price action, and market behavior, Ethereum is expected to react positively from the highlighted zone and potentially move toward the predefined upside targets. These targets are based on previous resistance levels, market structure breaks, and Fibonacci retracement confluences.
⚠️ Important Note on Timeframe:
This analysis is conducted on the daily timeframe, meaning that the projected movement is not expected to happen immediately. The full development of this scenario may take several weeks to play out. Patience and proper risk management are essential.
📈 Bullish Scenario:
If Ethereum holds above the marked support zone and shows strong buying pressure, a gradual bullish move toward the target areas is likely. Confirmation signals such as bullish engulfing candles, higher lows, or volume expansion will strengthen this outlook.
❌ Invalidation Level:
This analysis will be invalidated if a weekly candle closes below the defined invalidation level. Such a move would indicate a breakdown of market structure and could open the door for further downside continuation.
🔍 Key Takeaways:
Strong long-term support zone in focus
Liquidity sweep completed
Potential bullish reversal setup
Daily timeframe analysis (weeks to develop)
Weekly close below invalidation = bearish continuation
📌 Disclaimer:
This analysis is for educational purposes only and does not constitute financial advice. Always conduct your own research and manage risk appropriately.
If you would like us to analyze a coin or altcoin for you, first like this post, then comment the name of your altcoin below.

ETH: Monthly level. Possible pause before the next moveHi traders and investors!
The price is approaching the monthly level at 2,111.89.
Most likely, this will at least temporarily slow down the further decline.
The target within the monthly range is 1,385.05.
Profitable trades!
This analysis is based on the Initiative Analysis (IA) method.
