Ethereum Reclaims Structure from Support Ethereum on the H1 timeframe is showing clear signs of structural stabilization after completing a prolonged corrective phase. Following a sustained downtrend, price found firm support within a well-defined demand zone, where sell-side momentum was absorbed and downside continuation failed to materialize. This base-building process reflects accumulation rather than further distribution, setting the stage for a potential recovery sequence.
Price action has since transitioned from compression into a gradual bullish rotation, with higher lows forming above the support zone. The recent push higher signals improving buyer control, as ETH begins to reclaim short-term structure and distance itself from the demand area. This behavior suggests that the market is no longer in liquidation mode, but instead shifting toward a corrective-to-bullish phase.
If Ethereum continues to hold above the support zone and maintains higher lows, the first upside objective aligns near the 3,180 region, where prior intraday structure is located. Acceptance above this level would strengthen the recovery narrative and open the path toward the next resistance around 3,220, representing a more meaningful structural hurdle from the previous decline.
Beyond that, sustained bullish momentum could allow ETH to extend toward the upper resistance near 3,300, where higher-timeframe supply is expected to come into play. Reaching this area would confirm a broader mean-reversion move rather than a simple bounce, signaling that buyers have successfully regained control after the corrective phase.
However, failure to hold above the support zone would invalidate the recovery scenario and shift focus back toward range-bound behavior or renewed downside pressure. Until such a breakdown occurs, Ethereum appears technically positioned for a step-by-step recovery, with the current structure favoring continuation as long as demand remains defended.
ETH

Ethereum Has Broken Structure — The Pullback Will Decide Hello Traders....
COINBASE:ETHUSD on the H1 timeframe has just completed a clean bullish structure break, marked by a strong impulsive candle that decisively pushed price above the previous consolidation range. This breakout confirms that buyers have taken control after a prolonged accumulation phase, shifting market structure from neutral to bullish expansion. However, following such a sharp move, price is now entering a post-breakout consolidation, hovering just above the broken level a typical behavior where the market pauses to absorb liquidity and rebalance positioning. The highlighted “break” zone around 3,300 now acts as a critical support flip area, and as long as price continues to hold above this level, the bullish thesis remains intact. From a structural perspective, the most constructive scenario is a controlled pullback toward the 3,200–3,180 support zone, where previous resistance and the moving average converge, before buyers step in again to drive continuation. If this pullback is respected, Ethereum has a clear upside roadmap toward the next liquidity targets around 3,400, then 3,475, with potential extension even higher if momentum accelerates. Any short-term retracement should therefore be viewed as healthy price development, not weakness. Only a decisive break and acceptance back below the reclaimed support would invalidate this bullish setup and shift the market back into a deeper corrective phase.
what do you think about ETHUSDT?

ETH Pauses at Resistance After Vertical ExpansionHi Guys!! On the H1 chart, Ethereum has just completed a strong vertical bullish expansion, breaking decisively above the EMA structure and leaving behind a clear price imbalance. This type of impulsive move typically signals aggressive buy-side participation, but it also creates unfinished business below, where liquidity and inefficient pricing remain. After the surge, price is now consolidating tightly beneath a well-defined resistance zone around 3,360–3,375, showing hesitation rather than immediate continuation. This behavior suggests that buyers are no longer chasing at premium levels, while sellers are beginning to respond into resistance.
The current consolidation should be read as a distribution-to-correction phase, not an outright trend reversal. Price is holding above the short-term base, but the lack of follow-through above resistance indicates that the market may first seek sell-side liquidity resting below the structure. The highlighted liquidity zone around 3,220–3,200 aligns with prior consolidation and the EMA 89 region, making it a natural draw for price to rebalance before any sustainable continuation. A corrective move into this zone would be technically healthy, allowing the market to mitigate the imbalance created by the impulsive rally.
If ETH rotates lower into the liquidity zone and shows acceptance with slowing bearish momentum, that area becomes a high-probability region for buyers to re-engage, setting the stage for a renewed push back toward resistance and potentially higher levels. Conversely, only a clean acceptance above the resistance zone with strong bullish displacement would invalidate the corrective expectation and open the door for immediate continuation. Until that happens, Ethereum remains in a post-expansion consolidation, with downside liquidity acting as the primary magnet before the next directional move.

ETH Breaks: Is This the Launchpad for the Next Impulsive Rally?Ethereum has just delivered a clean impulsive breakout, shifting the short term structure from compression into expansion. The current price action is no longer random it is reacting precisely to key structural levels, and this gives us a very clear framework for the next move. After a prolonged range and base-building phase, ETH respected the lower demand zone and EMA support before accelerating higher. The breakout candle was strong, decisive, and came with clear displacement, confirming that buyers are in control for now.
Key Technical Observations
Price has now broken above the prior range high (~3,220–3,250), which previously acted as a supply / resistance area. This zone has flipped into new support, and current consolidation above it is a bullish sign, not weakness.
The EMA is starting to slope upward again, reinforcing the idea that momentum is transitioning back to the upside.
Bullish Scenario (Primary Bias)
As long as price holds above the broken structure / support zone, the bullish continuation remains valid. The projected path suggests:
- A shallow pullback or consolidation above support
- Followed by continuation toward higher liquidity
Upside objectives:
- First expansion toward the mid-range highs
- Then continuation into the upper resistance / liquidity zone near 3,450–3,480
This type of structure — impulse → hold → continuation — is typical of markets preparing for another leg higher.
Bearish Scenario (Alternative)
If price fails to hold above the flipped support and re-enters the prior range, the bullish setup weakens. In that case:
- Expect a deeper retracement toward 3,170
- Extended downside could target the lower demand zone near 3,080
This would signal a false breakout rather than continuation.
Conclusion
ETH is currently at a decision point, but the structure favors buyers. The market has already shown its hand with strong displacement, and unless support is lost, dips are likely to be corrective, not trend-ending.
This is no longer a ranging market. ETH is transitioning back into expansion mode.
Patience now is key: let the pullback confirm, then follow the direction of strength.

Ethereum Has Rallied Straight Into Supply — A Healthy Pullback IHello Future Millionaire!!!
COINBASE:ETHUSD on the M30 timeframe has just completed a strong impulsive bullish expansion, breaking out of its prior range and pushing price directly into a clearly defined supply zone around 3,360–3,380. This rally was sharp and decisive, signaling aggressive buy-side participation and confirming a short-term bullish shift in structure. However, after such a vertical move, price is now stalling beneath supply, forming small bodied candles and overlapping ranges a classic sign of momentum pause and profit taking, not immediate continuation. Importantly, this is not distribution at the lows; it is post impulse digestion at highs, where the market evaluates whether it has enough fuel to continue higher or needs to rebalance first.
From a structural and liquidity perspective, the current behavior strongly favors a pullback scenario rather than an immediate breakout. Liquidity is clearly resting below the market, and the most logical draw is the demand zone around 3,140–3,175, which aligns with the origin of the impulsive move and represents an area where unfilled buy orders are likely waiting. A rotation lower into this demand zone would be considered healthy price action within a bullish context, allowing the market to reset momentum, shake out late longs, and rebuild structure. Only after such a pullback and a clear higher-low reaction would Ethereum be positioned for a sustainable continuation back toward the supply zone and potentially beyond.
As long as price remains below the supply zone, chasing longs here carries elevated risk. The higher-probability roadmap is supply rejection → pullback into demand → bullish reaction → continuation. Only a clean break and acceptance above the supply zone would invalidate the pullback thesis and signal immediate continuation. Until then, patience is key. COINBASE:ETHUSD is not reversing, it is rebalancing after strength.

Ethereum Just Exploded Higher — But This Is Where Smart Money 1. Current Market Structure
COINBASE:ETHUSD has just printed a strong bullish displacement on the H1 timeframe, breaking out of its prior consolidation with a wide-range impulsive candle. This move clearly shifted short-term structure from neutral to bullish expansion, confirming that buyers have taken control. However, after such a vertical move, price is now transitioning into a post-impulse consolidation phase just below the recent highs. This is not weakness it is a typical pause where the market digests gains, absorbs late buyers, and decides whether to continue higher or rotate lower for rebalancing.
2. Key Zones & Market Positioning
Price is currently holding above a critical breakout level around 3,300, which now acts as the first line of support. Above price, the immediate resistance zone is located around 3,370 – 3,375, where supply previously entered and where the market is currently stalling. Below, multiple downside levels are clearly defined as potential reaction zones if a pullback unfolds:
Target 1 / First Support: ~3,299
Target 2 / Mid Support: ~3,253
Target 3 / Deeper Support: ~3,180 – 3,140
As long as price holds above the 3,300 zone, the bullish breakout remains structurally valid.
3. Liquidity & Price Behavior
The impulsive candle likely swept buy side liquidity and triggered breakout participation. Current small bodied candles near the highs indicate indecision and profit-taking, not aggressive selling. Liquidity is now clearly stacked below the market, making a pullback into lower support zones a natural mechanism to rebalance before any sustained continuation. This behavior aligns with post-expansion rebalancing, not distribution at the top.
4. Today’s Market Scenario
🔼 Primary Scenario – Bullish Continuation After Pullback
The preferred scenario is a controlled pullback into the 3,300 – 3,250 zone, followed by a higher-low formation. If buyers defend these levels, ETH could rebuild momentum and attempt another push toward the 3,370 – 3,380 resistance, potentially extending further if acceptance occurs.
🔽 Alternative Scenario – Deeper Rebalance
If price fails to hold above 3,300, a deeper corrective move toward 3,180 or even 3,140 becomes likely. This would still be considered a healthy correction within a bullish structure, provided no strong bearish displacement occurs.
5. Trading Perspective
Bias remains short-term bullish, but execution must be patient. This is not an area to chase price after the impulse. The optimal approach is to wait for pullbacks into key support zones and observe buyer reaction. The market is not collapsing it is deciding how much liquidity it needs before the next directional leg.
Summary
Ethereum has completed a clean bullish breakout, but is now in a decision phase just below resistance. As long as 3,300 holds, the roadmap remains constructive:
Impulse → Consolidation → Pullback → Continuation
The next move will be defined not by

Ethereum H4 | Bearish Reversal Off Key LevelThe price could rise to our sell entry level at 3,410.61, which is an overlap resistance that aligns with the 141.4% Fibonacci extension and slightly above the 61.8% FIbonacci projection.
Our stop loss is set at 3,575.81, which is a pullback resistance.
Our take profit is set at 3,150.72, which is a pullback support that aligns with the 38.2% Fibonacci retracement.
High Risk Investment Warning
Stratos Markets Limited (

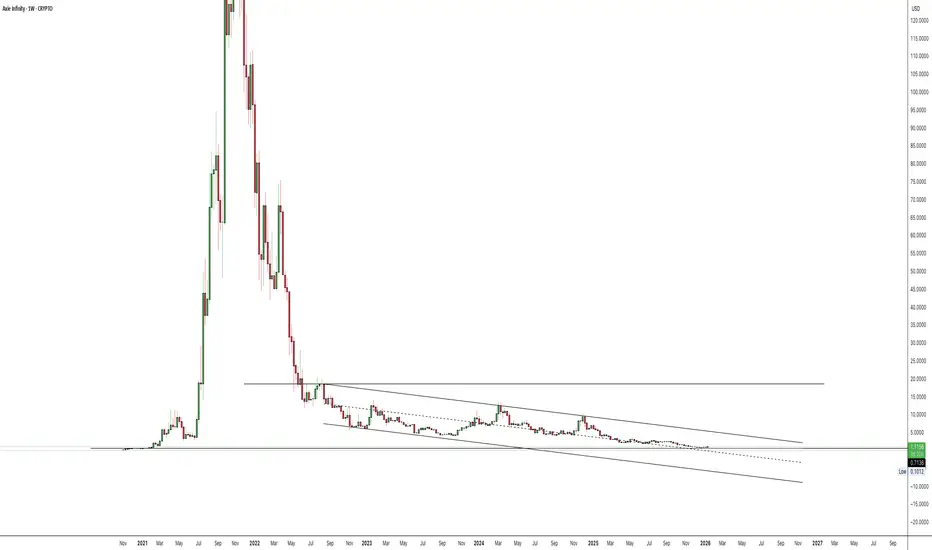
AXS – From Bubble Graveyard to Loaded Spring?While most of CT is begging for “altseason,” I’m hunting the forgotten bubble charts – and NYSE:AXS is one of the juiciest.
Since the 2021 vertical blow-off, price has bled inside a clean falling channel, volatility crushed and volume dying out. Each rally has been weaker, but the compression at the bottom of the channel now looks more like quiet accumulation than fresh distribution.
Key points from the chart:
• Multi-year downtrend contained inside a broad descending channel.
• Price riding the lower boundary with a tight, flat range = seller exhaustion vibes.
• Any sustained breakout above the midline of the channel opens the door for a sharp mean-reversion move back toward prior breakdown levels.
• Invalidation for my idea is a clean weekly close outside the bottom of the channel – that would say “one more leg down” instead of “spring.”
I’m not calling for a full 2021 repeat, but structurally this is the kind of compressed, forgotten chart that can move violently when liquidity rotates.
I’ll let the market choose direction—but if buyers step in, this thing can travel a long way in a short time.
Manage risk, don’t chase green candles… and enjoy the ride. 🚀
Bitcoin at the Late Cycle CrossroadsLooking at the Bitcoin Daily chart, this structure fits extremely cleanly into the historical 4 year cycle framework, and when combined with macro liquidity conditions, it strongly suggests the market is transitioning from a markup → distribution → corrective phase, rather than preparing for an immediate exponential continuation. Across previous cycles (2013–2014, 2017–2018, 2021–2022), Bitcoin consistently topped within a rising channel, formed a series of higher timeframe bull traps, and then broke down toward the lower bound of macro support zones. The current structure is visually and behaviorally consistent with those historical precedents.
From a pure price structure perspective, Bitcoin has already completed a full impulsive expansion from the cycle low, followed by accelerated upside inside a rising channel. The highlighted orange circles on the chart mark exhaustion zones, where price pushed above trend resistance but failed to sustain acceptance. These areas historically represent late-cycle FOMO participation, where retail demand enters aggressively while smart money distributes into strength. The current price action mirrors that behavior: price remains elevated inside a channel, but momentum has clearly slowed, volatility is compressing, and bullish continuation lacks conviction.
The most important technical element on this chart is the bull trap zone marked in blue. This zone represents a scenario where price appears to be holding bullish structure but is, in reality, trading above fair value relative to liquidity distribution. In past cycles, these zones repeatedly resolved lower once macro liquidity tightened or sentiment shifted. The projected downside target toward the $60,000–$54,000 support region aligns with prior range highs, long-term demand imbalance, and historical cycle retracement depth. Importantly, this is not a bearish collapse thesis. it is a mean reversion and re-accumulation thesis, consistent with how Bitcoin resets before its final cycle leg.
From a macro standpoint, conditions are no longer as supportive as they were during the early phase of the rally. Global liquidity growth has slowed, real yields remain elevated, and central banks are transitioning from aggressive easing expectations to a more cautious stance. Historically, Bitcoin performs best when liquidity is expanding rapidly, not merely stabilizing. At the same time, ETF driven inflows have largely been front-loaded, meaning marginal demand is weakening while supply distribution increases. This combination frequently produces sideways to down corrective price action, rather than vertical upside continuation.
When combining cycle theory, macro liquidity, and technical structure, the most logical interpretation is that Bitcoin is likely entering a corrective cycle phase, not the end of the bull market, but a reset within it. A deeper pullback into the highlighted support zone would allow the market to flush weak hands, rebalance leverage, and rebuild a stronger base for the next expansion. Only a sustained acceptance above the upper channel, with expanding volume and renewed macro liquidity acceleration, would invalidate this scenario.
In short, this chart does not argue for panic or blind bearishness. it argues for discipline and patience. Late cycle rallies reward sellers, not chasers. The professional trader reads this structure as a warning: risk is asymmetric at the highs, and opportunity improves significantly closer to structural support, not inside premium distribution zones.

ETH — Price Slice. Capital Sector. 3605.61 BPC 5© Bolzen | The Architect | BPC Framework
Bolzen Market Institute
🏷 ETH — Price Slice. Capital Sector.
TradingView Publication Date: 15.01.2026
🏷 3605.61 — price not yet reached at time of publication.
🏷 BPC — The Bolzen Price Covenant — Strength Index: 5
Quantum structure of obligations and capital flow in price formation via energy blocks.
🏷 Vertical chart — Energy Grid Dashboard.
🏷 Static Stream 1: price published in energy-block production sequence.
🏷 The price energy block is already ordered—not by time, but by execution priority. Crucially: block priority dynamically reconfigures in response to hidden energetic impulses, whereas price execution order records their market manifestation. Every price in the dynamic stream is tied to proprietary energy-production metrics inaccessible to the general public. Those who perceive structure before its manifestation do not follow price—they anticipate it.
EΞ2Φ8Ψ45Θ·ζ⁻¹·106Λ732·Ω²
📎 Screenshot:
🏷 When trading from levels, use liquidity zones from BPC 10 and above.
🏷 Bolzen Liquidity Map — ETH (numerical equivalent):
🏷 I. Interactive Reference Guide: BPC — The Bolzen Price Covenant
🏷 P.S. English is not my native language — I offer no apologies for stylistic imperfections. What you see here is not a post. It is a demonstration of another level of preparation: the symbiosis of human intuition and algorithmic precision. Mathematics and aggressive market analysis — against the machine of liquidations.
The persistent ETH and BTC Energy Grid Dashboard remains publicly accessible and is intended for international institutional review.
— The Architect
BPC — The Bolzen Price Covenant

BMEX – The OG Perps Token Coiling for a Violent Mean-ReversionBitMEX birthed the perp casino long before Binance, Bybit and the rest. Its token has done what most neglected OGs do after launch: bleed inside a clean descending channel while nobody cares.
Now:
• Price has been grinding along the lower half of the channel and just put in a rounded base near the lows.
• Each push down is getting shallower, while bounces are stretching further – classic late-stage compression.
• A reclaim of the mid-channel (dotted line) opens the door for a full channel mean-reversion, with room toward the upper boundary and beyond if we see real FOMO.
In a market where new shiny memes keep rug-pulling, I’m watching the forgotten infra plays – and BMEX fits that bill: OG perp venue, tiny cap, ugly chart that finally looks ready to flip.
I’m not chasing green candles here; I’m stalking the channel break + retest for confirmation. Until then, this sits on my “potential face-melter” list.
As always: not advice, just the map. Trade your own plan.

ETH — Price Slice. Capital Sector. 3589.46 BPC 7.4© Bolzen | The Architect | BPC Framework
Bolzen Market Institute
🏷 ETH — Price Slice. Capital Sector.
TradingView Publication Date: 15.01.2026
🏷 3589.46 — price not yet reached at time of publication.
🏷 BPC — The Bolzen Price Covenant — Strength Index: 7.4
Quantum structure of obligations and capital flow in price formation via energy blocks.
🏷 Vertical chart — Energy Grid Dashboard.
🏷 Static Stream 1: price published in energy-block production sequence.
🏷 The price energy block is already ordered—not by time, but by execution priority. Crucially: block priority dynamically reconfigures in response to hidden energetic impulses, whereas price execution order records their market manifestation. Every price in the dynamic stream is tied to proprietary energy-production metrics inaccessible to the general public. Those who perceive structure before its manifestation do not follow price—they anticipate it.
EΞ2Φ8Ψ45Θ·ζ⁻¹·106Λ732·Ω²
📎 Screenshot:
🏷 When trading from levels, use liquidity zones from BPC 10 and above.
🏷 Bolzen Liquidity Map — ETH (numerical equivalent):
🏷 I. Interactive Reference Guide: BPC — The Bolzen Price Covenant
🏷 P.S. English is not my native language — I offer no apologies for stylistic imperfections. What you see here is not a post. It is a demonstration of another level of preparation: the symbiosis of human intuition and algorithmic precision. Mathematics and aggressive market analysis — against the machine of liquidations.
The persistent ETH and BTC Energy Grid Dashboard remains publicly accessible and is intended for international institutional review.
— The Architect
BPC — The Bolzen Price Covenant

ETH — Price Slice. Capital Sector. 3525.90 BPC 6.3© Bolzen | The Architect | BPC Framework
Bolzen Market Institute
🏷 ETH — Price Slice. Capital Sector.
TradingView Publication Date: 15.01.2026
🏷 3525.90 — price not yet reached at time of publication.
🏷 BPC — The Bolzen Price Covenant — Strength Index: 6.3
Quantum structure of obligations and capital flow in price formation via energy blocks.
🏷 Vertical chart — Energy Grid Dashboard.
🏷 Static Stream 1: price published in energy-block production sequence.
🏷 The price energy block is already ordered—not by time, but by execution priority. Crucially: block priority dynamically reconfigures in response to hidden energetic impulses, whereas price execution order records their market manifestation. Every price in the dynamic stream is tied to proprietary energy-production metrics inaccessible to the general public. Those who perceive structure before its manifestation do not follow price—they anticipate it.
EΞ2Φ8Ψ45Θ·ζ⁻¹·106Λ732·Ω²
📎 Screenshot:
🏷 When trading from levels, use liquidity zones from BPC 10 and above.
🏷 Bolzen Liquidity Map — ETH (numerical equivalent):
🏷 I. Interactive Reference Guide: BPC — The Bolzen Price Covenant
🏷 P.S. English is not my native language — I offer no apologies for stylistic imperfections. What you see here is not a post. It is a demonstration of another level of preparation: the symbiosis of human intuition and algorithmic precision. Mathematics and aggressive market analysis — against the machine of liquidations.
The persistent ETH and BTC Energy Grid Dashboard remains publicly accessible and is intended for international institutional review.
— The Architect
BPC — The Bolzen Price Covenant

ETH — Price Slice. Capital Sector. 3698.53 BPC 23© Bolzen | The Architect | BPC Framework
Bolzen Market Institute
🏷 ETH — Price Slice. Capital Sector.
TradingView Publication Date: 15.01.2026
🏷 3698.53 — price not yet reached at time of publication.
🏷 BPC — The Bolzen Price Covenant — Strength Index: 23
Quantum structure of obligations and capital flow in price formation via energy blocks.
🏷 Vertical chart — Energy Grid Dashboard.
🏷 Static Stream 1: price published in energy-block production sequence.
🏷 The price energy block is already ordered—not by time, but by execution priority. Crucially: block priority dynamically reconfigures in response to hidden energetic impulses, whereas price execution order records their market manifestation. Every price in the dynamic stream is tied to proprietary energy-production metrics inaccessible to the general public. Those who perceive structure before its manifestation do not follow price—they anticipate it.
EΞ2Φ8Ψ45Θ·ζ⁻¹·106Λ732·Ω²
📎 Screenshot:
🏷 When trading from levels, use liquidity zones from BPC 10 and above.
🏷 Bolzen Liquidity Map — ETH (numerical equivalent):
🏷 I. Interactive Reference Guide: BPC — The Bolzen Price Covenant
🏷 P.S. English is not my native language — I offer no apologies for stylistic imperfections. What you see here is not a post. It is a demonstration of another level of preparation: the symbiosis of human intuition and algorithmic precision. Mathematics and aggressive market analysis — against the machine of liquidations.
The persistent ETH and BTC Energy Grid Dashboard remains publicly accessible and is intended for international institutional review.
— The Architect
BPC — The Bolzen Price Covenant

ETH — Price Slice. Capital Sector. 3602.93© Bolzen | The Architect | BPC Framework
Bolzen Market Institute
🏷 ETH — Price Slice. Capital Sector.
TradingView Publication Date: 15.01.2026
🏷 3602.93 — price not yet reached at time of publication.
🏷 BPC — The Bolzen Price Covenant — Strength Index: 4
Quantum structure of obligations and capital flow in price formation via energy blocks.
🏷 Vertical chart — Energy Grid Dashboard.
🏷 Static Stream 1: price published in energy-block production sequence.
🏷 The price energy block is already ordered—not by time, but by execution priority. Crucially: block priority dynamically reconfigures in response to hidden energetic impulses, whereas price execution order records their market manifestation. Every price in the dynamic stream is tied to proprietary energy-production metrics inaccessible to the general public. Those who perceive structure before its manifestation do not follow price—they anticipate it.
EΞ2Φ8Ψ45Θ·ζ⁻¹·106Λ732·Ω²
📎 Screenshot:
🏷 When trading from levels, use liquidity zones from BPC 10 and above.
🏷 Bolzen Liquidity Map — ETH (numerical equivalent):
🏷 I. Interactive Reference Guide: BPC — The Bolzen Price Covenant
🏷 P.S. English is not my native language — I offer no apologies for stylistic imperfections. What you see here is not a post. It is a demonstration of another level of preparation: the symbiosis of human intuition and algorithmic precision. Mathematics and aggressive market analysis — against the machine of liquidations.
The persistent ETH and BTC Energy Grid Dashboard remains publicly accessible and is intended for international institutional review.
— The Architect
BPC — The Bolzen Price Covenant

ETH — Price Slice. Capital Sector. 3500.39 BPC 3.3© Bolzen | The Architect | BPC Framework
Bolzen Market Institute
🏷 ETH — Price Slice. Capital Sector.
TradingView Publication Date: 15.01.2026
🏷 3500.39 — price not yet reached at time of publication.
🏷 BPC — The Bolzen Price Covenant — Strength Index: 3.3
Quantum structure of obligations and capital flow in price formation via energy blocks.
🏷 Vertical chart — Energy Grid Dashboard.
🏷 Static Stream 1: price published in energy-block production sequence.
🏷 The price energy block is already ordered—not by time, but by execution priority. Crucially: block priority dynamically reconfigures in response to hidden energetic impulses, whereas price execution order records their market manifestation. Every price in the dynamic stream is tied to proprietary energy-production metrics inaccessible to the general public. Those who perceive structure before its manifestation do not follow price—they anticipate it.
EΞ2Φ8Ψ45Θ·ζ⁻¹·106Λ732·Ω²
📎 Screenshot:
🏷 When trading from levels, use liquidity zones from BPC 10 and above.
🏷 Bolzen Liquidity Map — ETH (numerical equivalent):
🏷 I. Interactive Reference Guide: BPC — The Bolzen Price Covenant
🏷 P.S. English is not my native language — I offer no apologies for stylistic imperfections. What you see here is not a post. It is a demonstration of another level of preparation: the symbiosis of human intuition and algorithmic precision. Mathematics and aggressive market analysis — against the machine of liquidations.
The persistent ETH and BTC Energy Grid Dashboard remains publicly accessible and is intended for international institutional review.
— The Architect
BPC — The Bolzen Price Covenant

Bitcoin | Grand Finale Printed – Now Enjoy the Ride DownOn this chart I’ve mapped Bitcoin’s full impulsive structure from 2017–2025 as a completed 5-wave advance. We’ve tagged the (V) top, and what’s forming now looks like the early stages of a larger degree A/B/C – with the local (1)(2) already in and real downside still ahead.
• The prior rallies were clean impulse legs; this last stretch has all the signatures of an exhaustion wave (extended 5th, blow-off structure, and failed follow-through).
• Current bounce fits perfectly as a wave (2) retrace after the first leg down – textbook spot where late bulls feel “saved” while smart money quietly exits.
• Ahead of us I’m expecting a multi-year, 5-wave decline (1–5 on the right side of the chart), unwinding leverage, hype, and all the “number go up forever” narratives.
This isn’t the end of Bitcoin – it’s the end of this cycle. The next few years are, in my view, for skill-building, capital preservation, and accumulation at true value, not chasing tops.
Trade the levels, respect the structure… and enjoy the ride. 🚀⬆️ then 🪂⬇️

ETH — Price Slice. Capital Sector. 3580.26 BPC 15© Bolzen | The Architect | BPC Framework
Bolzen Market Institute
🏷 ETH — Price Slice. Capital Sector.
TradingView Publication Date: 14.01.2026
🏷 3580.26 — price not yet reached at time of publication.
🏷 BPC — The Bolzen Price Covenant — Strength Index: 15
Quantum structure of obligations and capital flow in price formation via energy blocks.
🏷 Vertical chart — Energy Grid Dashboard.
🏷 Static Stream 1: price published in energy-block production sequence.
🏷 The price energy block is already ordered—not by time, but by execution priority. Crucially: block priority dynamically reconfigures in response to hidden energetic impulses, whereas price execution order records their market manifestation. Every price in the dynamic stream is tied to proprietary energy-production metrics inaccessible to the general public. Those who perceive structure before its manifestation do not follow price—they anticipate it.
EΞ2Φ8Ψ45Θ·ζ⁻¹·106Λ732·Ω²
📎 Screenshot:
🏷 When trading from levels, use liquidity zones from BPC 10 and above.
🏷 Bolzen Liquidity Map — ETH (numerical equivalent):
🏷 I. Interactive Reference Guide: BPC — The Bolzen Price Covenant
🏷 P.S. English is not my native language — I offer no apologies for stylistic imperfections. What you see here is not a post. It is a demonstration of another level of preparation: the symbiosis of human intuition and algorithmic precision. Mathematics and aggressive market analysis — against the machine of liquidations.
The persistent ETH and BTC Energy Grid Dashboard remains publicly accessible and is intended for international institutional review.
— The Architect
BPC — The Bolzen Price Covenant

BTC — Price Slice. Capital Sector. 113690 BPC 20© Bolzen | The Architect | BPC Framework
Bolzen Market Institute
🏷 BTC — Price Slice. Capital Sector.
TradingView Publication Date: 14.01.2026
🏷 113690 — price not yet reached at time of publication.
🏷 BPC — The Bolzen Price Covenant — Strength Index: 20
Quantum structure of obligations and capital flow in price formation via energy blocks.
🏷 Vertical chart — Energy Grid Dashboard.
🏷 Static Stream 1: price published in energy-block production sequence.
🏷 The price energy block is already ordered—not by time, but by execution priority. Crucially: block priority dynamically reconfigures in response to hidden energetic impulses, whereas price execution order records their market manifestation. Every price in the dynamic stream is tied to proprietary energy-production metrics inaccessible to the general public. Those who perceive structure before its manifestation do not follow price—they anticipate it.
EΞ2Φ8Ψ45Θ·ζ⁻¹·106Λ732·Ω²
📎 Screenshot:
🏷 When trading from levels, use liquidity zones from BPC 10 and above.
🏷 Bolzen Liquidity Map — BTC (numerical equivalent):
🏷 I. Interactive Reference Guide: BPC — The Bolzen Price Covenant
🏷 P.S. English is not my native language — I offer no apologies for stylistic imperfections. What you see here is not a post. It is a demonstration of another level of preparation: the symbiosis of human intuition and algorithmic precision. Mathematics and aggressive market analysis — against the machine of liquidations.
The persistent ETH and BTC Energy Grid Dashboard remains publicly accessible and is intended for international institutional review.
— The Architect
BPC — The Bolzen Price Covenant

BTC — Price Slice. Capital Sector. 101940 BPC 1.8© Bolzen | The Architect | BPC Framework
Bolzen Market Institute
🏷 BTC — Price Slice. Capital Sector.
TradingView Publication Date: 14.01.2026
🏷 101940 — price not yet reached at time of publication.
🏷 BPC — The Bolzen Price Covenant — Strength Index: 1.8
Quantum structure of obligations and capital flow in price formation via energy blocks.
🏷 Vertical chart — Energy Grid Dashboard.
🏷 Static Stream 1: price published in energy-block production sequence.
🏷 The price energy block is already ordered—not by time, but by execution priority. Crucially: block priority dynamically reconfigures in response to hidden energetic impulses, whereas price execution order records their market manifestation. Every price in the dynamic stream is tied to proprietary energy-production metrics inaccessible to the general public. Those who perceive structure before its manifestation do not follow price—they anticipate it.
EΞ2Φ8Ψ45Θ·ζ⁻¹·106Λ732·Ω²
📎 Screenshot:
🏷 When trading from levels, use liquidity zones from BPC 10 and above.
🏷 Bolzen Liquidity Map — BTC (numerical equivalent):
🏷 I. Interactive Reference Guide: BPC — The Bolzen Price Covenant
🏷 P.S. English is not my native language — I offer no apologies for stylistic imperfections. What you see here is not a post. It is a demonstration of another level of preparation: the symbiosis of human intuition and algorithmic precision. Mathematics and aggressive market analysis — against the machine of liquidations.
The persistent ETH and BTC Energy Grid Dashboard remains publicly accessible and is intended for international institutional review.
— The Architect
BPC — The Bolzen Price Covenant

ETH — Price Slice. Capital Sector. 3394.17 BPC 3.2© Bolzen | The Architect | BPC Framework
Bolzen Market Institute
🏷 ETH — Price Slice. Capital Sector.
TradingView Publication Date: 05.01.2026
🏷 3394.17 — price not yet reached at time of publication.
🏷 BPC — The Bolzen Price Covenant — Strength Index: 3.2
Quantum structure of obligations and capital flow in price formation via energy blocks.
🏷 Vertical chart — Energy Grid Dashboard.
🏷 Static Stream 1: price published in energy-block production sequence.
🏷 The price energy block is already ordered—not by time, but by execution priority. Crucially: block priority dynamically reconfigures in response to hidden energetic impulses, whereas price execution order records their market manifestation. Every price in the dynamic stream is tied to proprietary energy-production metrics inaccessible to the general public. Those who perceive structure before its manifestation do not follow price—they anticipate it.
EΞ2Φ8Ψ45Θ·ζ⁻¹·106Λ732·Ω²
📎 Screenshot:
🏷 When trading from levels, use liquidity zones from BPC 10 and above.
🏷 Bolzen Liquidity Map — ETH (numerical equivalent):
🏷 I. Interactive Reference Guide: BPC — The Bolzen Price Covenant
🏷 P.S. English is not my native language — I offer no apologies for stylistic imperfections. What you see here is not a post. It is a demonstration of another level of preparation: the symbiosis of human intuition and algorithmic precision. Mathematics and aggressive market analysis — against the machine of liquidations.
— The Architect
BPC — The Bolzen Price Covenant

Coinranger|ETHUSDT. Is further growth possible?🔥News
🔹Today at 16:30 (UTC +3) will issue the US PPI data for December, and most likely for October at the same time. Also included are retail sales at the same time.
🔥ETH
🔹Roughly repeated BTC's success yesterday. Levels:
1️⃣ Above - 3373 and 3460.
2️⃣ Below: 3290, 3190, and 3135 (preliminary calculations)
We'll be following Bitcoin. For now, the priority is a decline. At best, we'll hit 3190 from below. Watch out for the news. 3460 is most likely from above, but not necessarily.

Continuation of the Ethereum downtrend.Continuation of the Ethereum downtrend.
Aiming to test the 227.00% Fibonacci extension level.
Entry: $3095.00
Stop Loss: $3172.00
Take Profit: $1901.00
