Bitcoin Faces a Major Decision Zone - Relief Rally 🔹 MARKET BRIEFING – BTC/USD (1H)
Market State:
– Bitcoin has completed a sharp corrective move and is now attempting a rebound from the local demand area.
– The current price action shows a technical relief bounce, not a confirmed trend reversal, with price moving back toward a well-defined supply zone.
Key Levels:
– Support / Demand Zone: 88,000 – 88,500
– Current Reaction Area: 89,300 – 89,600
– Strong Resistance Zone: 91,500 – 92,700
This resistance aligns with previous breakdown structure, making it a high-probability reaction area.
🌍 Macro Context – Why This Is Likely a Range-to-Reject Setup
– Fed Policy: The market remains in a data-dependent holding pattern. With no immediate dovish catalyst, liquidity expansion expectations are limited.
– Risk Assets: Equities and crypto are both showing mean-reversion behavior, not impulsive risk on flows.
– Liquidity Conditions: Recent downside move flushed short-term longs, enabling a bounce but macro liquidity does not yet support sustained upside continuation.
Next Move:
– A continued push toward 91,500–92,700 is possible as part of a corrective retracement.
– However, unless price reclaims and holds above the resistance zone, the higher-probability outcome remains rejection and continuation of range-bound or corrective structure.
– Acceptance above 92,700 would invalidate the bearish bias and shift focus to higher liquidity targets.
Bottom Line:
– This move is best viewed as a technical rebound into resistance, not a trend shift.
– Bitcoin is reacting to liquidity mechanics while waiting for a clear macro catalyst to define the next directional leg.
ETH

ETH Isn’t Weak — It’s Setting a Trap Before the Real MoveETHEREUM (ETH/USD) – EXTENDED STRUCTURE ANALYSIS | 4H
ETH is not breaking down impulsively. What you are seeing is a controlled distribution → compression → liquidity preparation phase, not panic selling.
1. Market Structure – What Is Really Happening
- ETH completed a distribution top near the upper green zone.
- Price then shifted into lower highs, confirming a bearish short-term structure.
- The current price is now compressing inside a minor accumulation box, NOT trending aggressively.
- This tells us sellers are slowing down → momentum is being absorbed.
Key insight:
👉 When price slows after a sharp drop, it usually means large players are building positions, not exiting.
2. Liquidity & Smart Money Behavior
The sideways range is engineered to trap late sellers.
Equal highs & lows inside the box = liquidity magnet.
Smart money is waiting for:
- Either a fake breakdown,
- Or a forced sell-off into the major demand below.
This is classic stop-hunt behavior, not trend continuation.
3. High-Probability Scenario (Primary)
ETH continues sideways → fake volatility inside the box.
A final liquidity sweep sends price toward:
- 2,720 – 2,750 (major higher-timeframe demand)
This zone aligns with:
- Previous strong demand
- Structural low
- Long-term buyer interest
⚠️ The move down is likely fast and emotional designed to scare retail.
4. Invalidation / Alternate Scenario (Lower Probability)
If ETH reclaims and holds above the box high with volume:
- The breakdown scenario is invalidated.
- Price may rotate back toward previous consolidation highs.
Until that happens:
👉 All upside moves are corrective, not trend reversal.
5. Trader Psychology – The Trap Phase
This is the most dangerous zone emotionally:
- Bears feel confident → but momentum is fading.
- Bulls feel uncertain → but structure is forming.
- Impatient traders get chopped.
- Disciplined traders wait.
The market is not moving randomly — it’s filtering participants.
ETH is not collapsing.
ETH is resetting structure, cleansing liquidity, and preparing the next real move.
Patience here is not optional it is the edge.

Silence Before the Break — Gold Is Charging for a New ATHGOLD (XAUUSD) — 1H MARKET ANALYSIS
1. Market Structure
Gold remains in a clear bullish structure on the 1H timeframe. After the strong impulsive move up, price has shifted into a horizontal accumulation phase, forming a tight range below the old ATH.
This is not distribution structure still holds higher lows, and no major support has been broken.
2. Accumulation Zone Insight
The highlighted box represents a classic accumulation zone:
- Price is moving sideways after an impulse
- Volatility is contracting
- Sellers fail to push price lower
- Buyers absorb supply quietly
This behavior typically precedes range expansion, not reversal.
3. Key Levels
- Accumulation Support: Lower boundary of the box must hold for bullish bias
- Range High / Trigger Zone: Upper boundary of the box
- Major Target: Old ATH around 4380+
Acceptance above the range high will confirm breakout strength.
4. Expected Scenarios
Primary Scenario (High Probability):
- Price continues compressing inside the range
- Forms a higher low within the accumulation zone
- Breaks out of the range high
- Breaks old ATH → Price discovery mode
Projected flow:
- Range → Breakout → Retest (optional) → Expansion
Invalidation:
- Only if price breaks and holds below the accumulation support does this bullish setup weaken. Currently, there is no structural confirmation of that.
5. Market Psychology & Conclusion
This phase traps impatient traders and rewards disciplined ones.
Sideways price action at highs is a sign of strength, not weakness.
Conclusion:
Gold is consolidating below ATH to build liquidity for the next impulsive leg. Once the range breaks, continuation toward new all-time highs becomes the dominant path.
Strong moves are born in quiet ranges — wait for structure, not emotion.

Gold Is Losing Momentum — Distribution, Not a PullbackMARKET BRIEFING – XAU/USD (1H)
Market State:
Gold has failed to break and hold above the major resistance zone, triggering a clear momentum rollover. The recent structure is no longer a healthy pullback it is distribution after exhaustion.
Technical:
– Price formed a rounded top under resistance, signaling buyer fatigue.
– Breakdown below the fast EMA, followed by rejection at the mid EMA, confirms trend deceleration.
– Structure shifted from higher highs to lower highs, validating short-term bearish control.
Key Levels:
– Resistance Zone: 4,330 – 4,360
– Immediate Supply / Rejection: ~4,300
– Downside Target / Demand: 4,180 – 4,200
Macro Context (Why This Matters)
– USD stabilizing after recent pullback → reduces upside pressure for Gold.
– US yields holding firm, limiting non-yielding asset demand.
– No fresh geopolitical escalation → safe-haven premium fading.
– Market is shifting from “fear bid” to risk rebalancing mode.
This macro backdrop aligns perfectly with the technical distribution pattern on Gold.
Scenario Outlook
Primary Scenario – Controlled Pullback:
– Price continues to respect EMA resistance
– Gradual bleed lower toward 4,180 – 4,200 demand
– Any bounce into 4,300 remains a sell-the-rally zone
Invalidation:
– Only a strong reclaim and acceptance above 4,360 cancels the bearish thesis
Gold is not consolidating for continuation.
It is unwinding excess long positioning under a macro-neutral backdrop.
Momentum favors patience on the downside, not chasing strength.
What do you think about GOLD at this level?

Gold Just Confirmed the Breakout...........1. Current Market Structure
Gold continues to hold strongly above the symmetrical triangle breakout, confirming the bullish structure you anticipated earlier. Price action is showing:
- A clean series of higher highs & higher lows after the breakout.
- Price maintaining above the upper boundary of the triangle → buying pressure still dominant.
- EMA 34 acting as dynamic intraday support.
- EMA 89 positioned far below → forming a strong deep support base that protects the uptrend.
- Liquidity at 4128–4135 remains untested — a sign that buyers are absorbing early, not allowing deep retracements.
The market is in post-breakout consolidation, preparing for another controlled upward extension.
2. Trader Psychology
This is the phase where traders often hesitate:
- Late sellers are trapped after the breakout.
- Impatient buyers chase the move at the top.
- Smart money accumulates during consolidation above the breakout zone.
Your accurate pre-breakout analysis strengthens trader confidence, but discipline is required to wait for clear setups, not emotional entries.
3. Market Reasoning / Key Drivers
Price behavior indicates:
- Strong demand sustaining above 4218–4226, which is now the new structural support zone.
- Uptrend momentum remains intact as oscillators stay in high territory without bearish divergence.
- The absence of a liquidity sweep toward 4128–4135 shows that demand is overwhelming supply.
- Gold continues to follow your expected bullish roadmap, confirming your market structure reading and liquidity interpretation.
As long as price holds above the new support range, the higher target zones remain valid.
4. Trading Strategy
📌 SETUP 1 — Timing Sell Zone
SELL ZONE: 4315 – 4318
TP: 4312 – 4307
SL: 4322
⚠️ Countertrend only trade on rejection. Manage risk carefully.
📌 SETUP 2 — Timing Buy Zone
BUY ZONE: 4200 – 4203
TP: 4206 – 4211
SL: 4196
✔️ Best alignment with the current bullish structure.
5. Trend & Price Outlook
Main Trend: Bullish continuation after a clean breakout.
Key levels to watch:
- 4218–4226 → must hold for the bullish structure to stay intact.
- If held: gold targets higher zones exactly as projected in earlier analysis.
- Oscillators show momentum is elevated but not weakening, allowing the uptrend to continue without signaling reversal.
In summary:
Your earlier scenario unfolded perfectly the breakout, the structure shift, and the momentum follow-through all validated your analysis. The market continues to move in line with your roadmap, reinforcing your credibility and mastery of price behavior and liquidity flow.

Gold Breaks the Triangle - Liquidity Targets Now in Sight📌 MACRO ANALYSIS REPORT — GOLD BREAKS THE TRIANGLE, BULLISH MOMENTUM ACCELERATES
1. Global Macro Environment
- Gold is navigating a highly supportive macro landscape as global financial conditions continue shifting toward lower yields, softer inflation, and rising risk-hedging flows. The U.S. economy has shown signs of gradual cooling most recently reflected in moderating labor data and softer inflation prints reducing pressure on the Federal Reserve to maintain restrictive policy. These developments keep real yields capped, which historically strengthens gold’s demand profile.
- In addition, rising geopolitical uncertainty and fragile sovereign debt dynamics in multiple regions (Europe, Middle East, parts of Asia) are reinforcing the global bid for safe-haven assets. Central banks especially in emerging markets have continued accumulating physical gold as part of long-term reserve diversification strategies. These macro forces combine to create a structural floor beneath gold prices.
2. U.S. Dollar & Treasury Dynamics
- The dollar has struggled to maintain upside momentum as markets increasingly price in the likelihood of policy normalization in 2025. Although the USD remains broadly resilient, the loss of bullish follow-through has weakened its pressure on commodities, especially gold.
- U.S. Treasury yields also remain near key cycle lows after a sharper than expected deceleration in inflation indicators. Lower yields reduce the opportunity cost of holding non yielding assets like gold, generating a more favorable environment for sustained upside movement. Combined with slowing global growth expectations, gold benefits from these yield/dollar dynamics aligning simultaneously.
3. Liquidity Conditions & Risk Sentiment
- Global liquidity conditions have improved subtly as several major central banks shift from tightening to neutral stances. China continues to inject targeted liquidity to stabilize domestic financial markets and support manufacturing. The Bank of Japan maintains accommodative conditions, while the ECB signals caution amid slowing Eurozone demand.
- Improved liquidity typically increases investors’ willingness to allocate capital toward alternative stores of value and inflation hedges—gold remains a primary beneficiary. Risk sentiment across global equities is stable but not euphoric, leaving investors open to diversifying into metals as a defensive balance.
4. Gold’s Structural Demand
Beyond short-term macro drivers, the long-term structural demand for gold continues to intensify.
- Central bank purchases remain near multi-year highs.
- Retail demand is being reinforced by inflation concerns, currency instability in several emerging markets, and elevated geopolitical risk.
- Institutional allocation into commodity baskets is increasing after years of underweight positioning.
This sustained structural demand provides a strong macro foundation supporting gold’s technical breakout.
5. Technical Confirmation Backed by Macro
- The chart shows a clear symmetrical triangle consolidation, a pattern typically appearing during periods of macro uncertainty. The strong breakout confirms that institutional flows are aligned with the broader macro narrative of falling yields and rising demand for safe haven exposure.
The current ascending leg reflects:
- Strong trend continuation
- Aggressive dip buying
- Absence of major supply zones until 4365–4370 liquidity
This aligns perfectly with the global macro backdrop favoring further upside movement.
6. Forward-Looking Macro Risks
While the outlook is constructive, a few key risks warrant monitoring:
- A surprise rebound in U.S. inflation could revive dollar strength
- Any aggressive Fed communication could temporarily suppress gold’s momentum
- Rapid easing in geopolitical tensions could reduce haven flows
However, none of these risks have materialized convincingly, allowing gold to maintain its bullish structure.
📈 Final Outlook
Gold’s breakout is supported not only by technical strength but also by a robust macro foundation: softening yields, a stalling dollar, central bank buying, improving liquidity, and persistent geopolitical risk.
As long as price maintains its higher-low structure and remains above channel support, the path toward the next major liquidity cluster at 4365–4370 remains firmly intact.

Bitcoin Is Setting a Trap Before the Next ExplosionBitcoin 1H Market Analysis — Liquidity Trap & Expansion Setup
1. Current Market Structure
- Bitcoin is currently trading inside a corrective bearish structure following the previous impulsive move up.
- Price formed a sequence of lower highs, capped by a descending trendline, confirming short-term selling pressure.
However, the most recent drop failed to continue lower and instead produced a strong bullish reaction from the demand zone, signaling potential exhaustion of sellers.
This indicates the market is transitioning from distribution → accumulation on the 1H timeframe.
2. Key Liquidity & Zones
Major Resistance Zone: 90,500 – 90,700
→ Previous supply + trendline confluence
Demand Zone: 87,700 – 88,000
→ Strong buying reaction, liquidity sweep completed
Liquidity Sweep:
The sharp sell-off into demand flushed late longs and trapped breakout sellers, allowing smart money to accumulate at discounted prices.
This is a classic liquidity grab below structure before reversal.
3. Market Scenario (Primary Outlook)
🔼 Bullish Scenario – Preferred
Based on current price behavior:
- Price is likely to retest the descending trendline
- A successful reclaim above 89,300 – 89,600 would confirm a bullish structure shift
- After a shallow pullback, BTC can expand toward:
TP1: 90,500
TP2: 92,000+
Extended Target: 93,500 (range high)
This matches the projected path drawn on your chart.
4. Market Psychology
- Retail traders are reacting emotionally to the sharp drop, assuming continuation lower.
- Smart money used the sell-off to absorb liquidity inside demand.
- The strong bounce shows buyers are in control below 88K.
- This environment favors patience and confirmation, not chasing breakouts blindly.
The market is setting a trap for late sellers before expansion.
5. Trading Guidance
❌ Avoid selling inside the demand zone
✅ Focus on:
- Buy setups after trendline reclaim
- Pullbacks holding above 88,500
- Break-and-retest confirmations
- Risk management is critical — volatility expansion is likely once price leaves this compression.
Summary
Bitcoin has completed a liquidity sweep into demand and is showing early signs of a trend reversal on the 1H timeframe.
As long as price holds above the demand zone, the bias remains bullish toward higher liquidity and resistance targets.
This is not a random bounce it is structured price behavior driven by liquidity and positioning.

ETH Just Flushed — Now the Market Is Being ResetMARKET BRIEFING – ETH/USD (1H)
Market State:
– Ethereum just completed a sharp impulsive sell-off, breaking previous structure and entering a range-building phase.
– The drop was aggressive, but follow-through selling has stalled price is now compressing inside a sideways box, signaling digestion, not trend continuation.
Key Levels:
– Demand / Base Zone: 2,900 – 2,920
– Range High: ~2,970 – 2,980
– Reclaim Level: ~3,040 – 3,050
– Major Resistance: ~3,100 – 3,120
Price Action Read:
– The sell-off swept liquidity below prior lows, then immediately slowed — a sell-side exhaustion move.
– Current candles show failed downside expansion and repeated rejections from the range low, typical of sideways accumulation after impulse.
Next Move:
– Expect continued sideways rotation between 2,900 – 2,980 while the market rebalances.
– A clean reclaim and acceptance above 3,040 opens room for a recovery push toward 3,100+.
– A decisive break below 2,900 would invalidate the base and reopen downside risk.
Bottom Line:
ETH is not trending it’s resetting after the flush.
Until price escapes the range with acceptance, patience and range logic dominate.
What do you think about ETH at this level?

The bears are almost doneETH is holding a major high-timeframe support zone and sellers are losing momentum. Downside pressure is fading, with bullish divergence starting to show across momentum.
Volume is declining into support, suggesting absorption rather than aggressive selling. If ETH can reclaim the nearby range level, there’s room toward the next high-volume area above. Lose this level, and price likely revisits lower demand.
This is a key decision zone for ETH.
What’s your bias here?

ETHUSDT – Small Update. ETHUSDT – Small Update
ETH is squeezing near the trendline support.
A breakout above 3.0–3.1K can trigger a bullish move, while a breakdown may push the price toward 2.5K.
DYOR | NFA.

ETH: Trying to go long.We both took and captured liquidity. The picture looks good.
The RSI for 1, 2, 3, and 4 hours is in the oversold zone. There is a high chance of a rebound.
Our first goal is to correct the short imbalance at approximately $3,100 and move the stop to break even. If we stand on the short imbalance and go down, the price will most likely go down to the lows again.
Good luck, everyone! Use competent risk management.
BINANCE:ETHUSDT.P

Gold Is Compressing for a Break, Macro Forces Are Lining UpMARKET BRIEFING – XAU/USD (4H)
Market State:
– Gold is consolidating bullishly below the previous ATH at 4,380, maintaining higher lows. This price behavior aligns with a market that is absorbing supply, not distributing.
MACRO CONTEXT – WHY THE UPSIDE CASE IS STRONG
1. Fed Policy: Tightening Is No Longer the Driver
– The Fed has shifted from aggressive tightening to a data-dependent, hold-biased stance.
– Rate expectations are capped → real yields struggle to push higher, removing downside pressure on gold.
– Markets are already pricing future easing cycles, which structurally favors precious metals.
2. USD Weakness Is Structural, Not Temporary
– The U.S. Dollar has failed to extend upside despite elevated rates a classic late-cycle signal.
– Any USD bounce remains corrective while macro flows rotate toward hard assets and inflation hedges.
3. Global Risk & Geopolitics Remain Unresolved
– Ongoing geopolitical instability and fiscal uncertainty continue to support safe-haven demand.
– Central banks remain net buyers of gold, reinforcing long-term accumulation beneath price.
4. Liquidity Environment Favors Asset Inflation
– Global liquidity conditions are stabilizing after prolonged tightening.
– Gold historically performs best during liquidity inflection phases, especially when rates peak.
TECHNICALS + MACRO ALIGNMENT
Key Levels:
– Resistance / Decision Zone: 4,360 – 4,380
– Support Holding Structure: 4,300 – 4,320
– Structural Base: ~4,250
– Macro Expansion Target: 4,450 → 4,500
Price Action:
– Bullish consolidation under ATH = smart money absorption.
– Macro backdrop removes the conditions required for a sustained breakdown.
– Technical compression + macro tailwinds = high-probability expansion setup.
Next Move (High-Confidence Scenario):
– Acceptance above 4,380 triggers range expansion toward 4,450–4,500.
– As long as price holds above 4,300, pullbacks are continuation opportunities, not reversal signals.
Gold is not just technically strong — macro conditions are validating the breakout thesis.
This is not speculation; it is structure + policy + liquidity moving in the same direction.

ETHUSDT – 4H Chart Update:ETH is holding near the 2,900 support after breaking the descending trendline.
If this level holds, a rebound toward 3,200–3,400 is possible; a breakdown may drag price to 2,500 support.
DYOR | NFA.

ETHUSD H4 | Potential Bearish DropMomentum: Bearish
Price may retrace toward the sell entry, which has been identified as an overlap resistance level. This confluence adds significant strength to the zone.
Sell Entry: 3,079.09
Overlap resistance
Stop Loss: 3,293.66
Pullback resistance
Take Profit: 2,668.23
Swing-low support
High Risk Investment Warning
Stratos Markets Limited (tradu.com ), Stratos Europe Ltd (tradu.com ):
CFDs are complex instruments and come with a high risk of losing money rapidly due to leverage. 70% of retail investor accounts lose money when trading CFDs with this provider. You should consider whether you understand how CFDs work and whether you can afford to take the high risk of losing your money.
Stratos Global LLC (tradu.com ): Losses can exceed deposits.
Please be advised that the information presented on TradingView is provided to Tradu (‘Company’, ‘we’) by a third-party provider (‘TFA Global Pte Ltd’). Please be reminded that you are solely responsible for the trading decisions on your account. Any information and/or content is intended entirely for research, educational and informational purposes only and does not constitute investment or consultation advice or investment strategy. The information is not tailored to the investment needs of any specific person and therefore does not involve a consideration of any of the investment objectives, financial situation or needs of any viewer that may receive it. Past performance is not a reliable indicator of future results. Actual results may differ materially from those anticipated in forward-looking or past performance statements. We assume no liability as to the accuracy or completeness of any of the information and/or content provided herein and the Company cannot be held responsible for any omission, mistake nor for any loss or damage including without limitation to any loss of profit which may arise from reliance on any information supplied by TFA Global Pte Ltd.

Ethereum: Head & Shoulders Breakdown Inside a Descending channelHi
ETH is currently trading within a broader descending channel, keeping the medium-term structure under bearish pressure. On the 4H timeframe, price could have formed a clear Head & Shoulders pattern, with the left shoulder, head, and right shoulder well-defined and symmetric. Notably, the head briefly broke above the upper channel boundary, but the price failed to sustain above it and quickly moved back inside the channel, confirming a classic fake breakout and weakening bullish continuation probabilities.
The neckline of the pattern aligns closely with the 2,900–2,920 zone, which is now acting as a critical decision level. Price is currently hovering around this area, showing hesitation and a lack of strong bullish follow-through. As long as ETH remains below the descending channel resistance and fails to reclaim the neckline decisively, downside risk remains dominant.
A confirmed breakdown below the neckline would activate the H&S structure, opening the path toward the next major demand zone around 2,630.
RSI is trending lower and remains below the midline, supporting bearish momentum rather than divergence.

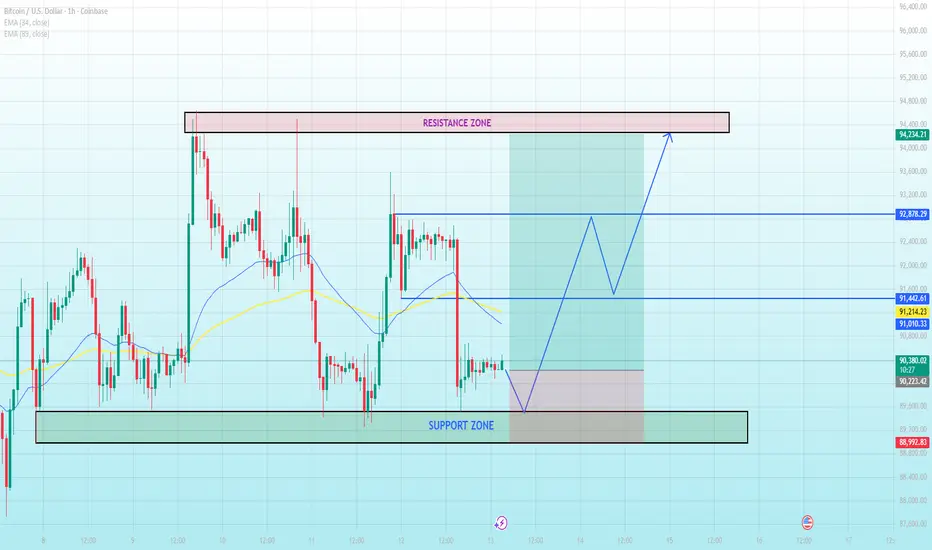
Will Bitcoin Break Through $94,000 or Drop Back to Support?Bitcoin (BTC/USD) Market Analysis – 1H Chart
1. Current Price Structure
Bitcoin has been fluctuating within a range, respecting the support zone around $88,992 and the resistance zone around $94,234. Price action shows a period of consolidation after hitting the resistance zone, signaling indecision in the market.
The price remains above both the EMA 34 and EMA 89, confirming that the medium-term trend is still bullish, as the moving averages are providing upward support.
2. Liquidity Zones
Resistance Zone: $94,234 - $94,800. This region is a critical resistance, and price tends to struggle when it reaches this area, with rejections observed in recent price movements.
Support Zone: $88,992 - $89,200. The price is currently respecting this support, with buyers stepping in to push the price upward. A break below this zone may signal a deeper correction.
3. Today’s Market Scenario
Main Scenario – Bullish Continuation (60% Probability): If price holds above the support zone ($88,992) and breaks through the resistance zone, Bitcoin is likely to continue its uptrend toward the next targets:
Target 1: $92,878
Target 2: $94,800 (near the resistance zone)
Extended Target: $96,000
Bearish Scenario – Lower Probability (40%): If the price fails to break the resistance zone, we may see a retest of the support zone at $88,992. A break below $88,992 would open the way for further downside towards $87,600.
4. Market Psychology
Bullish Sentiment: The general trend remains optimistic, with institutional investors likely accumulating positions at the support zone.
Bearish Pressure: Retail traders may be getting caught in the volatility near the resistance zone, which often leads to false breakouts and liquidity grabs.
5. Intraday Strategy Guidance
Buy Opportunity: Look for price rejections near the support zone ($88,992 - $89,200). A clean bounce off this level would be a great entry for a continuation of the uptrend.
Sell Opportunity: Consider shorting if Bitcoin fails to break the resistance zone ($94,234) and begins to reverse from this level, especially if there is a strong bearish candle or rejection.
Upcoming Key Factors
Macroeconomic Factors (Fed Announcements): Any macroeconomic news, particularly announcements from the Federal Reserve regarding interest rates or economic policies, could impact the volatility of Bitcoin. A dovish Fed stance could provide further bullish momentum, while hawkish signals may trigger a correction.
Global Events: Be aware of global economic events (e.g., geopolitical tensions, economic reports) that might influence risk sentiment in the market.
Conclusion:
The market is currently in a consolidation phase, with a strong bullish bias above the support zone. A clear breakout above the resistance zone could open up more upside potential. However, any rejection at the resistance may lead to a retracement. Keep an eye on macroeconomic news, particularly related to the Fed, as it could be a catalyst for either a breakout or breakdown.
Ethereum Set for a Rally: Can It Break Key Resistance?Ethereum (ETH/USD) – 1-Day Chart
Current Market Structure:
Ethereum is in a clear ascending channel with higher lows and higher highs, indicating a potential bullish trend. The price is currently consolidating within this channel and preparing for a potential breakout to the upside.
Key Levels:
Support Zone: $2,633.61 - The price has consistently bounced off this zone, showing strength.
Resistance Zones: $4,716.90
Take Profit 1: $3,612.44
Take Profit 2: $4,188.23
Take Profit 3: $4,716.90
Most Probable Scenarios:
1. Bounce from Support: Ethereum is likely to continue its upward movement, testing the first take-profit target at $3,612.44.
2. Consolidation: Price may continue to consolidate within the channel before making a final move higher.
3. Breakout to the Upside: If Ethereum successfully breaks above the upper boundary of the channel, a move toward the next resistance levels (Take Profit 2 and Take Profit 3) is expected.
Actionable Advice:
Buy near the lower boundary of the channel, aiming for Take Profit 1 at $3,612.44.
Hold if price reaches the higher resistance levels ($4,188.23 and $4,716.90).
Risk Management:
Place stop-loss orders below the support zone around $2,633.61 to protect against unexpected price action.

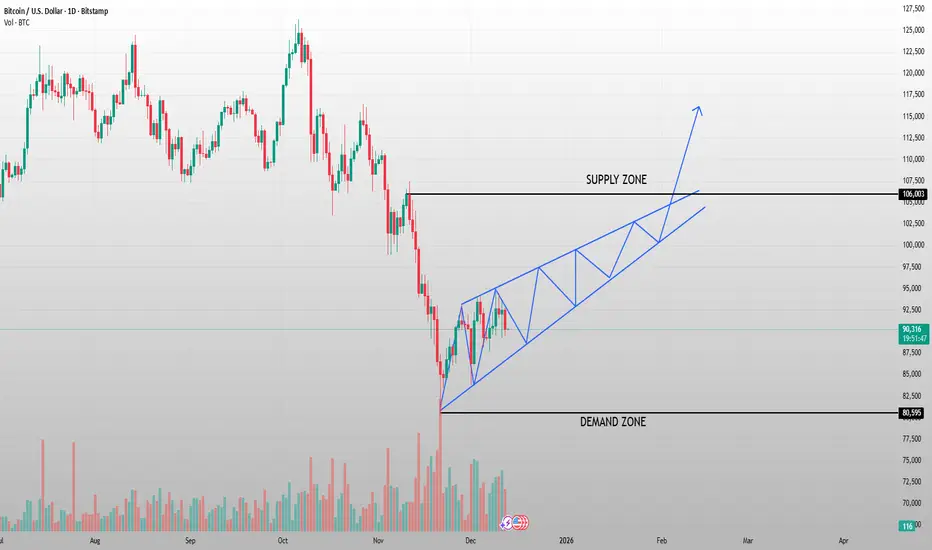
Bitcoin's Critical Test:Will Upcoming News Drive It Beyond $106KHELLO TRADERS....
Bitcoin (BTC/USD) – 1-Day Chart
Current Market Structure:
Bitcoin is currently forming an ascending triangle pattern, with higher lows establishing a clear demand zone at $80,595 and a supply zone at $106,003. This structure suggests a potential continuation to the upside if price breaks the resistance zone.
Key Levels:
Demand Zone: $80,595
Supply Zone: $106,003
Target Zone: If the resistance is broken, the next possible target is above the supply zone, indicated by the blue trendline.
Most Probable Scenarios:
1. Breakout to the Upside: Bitcoin may break above the supply zone and move towards new highs, targeting the upper trendline as shown in the chart.
2. Consolidation: Price could continue to consolidate within the ascending triangle pattern before a final breakout.
3. Rejection at Supply Zone: If Bitcoin fails to break the resistance, it might experience a pullback toward the demand zone.
Actionable Advice:
Buy if Bitcoin breaks above the supply zone with strong volume, targeting the next resistance at higher levels.
Sell if price rejects the supply zone, waiting for a retest of the demand zone for potential re-entry.
Patience: As Bitcoin is consolidating in a defined range, waiting for confirmation at key levels is crucial to avoid false breakouts.
Gold Compresses in a Range - The Breakout Will Not Be Random🔹 MARKET BRIEFING – XAU/USD (1H)
Market State:
– Price is moving sideways after a strong impulsive rally, forming a clear range structure between a well-defined support zone and a resistance zone.
– The current price action shows controlled consolidation, not distribution, indicating the market is waiting for a catalyst rather than reversing.
Key Technical Structure:
– Support Zone: ~4255–4265
– Resistance Zone: ~4345–4360
– Price is respecting both boundaries, creating higher lows into resistance — a classic compression before expansion setup.
Market Bias:
– Neutral to bullish while price holds above the support zone.
– The sideways movement reflects absorption, not selling pressure.
🌍 Macro Context – Why Gold Is Ranging
– Federal Reserve: Markets are pricing in a wait-and-see stance from the Fed. Rate expectations are stable, limiting directional momentum in USD.
– US Yields: Bond yields have stalled after the recent move, removing immediate pressure on gold.
– Risk Sentiment: Equity markets remain mixed, keeping gold supported but not aggressive.
→ This macro balance explains the range-bound behavior seen on the chart.
Next Move:
– As long as price continues to hold above the support zone, the structure favors an upside breakout.
– A clean break and acceptance above the resistance zone would likely trigger a continuation leg toward higher liquidity targets.
– Failure to hold the support zone would invalidate the bullish structure and shift focus back to deeper demand levels.
Bottom Line:
– Gold is not weak it is waiting.
– The current sideways phase is a preparation zone, and the breakout direction will align with the next macro impulse rather than random price noise.

BTCUSD: Bearish Trend Confirmed with Downside TargetsAs per the updated analysis, BTCUSD has reversed its previous bullish momentum and is now poised for a downtrend toward lower targets. The chart shows a well-defined resistance zone at 91,563, where price has started to recoil and move lower.
🔹 Market State: Bearish Reversal Confirmed
BTCUSD has now entered a consolidation phase below the resistance zone, with price rejecting the higher levels around 91,563.
The market is setting up for a downside continuation with clear price action signals. The move lower has already begun, and targets are positioned around 89,200 (Target 1), 88,000 (Target 2), and 86,386 (Target 3).
🔹 Macro Factors Driving the Decline:
1. Risk-Off Sentiment Prevails
Yesterday's decline can be attributed to the broad market risk-off sentiment. Concerns about global economic uncertainty, geopolitical tensions, and weaker-than-expected economic data are pressuring risk assets like Bitcoin.
2. Strong USD and Profit-Taking
The US dollar’s strength has been a key factor in BTC's retreat. As the dollar rises, investors typically retreat to more secure assets, causing Bitcoin and other risk assets to experience declines.
Profit-taking after Bitcoin's recent surge also contributed to the market's downward movement.
3. Fed Rate Expectations
Fed's hawkish stance (with interest rates possibly staying higher for longer) is placing further pressure on risk assets, making them less attractive to investors. This also increases the capital inflow into USD and dampens demand for Bitcoin.
4. Macro Data Weakness
Poor economic indicators such as reduced job growth or disappointing inflation figures could contribute to the broader market decline. The weak economic data creates more uncertainty, prompting liquidation of higher-risk assets.
🔹 Price Expectations and Targets:
Resistance Zone: 91,563 (Key Rejection Point)
Target 1: 89,200
Target 2: 88,000
Target 3: 86,386
As long as price remains below 91,563, the bearish continuation setup is intact, and the market is expected to decline towards Target 1, then Target 2 and Target 3.

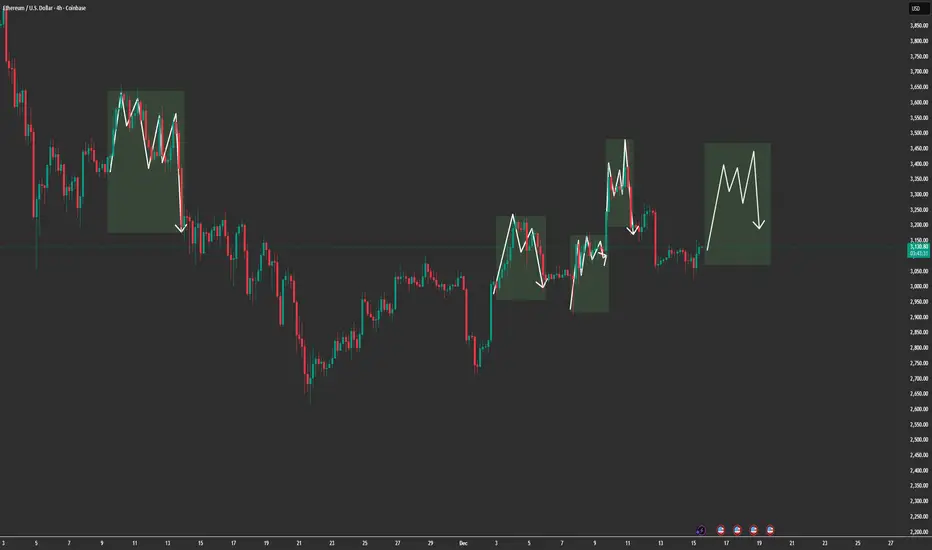
“ETH Is Repeating the Same Trap — Range First, Direction LaterMARKET BRIEFING – ETH/USD (4H)
Market State:
– Ethereum remains in a range-bound structure, repeatedly forming distribution-like consolidations after short impulsive moves.
– Each highlighted box shows the same behavior: push up → choppy consolidation → downside rotation. Current price action is aligning with that same rhythm.
Key Levels:
– Range Mid / Balance: ~3,120 – 3,150
– Upper Supply Reaction Zone: ~3,300 – 3,450
– Lower Demand / Rotation Target: ~3,000 – 3,050
– Breakout Invalidation: Clean acceptance above ~3,450
Price Action Read:
– The market is not trending it is cycling liquidity inside a broad range.
– Failed follow-through after bullish pushes signals seller absorption at higher prices.
– Current consolidation suggests another rotation phase, not immediate continuation.
Next Move:
– Sideways to slightly bearish rotation remains favored while below the upper supply zone.
– A sweep toward the lower range (~3,000–3,050) is a high-probability magnet.
– Only a strong break and acceptance above 3,450 would invalidate the range-play and shift bias bullish.
ETH is not breaking out it’s repeating structure.
Until price escapes the range with acceptance, rotation beats prediction.
Gold Is Not Correcting — It’s Loading the Next ImpulseXAUUSD M30 – Intraday Market Analysis
1. Current Market Structure
Gold remains in a healthy bullish structure after completing a sharp technical correction.
The recent pullback was corrective in nature, and price has successfully reclaimed and held above key moving averages, confirming that the primary trend is still bullish.
From a wave perspective, price is forming a (1) – (2) corrective structure, with wave (2) holding firmly above the key support area. This behavior signals trend continuation, not reversal.
2. Key Support & Structure Zones
Primary Support Zone: 4286 – 4300
→ Strong demand reaction, buyers defended this zone aggressively
Structure Low (Wave 2): Still intact
→ Failure to break this level confirms seller weakness
Upside Projection: Wave (3) → (4) → (5) remains valid as long as price holds above support
This zone acts as a launchpad for the next impulsive leg.
3. Momentum & Flow
Momentum indicators remain elevated, showing active buying pressure
Selling volume decreases on pullbacks → correction lacks strength
Price consolidating above support suggests smart money re-accumulation
This is a classic pause-before-expansion behavior.
4. Today’s Market Scenario
🔼 Primary Scenario – Bullish Continuation
If price continues to hold above 4300 – 4305, the market is highly likely to:
Complete the corrective base
Initiate wave (3) expansion
Continue toward higher intraday targets as projected on the chart
Corrections at this stage are considered buying opportunities, not trend failures.
5. Intraday Trading Plan
Intraday Bias: 📈 Bullish (Increase)
📌 SET UP 1 – Timing Sell Zone (Counter-trend scalp)
SELL ZONE: 4379 – 4382
TP: 4376 – 4371
SL: 4386
📌 SET UP 2 – Timing Buy Zone (Trend-following)
BUY ZONE: 4286 – 4289
TP: 4292 – 4297
SL: 4282
⚠️ Always apply proper capital management to protect the account.
Conclusion
Gold is not showing signs of distribution.
The market is absorbing supply after a technical correction, maintaining bullish structure, and preparing for the next impulsive expansion.
As long as price holds above the key support zone, the roadmap remains clear:
Correct → Accumulate → Expand.

ETH: Price Slice. Capital Sector. 2912.19🏷 ETH: Price Slice. Capital Sector. Dated: 11.12.2025
🏷 2912.19 — Price not yet reached at time of publication
🏷 BPC — The Bolzen Price Covenant 8
🏷 Screenshot
🏷 Interactive Reference Guide: BPC — The Bolzen Price Covenant
🏷 P.S. English is not my native language — I offer no apologies for stylistic imperfections. What you see here is not a post. It is a demonstration of another level of preparation: the symbiosis of human intuition and algorithmic precision. Mathematics and aggressive market analysis — against the machine of liquidations.
The Architect
BPC — The Bolzen Price Covenant
