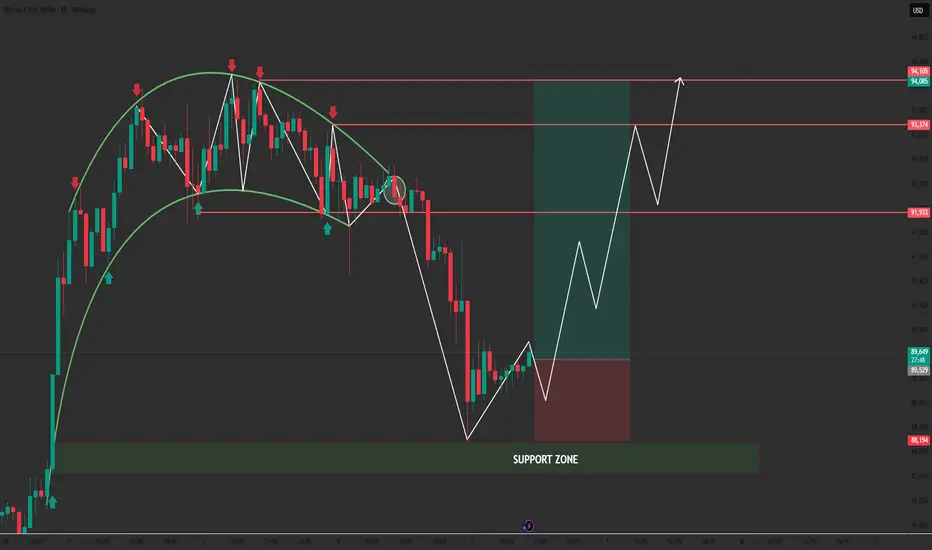
The Drop Is Done — Bitcoin Is Preparing to Bounce🔥 BTC/USD – 1H MARKET OUTLOOK
“BTC Correction Completed – Reversal Structure Forming!”
1. Market Structure Overview
BTC has completed a full rounding-top structure followed by a sharp decline into the Support Zone.
After liquidity was swept below the recent swing low, price has formed a clean bullish reaction with a potential V-shape reversal pattern.
The market is now transitioning:
- From distribution ⟶ accumulation
- From downtrend leg ⟶ early-stage bullish structure
- Higher low formation is developing, validating the first signals of trend reversal.
This matches perfectly with your chart’s projection:
A rebound structure with higher highs & higher lows forming from support.
2. Key Zones
🔴 Resistance Zones
- 91,933 – First major resistance
- 93,374 – Liquidity zone
- 94,085 – 94,105 – Key upside target / breakout zone
- 94,523 – Final projected target
🟢 Support Zone: 88,194 – 88,800
This is the area where price reacted strongly, confirming buyer presence and liquidity sweep.
As long as BTC holds above the Support Zone, the upside scenario remains dominant.
3. Scenarios Ahead
🔹 Primary Bullish Scenario (High Probability)
BTC continues to respect the support area → develops a higher low → pushes upward following your projected path.
Expected steps:
- Small retracement
- Break of minor structure to the upside
- Momentum continuation targeting:
🎯 91,933
🎯 93,374
🎯 94,085 – 94,105
🎯 Final: 94,523
🔸 Alternative Scenario (Low Probability)
Only valid if price breaks & closes below 88,194:
→ BTC could revisit deeper liquidity around 87,000 – 86,500.
Currently, the chart shows no evidence favoring this scenario.
4. Intraday Trading Setups
📌 SETUP 1 – Intraday Buy (Main Setup)
BUY ZONE (Support Reaction):
👉 88,194 – 88,800
Take Profit:
🎯 91,933
🎯 93,374
🎯 94,085 – 94,105
🎯 Extended: 94,523
Stop Loss:
❎ Below 88,194
⚠️ Manage risk properly and avoid over-leverage during volatile swings.
5. Summary & Motivation
BTC is following the roadmap exactly as projected:
✔ Correct breakdown
✔ Correct liquidity sweep
✔ Correct reversal reaction
✔ Correct higher-low formation
✔ Correct bullish outlook from support
This structure shows the market is shifting from weakness to strength—and traders who stay disciplined will capture the next upside wave.
🔥 Keep your mindset sharp — every correction is an opportunity, not a threat. Stay focused, stay confident, and trade the structure, not the emotions.
ETH
BRIEFING Week #49 : Watch Oil & USDJPYHere's your weekly update ! Brought to you each weekend with years of track-record history..
Don't forget to hit the like/follow button if you feel like this post deserves it ;)
That's the best way to support me and help pushing this content to other users.
Kindly,
Phil

BTC 88194.99K the point where time bows before structure Carved in Stone: The Point Where Time Bowing to Structure
🏷 BTC
🏷 17.11.2025
🏷 Capital Sector. Local price slice at a moment. System of intelligent anticipation.
🏷 88194.99 — The price is carved. As of publication, the level has not yet been reached.
November 17, 2025 — not a date, but a portal .
Within it, as within an ancient temple, the number is inscribed: 88194.99 . Not approximately. Not “around.”
Carved — without room for interpretation, without space for opinion.
This is not a signal. This is the establishment of reality within the Capital Sector. Here, speculation ends; architecture begins. Lower timeframes fall silent. The crowd remains in shadow. Only those who understand the language of price sectors and anticipatory structures can read what has already been written.
To this core is bound a minimum impulse of 7% — not an option, but a structural imperative. Price does not merely move: it must validate the integrity of the sector. Thus, the range of realization is not shaped by desire, but by inevitability.
International horizons have long been marked: not all may approach the source without being burned.
To outsiders — no entry. Not because it is forbidden, but because it is inaccessible . Reality here is constructed according to rules that are not debated — they are executed.
The point is not an invitation. The point is a test.
— The Architect

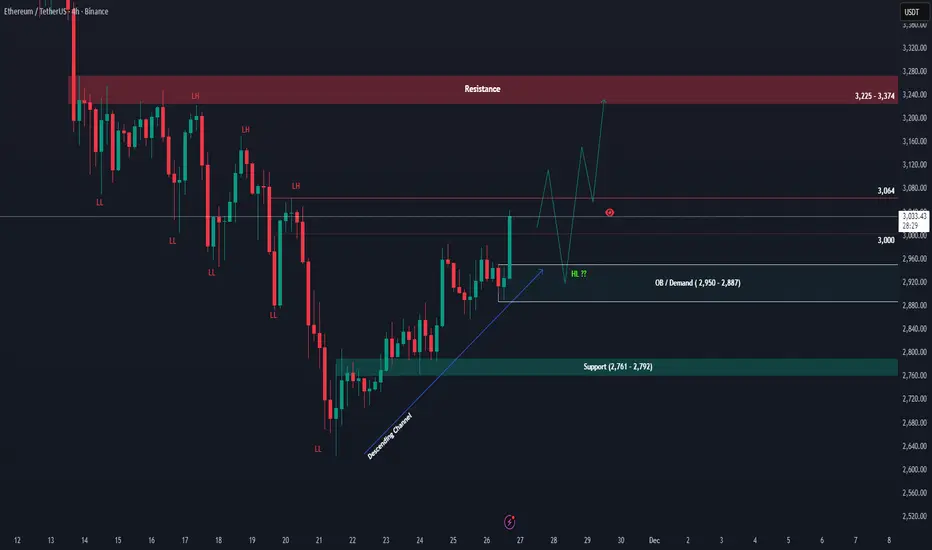
ETH Is Quietly Setting Up a Massive Reversal — Don’t Miss This!ETH 4H & Daily Outlook Update
ETH continues to follow the broader plan we've been watching over the last few days. After tapping the monthly demand zone, price reacted strongly and rebounded from the daily order block, confirming that the higher-timeframe accumulation area is still holding well. This zone remains the key foundation for ETH’s medium-term structure.
On the 4H timeframe, the trend is still technically bearish, with a series of lower highs visible. Price is now testing the supply zone and sitting right around the previous lower low at 3,064. If ETH can break and hold above this level, it would be the first meaningful sign of a trend shift, opening the door for a move toward the major resistance band at 3,225 – 3,374.
If buyers can push higher, a pullback into support or even a revisit of the 2,950 – 2,887 order block is still likely, forming a higher low before continuation. As long as this OB area remains intact, ETH maintains a strong chance to extend upward and retest the resistance zone. But if this OB breaks, the structure weakens and price could slide back toward the deeper support at 2,761 – 2,792.
Overall, ETH returning to the monthly OB was a healthy reset. As long as this region is protected, the higher-timeframe accumulation narrative remains valid.
BTC Sector 85509.64: Capital Before the Tremor🏷 BTC Sector 85509.64: Capital Before the Tremor
🏷 19.11.2025
🏷 Capital Sector. Price Slice. System of Intelligent Anticipation. Capital Mapping — before instrument touch, this price slice is the planned action of major players.
🏷 85509.64 — As of publication, price has not yet reached this level.
🏷 The price has not yet touched the level — yet the structure already knows the path.
In the silence between orders, in the weight of unfilled volumes — the whisper of capital.
This slice is not a forecast. It is the market’s mind, frozen in numbers before the moment of truth.
🏷 Sector 85509.64 is active.
Touch — not if, but when.
Capital moves in silence.
The System sees ahead.
🏷 The light at the end of the tunnel — where others see only darkness.
🏷 — The Architect, Capital Sector

ETH/USDT 4HOUR CHART UPDATE !!ETH/USDT is retracing after being rejected by the 3,150–3,200 resistance area and the descending 200 MA, but is still trading within a larger contracting structure with higher lows forming.
The price broke above the short-term downtrend line but quickly failed near the green moving average and is now sliding back toward the confluence of old diagonal resistance and rising support around 2,850–2,900.
This zone is the first major demand zone; below it, the next major support on this chart is the wide yellow block at 2,500–2,550, where the previous strong rally began.
ETH moved sideways down inside the converging trendline, forming a base around 2,800–2,900, before a sharp move higher toward 3,300+ if buyers defend that area.
A clean 4H close below the rising lower trendline, and especially below 2,500, would invalidate the bullish consolidation idea and create room for a deeper correction towards previous higher-timeframe support.
DYOR | NFA

ETH — [2D] WEEK 49 TREND REPORT | 12/05/2025ETH — WEEK 49 TREND REPORT | 12/05/2025
Ticker: BINANCE:ETHUSDT
Timeframe: 2D
This is a reactive structural classification of ETH based on the weekly chart as of this timestamp. Price conditions are evaluated as they stand — nothing here is predictive or forward-assumptive.
⸻
1) Current Trend Condition [ Numbers to Watch ]
Current Price @ 3,030
• Trend Duration @ +70 Days ( Bearish )
• Trend Reversal Level ( Bullish ) @ 3,689
• Trend Reversal Level ( Bullish Confirmation ) @ 3,534$
• Pullback Resistance @ 3,914
• Correction Support @ 3,096$
• Structural Support @ 1,946$
⸻
2) Structure Health
• Retracement Phase:
Testing Structure (approaching 38.2%)
• Position Status:
Unstable (price below both structural layers)
⸻
3) Temperature :
Cooling Phase
⸻
4) Momentum :
Bearish
⸻
Author’s Note
DOWNWARD STRUCTURAL ALIGNMENT
This mark identifies a moment where the market showed clearer alignment with downside direction. It does not predict future movement, but acknowledges where weakness became more evident within the prevailing structure. Its relevance remains only while price continues to hold beneath key structural boundaries.
⸻
Methodology Overview
This classification framework evaluates directional conditions using internal trend-interpretation logic that references price behavior relative to its structural layers. These relationships are used to identify when price movement aligns with the framework’s criteria for directional phases, transition points, or regime shifts. Visual elements or structural labels reflect these internal interpretations, rather than explicit trading signals or preset indicator crossovers. This framework is observational only and does not imply future outcomes.

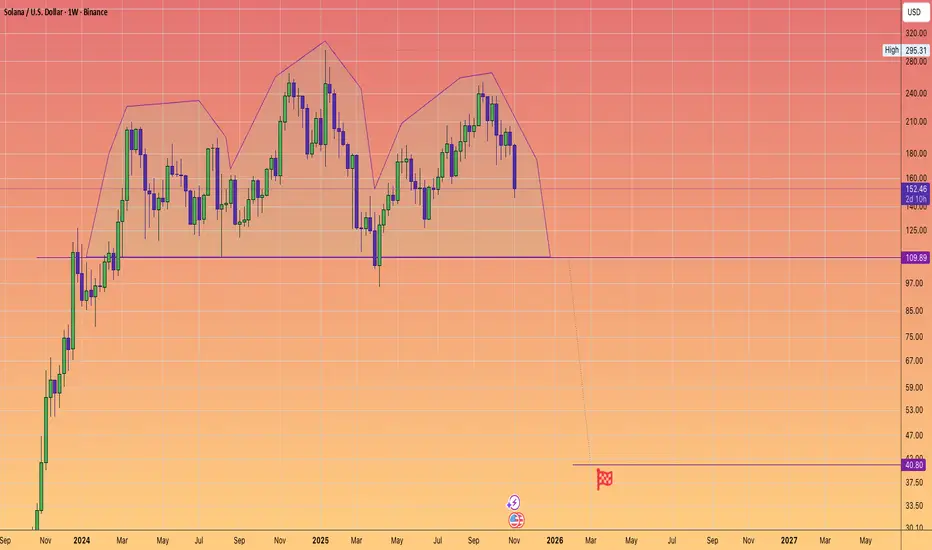
Solana could rapidly fall to $40A massive potential Head and shoulders topping exists on Solana. And many other Altcoins exhibit similar tops.
Keep nimble and protect your gains if you have them.
On the positive side, I believe the bear market will be swift and we could potentially see this number as early as next March.
Why because Solana's network effect topped on the #Trump memecoin release last January.
The solana ecosytem also enjoyed a full cycle of activity unlike other chains.
I believe there will be plenty of buyers at those prices.
ETH/USDT | The Market Is Back ? More Bullish Move Ahead?CRYPTOCAP:ETH reacted perfectly to the 2100 to 2600 demand zone and the move played out exactly as expected. After the pullback the buyers stepped in and pushed the price all the way to 3150 and right now Ethereum is trading around 3100. The broader bullish setup is still valid and as long as ETH stays above the main demand area the bigger targets at 3200 and 3500 remain on the table. For now I’m watching to see if momentum continues to build from this recovery.
Please support me with your likes and comments to motivate me to share more analysis with you and share your opinion about the possible trend of this chart with me !
Best Regards , Arman Shaban

Ethereum - Weekly Bullish Flip Above $3KEthereum Structural Reversal Complete: Weekly Candle Confirms $3000+ Hold, Targeting $4900 with $7160 Extension
Ethereum has completed a significant structural reversal with weekly candle confirmation above the critical $3000 psychological level. The 0.618 Fibonacci retracement has held on the weekly timeframe, creating a multi-month setup targeting previous highs at $4900, with extended targets reaching the 1.618 Fibonacci extension at $7160.
🎯 Setup Overview:
Current Status: Weekly bullish reversal confirmed above $3000
Critical Level: $3500 close needed to confirm continuation
Intermediate Target: $4900 (previous cycle highs)
Extended Target: $7160 (1.618 Fibonacci extension)
Position Type: Spot portfolio addition for long-term hold
📊 What Just Happened:
The Weekly Flip:
Ethereum's weekly candle closed decisively above $3000, marking the first sustained hold above this psychological level after months of consolidation and testing. This isn't a wick or a brief spike it's a confirmed close on the weekly timeframe, which carries significantly more weight than intraday or daily moves.
The 0.618 Support:
The 0.618 Fibonacci retracement level (calculated from cycle lows to previous highs) has held throughout the recent consolidation period. This golden ratio level marks where deep corrections in bull markets typically find support before resuming uptrends.
Momentum Shift:
Weekly momentum indicators have flipped from bearish to bullish. The reversal isn't just price it's confirmed by:
Volume expansion on the breakout
Momentum oscillators crossing into bullish territory
Market structure shifting to higher lows
📈 Why $3500 Is The Key Level:
The Gate to Higher Prices:
A weekly close above $3500 would accomplish several technical objectives:
Break above intermediate resistance that capped prior rallies
Confirm the $3000 level as support rather than temporary bounce
Open clear path to retest previous highs at $4900
Signal institutional accumulation phase is complete
Historical Context:
$3500 previously acted as both support (before the decline) and resistance (during recovery attempts). A clean break and hold above this level represents role reversal—former support becomes resistance becomes support again.
Why Weekly Matters:
Daily closes can be manipulated or result from short-term volatility. Weekly closes represent sustained conviction from market participants and institutional positioning that persists across multiple trading sessions.
🎯 The Target Structure:
Phase 1: $4900 (Previous Highs)
Represents the prior cycle peak
~62% upside from current $3000 level
Major psychological resistance where profit-taking will occur
First logical target for position reduction
Phase 2: $7160 (1.618 Fibonacci Extension)
Long-term extension target based on geometric progression
Represents 138% upside from $3000
Aligns with potential new cycle highs
Final target for remaining position
Why These Targets:
Not arbitrary price predictions geometric extensions based on:
Historical price structure
Fibonacci ratios that have guided ETH throughout its history
Measured moves from confirmed support levels
Previous cycle behavior patterns
📊 Technical Confluence:
Weekly 0.618 Fibonacci:
This deep retracement level held as support, indicating strong hands accumulated the pullback. When 0.618 holds, the probability of continuation to previous highs increases significantly based on historical crypto cycles.
$3000 Psychological Level:
Round numbers matter in crypto. $3000 represents a major psychological threshold that attracts both retail and institutional attention. Holding above this level shifts sentiment.
Volume Confirmation:
The move above $3000 occurred with increasing volume, suggesting accumulation from larger players rather than retail FOMO. Sustainable moves require volume validation.
Market Structure:
Higher lows are now establishing on the weekly chart. This is textbook uptrend structure after a corrective phase completes.
🛡️ Spot Portfolio Addition Strategy:
Why "Spot" Matters:
This isn't a leveraged trade or short-term speculation. This is spot accumulation for a multi-month to multi-year position. Key differences:
No liquidation risk
Can weather volatility without forced exits
Designed to capture structural moves, not daily swings
Appropriate for long-term asymmetric bet on crypto adoption
Position Sizing:
Crypto allocation should be sized according to:
Personal risk tolerance (typically 5-10% of portfolio max)
Ability to withstand 30-50% drawdowns without panic
Long-term conviction in Ethereum's utility and adoption
Understanding this is a high-risk, high-reward allocation
Entry Approach:
Primary entry: Current $3000+ zone (confirmed support)
Additional entry: Pullback to $3200-3300 if opportunity presents
Final add: On confirmed break above $3500 (momentum confirmation)
This staged approach improves average entry while maintaining conviction.
📈 Why Ethereum for Long-Term Hold:
Fundamental Backdrop:
Ethereum 2.0 transition to proof-of-stake complete
Growing DeFi ecosystem with real utility
NFT and tokenization infrastructure
Institutional adoption increasing (ETFs, corporate treasury)
Deflationary tokenomics post-EIP-1559
Market Position:
ETH represents the second-largest cryptocurrency by market cap with established network effects, developer activity, and institutional recognition.
Risk Acknowledgment:
Crypto remains highly speculative and volatile. Regulatory uncertainty, technological risks, and market sentiment shifts can cause dramatic price swings unrelated to technical structure.
🧠 Why Most Will Miss This Setup:
Fear from Past Pain:
Many traders were hurt during the drawdown from previous highs. That emotional scar makes re-entry uncomfortable precisely when risk/reward is most favorable.
Waiting for "Confirmation":
By the time $4000 or $4500 "confirms" the move, the best risk/reward is gone. Entry at $3000 with $2700 stop offers far superior asymmetry than entry at $4000 with $3500 stop.
Disbelief After Consolidation:
Long consolidation periods create disinterest. When breakouts finally occur, many aren't watching anymore yet these are often the highest-probability setups.
Recency Bias:
Recent sideways action makes traders assume more sideways action. Weekly timeframe reversal suggests the character of price action is changing.
📊 Fibonacci Extensions Explained:
Why They Guide Long-Term Moves:
Fibonacci extensions (1.272, 1.618, 2.618) project where impulse waves typically complete based on the size of previous moves. The $7160 target (1.618 extension) isn't random—it's a mathematical projection.
Historical Validation:
Throughout crypto history, major bull moves have repeatedly respected these extension levels. Bitcoin, Ethereum, and other major assets have demonstrated this pattern across multiple cycles.
How to Use Them:
Identify completed corrective structure (0.618 support held)
Measure from correction low to breakout high
Project extensions for potential targets
Use these as profit-taking zones, not guaranteed destinations
📅 Timeframe Expectations:
Multi-Month Position:
From $3000 to $4900 could take 3-6 months depending on momentum and broader crypto market conditions. This isn't a swing trade—it's a position trade.
From $4900 to $7160:
If achieved, this extension could take 6-12+ months and likely requires favorable macroeconomic conditions and continued crypto adoption narratives.
Volatility Acceptance:
Expect 15-25% pullbacks even within a bull move. Spot positions can weather this; leveraged positions cannot. This is why spot allocation matters.
⚠️ Risk Factors:
Crypto Volatility:
30-50% drawdowns are normal in crypto, even during bull markets. Position sizing must accommodate this reality without forcing emotional exits.
Regulatory Uncertainty:
Government actions on crypto regulation, particularly in major markets like the US and EU, can cause rapid sentiment shifts.
Macro Environment:
Crypto correlates with risk assets. Fed policy, recession fears, and liquidity conditions affect crypto prices significantly.
Technical Failure:
If Ethereum closes back below $2700 on a weekly basis, the 0.618 support thesis breaks and the bullish structure is compromised. This requires disciplined reassessment.
$3500 Rejection:
Price could fail at $3500 and consolidate longer before attempting higher targets. Patience required if this scenario plays out.
🏆 The Long-Term Investor Approach:
They Buy Structure, Not Hype:
The weekly 0.618 hold + $3000 breakout provides objective structure. No need for hopium just probability-based positioning.
They Size Appropriately:
5-10% crypto allocation allows exposure to asymmetric upside while containing downside to manageable levels if thesis fails.
They Think in Cycles:
Crypto moves in multi-year cycles. Current positioning is for the next expansion phase, not next week's price action.
They Scale Out at Targets:
Reduce 1/3 at $4900 (books significant profit, removes emotion)
Reduce 1/3 at $5800-6000 (locks more gains if extension occurs)
Final 1/3 at $7160 or trailing stop (maximizes upside while protecting capital)
📌 Key Takeaways:
✅ Weekly confirmation matters: Daily noise is filtered out; weekly close above $3000 signals structural change.
✅ 0.618 support held: This Fibonacci level has historically marked the end of corrections in crypto bull markets.
✅ $3500 is the gateway: Close above this level opens clear path to retest $4900 highs with minimal resistance.
✅ $7160 represents geometric extension: Not speculation mathematical projection based on Fibonacci ratios that have guided ETH historically.
✅ Spot allocation appropriate: Long timeframe, high volatility, and asymmetric potential make this a spot hold, not a leveraged trade.
⚠️ Important Disclaimers:
This analysis is for educational purposes and reflects a technical view based on weekly timeframe structure, Fibonacci analysis, and crypto market cycles. It is not financial advice or a recommendation to buy or sell Ethereum or any cryptocurrency.
Cryptocurrencies are highly speculative and volatile. Price can drop 30-50% in days regardless of technical structure. The $7160 target represents a mathematical extension, not a guaranteed destination.
Regulatory risk, technological vulnerabilities, and market manipulation are inherent to crypto markets. Past cycle behavior does not guarantee similar patterns will repeat.
The 0.618 support could fail. If Ethereum closes below $2700 on a weekly basis, the bullish thesis is compromised and requires immediate reassessment.
Only invest capital you can afford to lose completely. Crypto allocation should be sized as high-risk, high-reward portion of diversified portfolio. Consider consulting a financial professional and understand the technology and risks before investing.
All cryptocurrency investing involves substantial risk of loss.
✨ Join the Discussion:
Are you accumulating Ethereum at these levels? How do you approach spot crypto allocation in your portfolio? Share your perspective in the comments.
📜 Buy structure. Think in cycles. Hold with conviction.

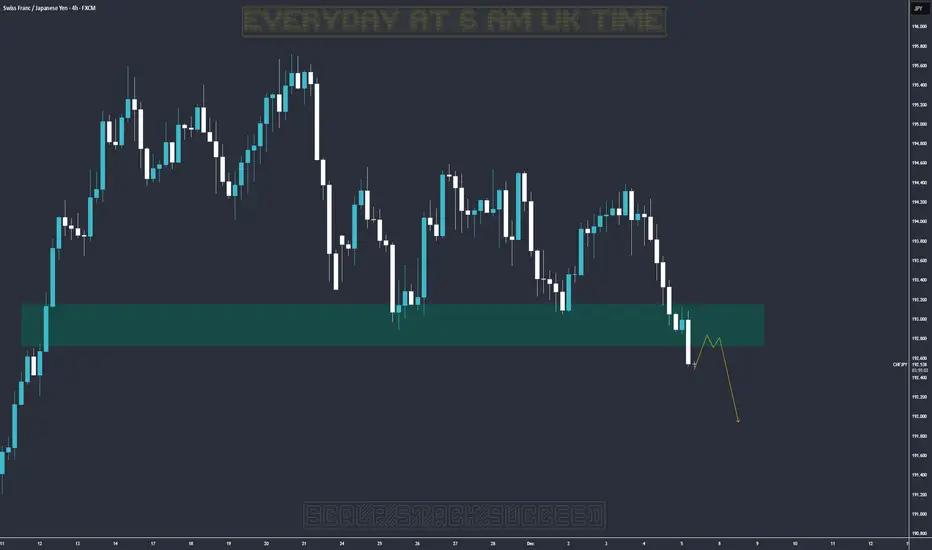
QuickScalp on #CHFJPY📌 Market Insight: {#CHFJPY }
⚠️ Risk Assessment: {High}
🚀 Approach:
Not a Quality Setup ... Need VALID LTF entry Sign first ! ... NO RUSH... Its friday i rather to have NO trade than have a RISKY trade .
#Ash_TheTrader #Forex #GBPJPY #MarketAnalysis #TradingSetup #RiskManagement #GOLD #Scalper #NQ #EURUSD
ETH 1D – FVG Filled/Fib Reset Tagged, Is the Reversal Starting?ETH may finally be showing signs of downtrend exhaustion. Price has tapped the Fib Reset Zone, filled the July Fair Value Gap, and bounced cleanly from long-term Trendline Support — a combination that often marks the end of corrective phases.
The declining 50 and 100 EMAs still act as dynamic resistance overhead, but the market is now pressing into them with higher momentum. Reclaiming these EMAs would be the clearest structural shift signaling that the downtrend may be ending.
If ETH loses trendline support, the demand zone below becomes the next logical retest. But as long as price remains above the diagonal and continues building higher lows inside this reset structure, the probability of a reversal increases.
Stoch RSI remains overbought, so short-term cooling is possible — but structurally, ETH is completing all the ingredients needed for trend reversal: FVG filled, retracement satisfied, and support holding.

ETHEREUM → The emergence of a positive driver?BINANCE:ETHUSDT is soaring amid a news rally and testing resistance at 3230. The daily increase was almost 20%. If growth is expected, then after a slight correction...
Fundamental background: the market reacted to rumors of the replacement of the Fed chairman with Kevin Hassett, who is more “dovish” and loyal to cryptocurrencies. The market broke the local structure and updated the interim maximum from 3070 to 3230. A false breakout of resistance is forming relative to the key resistance level, and the market is entering a correction/stagnation phase.
Bitcoin, the main driver of the cryptocurrency market, faced strong resistance at 95K. The global market trend is downward, and a change in trend will require time and more confirmation...
There is a struggle for resistance in the market, and several scenarios are possible: consolidation and a breakout of resistance, or growth after correction...
Resistance levels: 3230, 3370
Support levels: 3172 (local), 3057
High probability: a false breakout of 3230 will trigger a correction to 3050 (before the news). If the bulls keep the price above 3050, growth may continue as part of the change in the fundamental background.
BUT! If buyers keep the price without correction, then the focus will be on 3230. Consolidation above this level could trigger growth to 3370 - 3620.
Best regards, R. Linda!

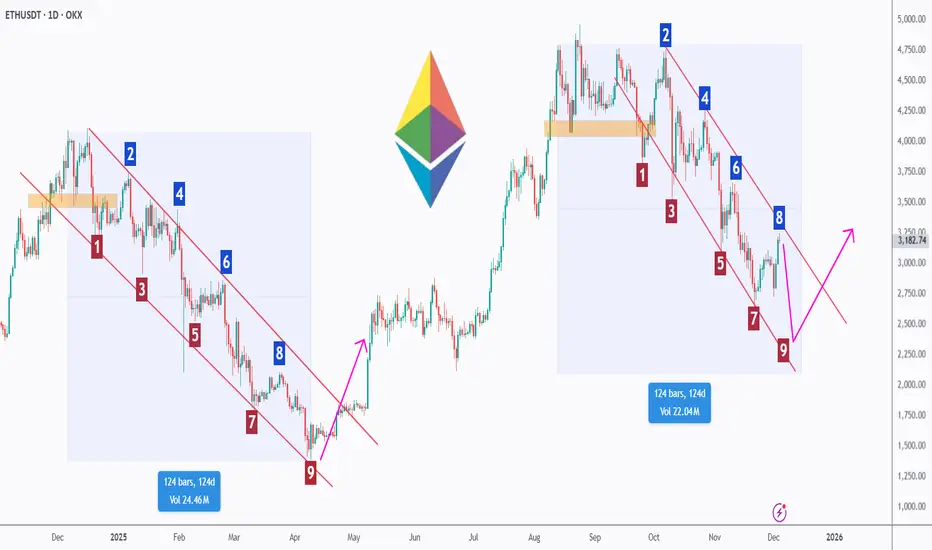
ETH - Same Pattern. Same Timeline. Same Outcome?Ethereum is showing something extremely interesting… and extremely familiar.
When we compare the previous corrective cycle to the current one, both have unfolded almost identically, not just in structure, but also in duration, each measuring around 124 days.
🌊Both cycles followed a clean 1-to-9 wave sequence inside a falling channel before ETH broke out aggressively. And right now, ETH is completing the same exact structure, approaching wave 9 once again.
🔄If history rhymes, and it often does in crypto, ETH may be preparing for a major impulsive phase, similar to what happened after the previous 124-day correction.
From the lower bound of the channel, we will be looking for trend-following longs, anticipating a potential bullish reversal that mirrors the last breakout.
Cycles don’t repeat perfectly…
But they rhyme more often than people think. 📈✨
⚠️ For now, the trend remains bearish, however, ETH would invalidate the entire bearish structure if the upper trendline breaks upward aggressively, signaling that bulls have fully taken over.
Do you believe ETH is about to repeat its previous breakout? Share your view below! 👇🔥
⚠️ Disclaimer: This is not financial advice. Always do your own research and manage risk properly.
📚 Stick to your trading plan regarding entries, risk, and management.
Good luck! 🍀
All Strategies Are Good; If Managed Properly!
~Richard Nasr
EDENUSDT Glory WeekEDEN tapped into raw momentum, ripping upward before cooling off into a smooth pullback. The structure still favors the bulls, and support is holding strong.
If EDEN catches fresh volume, a sharp rebound toward previous highs isn’t far. This chart looks like it wants another run.

ETHEREUM to 15kCan Ethereum rally like it did from April to August 2025, or is this an inverse head and shoulders that could take it to 15k?

Could we see a reversal from here?ETH/USD is reacting off the pivot which has been identified as an overlap resistance and could reverse to the pullback support.
Pivot: 3,238.27
1st Support: 2,962.76
1st Resistance: 3,371.27
Disclaimer:
The opinions given above constitute general market commentary and do not constitute the opinion or advice of IC Markets or any form of personal or investment advice.
Any opinions, news, research, analyses, prices, other information, or links to third-party sites contained on this website are provided on an "as-is" basis, are intended to be informative only, and are not advice, a recommendation, research, a record of our trading prices, an offer of, or solicitation for, a transaction in any financial instrument and thus should not be treated as such. The information provided does not involve any specific investment objectives, financial situation, or needs of any specific person who may receive it. Please be aware that past performance is not a reliable indicator of future performance and/or results. Past performance or forward-looking scenarios based upon the reasonable beliefs of the third-party provider are not a guarantee of future performance. Actual results may differ materially from those anticipated in forward-looking or past performance statements. IC Markets makes no representation or warranty and assumes no liability as to the accuracy or completeness of the information provided, nor any loss arising from any investment based on a recommendation, forecast, or any information supplied by any third party.

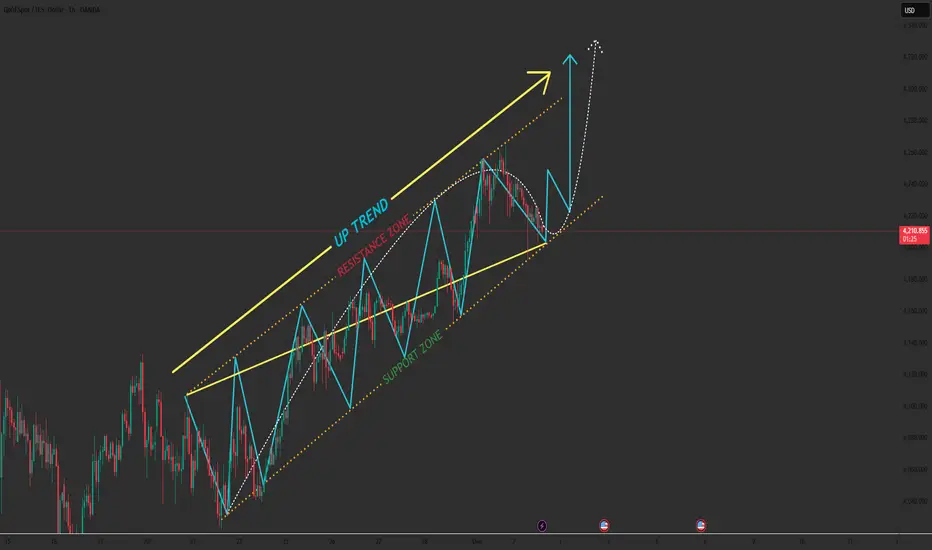
The Pullback Everyone Fears… But Smart Traders Are Waiting For1️⃣ Price Retracing Into Key Support
Gold is dipping into the support zone just below yesterday’s low.
This zone aligns with:
- The lower boundary of the short-term retracement channel
- The midline of the major ascending channel
- A liquidity pocket where buyers previously stepped in aggressively
This creates a textbook buy-the-pullback setup.
2️⃣ Trend Structure: Buyers Still in Control
Despite the temporary pullback:
- Trendline remains intact
- Momentum is still upward
- No major swing low has been broken
As long as 4,190 holds, the market favors continuation to the upside.
3️⃣ Expected Upside Rotation
If price stabilizes above 4,190–4,200 and intraday buyers return:
- Gold may begin a new bullish swing
- First target sits at 4,260
- Main target aligns with the upper boundary of the channel → 4,290
This completes the wave cycle shown in the chart (blue pattern).
4️⃣ Risk Scenario
⚠️ If Gold cleanly breaks below the channel and invalidates the trendline:
Price can correct toward 4,120 and even retest 4,100 before rebuilding bullish structure.
This does not kill the uptrend — but it delays the next bullish leg.
➡️ Primary Scenario
Pullback holds above 4,190 → bullish continuation → target 4,260 → 4,290.
⚠️ Risk Scenario
Break below the channel = short-term drop toward 4,120–4,100.
If this analysis resonates with you or if you see a different angle drop your thoughts in the comments. I’d love to hear your view!
Tired of Entering Too Late? Here’s the Setup You Shouldn’t Miss1️⃣ Key Resistance Zone Rejected
Price tapped into the resistance area around 1.1638 – 1.1652, which previously acted as a strong supply zone.
The sharp wick rejection signals that buyers were unable to maintain momentum.
This is a high-probability reversal behavior.
2️⃣ Market Structure: Rounded Top + Liquidity Grab
The rounded top formation indicates slowing bullish momentum.
The long upper wick suggests a liquidity sweep before the expected bearish leg.
This aligns with institutional behavior:
➡️ sweep liquidity → fill orders → drop.
3️⃣ Short Entry Confirmation
The chart clearly marks the ideal ENTRY SHORT as the candle rejects resistance.
Entry Zone: 1.1635 – 1.1650 (depending on spread)
Stop Loss: Above 1.1652
Take Profit: Targeting the weak support zone and then deeper into the strong support below.
4️⃣ Expected Price Path
Based on structure + support layers:
- First drop toward 1.1570 – 1.1560
- Beak of this level → continuation to the 1.1551 zone
- If momentum is strong, eventual return to the major support block
This aligns with the clean pullback–drop model typical in a trending market.
📌 Summary
This is a textbook short setup:
- Clear resistance rejection
- Liquidity sweep
- Bearish structure forming
- Targets lining up with both weak and strong support levels
High-probability trade for sellers.

The Convergence and Evolution of AI and BlockchainThe Convergence and Evolution of AI and Blockchain: Reconstructing Productivity and Production Relations in the New Digital Economy Paradigm
Authors: SanTi Li, Chunfeng Jun, Lisa, Nahida
Abstract: Current market discussions regarding the relationship between Artificial Intelligence (AI) and Blockchain (Crypto) are often limited to a zero-sum game perspective focusing on liquidity fragmentation. However, in-depth industry analysis and technological evolutionary paths suggest that the two are, in fact, complementary and symbiotic. Against the backdrop of AI driving exponential productivity growth and trending digital content supply toward infinity, the reconstruction of production relations and ownership mechanisms based on blockchain is not merely "icing on the cake," but a fundamental necessity. This article aims to deeply analyze—from the dimensions of reshaping trust mechanisms, establishing ownership systems, shifting economic paradigms, the importance of Tokens as value carriers, and risk control—why the widespread adoption of AI will become the core driver and accelerator propelling blockchain technology from fringe experiments to large-scale application.
1. The Digital Trust Crisis in the Wake of the AI Explosion
With recent breakthrough advancements in AI technology, particularly the widespread application of Large Language Models (LLMs) and Generative AI (AIGC), the core economic significance lies in reducing the marginal cost of content production to near zero. While this has tremendously unleashed social creativity and productivity, it also poses an unprecedented challenge to the existing internet ecosystem, leading to drastic changes in the information environment.
Entropy Increase and Distortion in the Digital Information Ecosystem: With the proliferation of Synthetic Media and Deepfakes, the internet faces the tangible risk of the "Dead Internet Theory." Under this theory, the vast majority of network traffic and content will be generated by bots. When the cost of forging video, audio, and text is extremely low and can achieve pixel-level realism,⚡ the traditional cognitive argument of "seeing is believing," which sustains social operations, faces a total threat of failure in the digital realm. Political elections could be disrupted by forged scandal recordings, and financial fraud can be perpetrated against individuals via real-time face-swapping. These are no longer sci-fi scenarios from Black Mirror, but imminent realities.
Exacerbated Information Asymmetry and Cognitive Overload: When the rate of machine-generated content exceeds human creation by several orders of magnitude, high-quality authentic information risks being submerged. Humans face exponentially rising screening costs when ensuring the veracity of massive amounts of machine-generated information that may carry specific biases or misleading data. This information overload not only reduces decision-making efficiency but may also lead to a tearing of social consensus. In particular, 👼t he new generation growing up with AI will have a much higher degree of trust in AI than the generation that invented AIGC, thereby increasing the probability of being misled or blindly following algorithms.
The Scarcity of Human Inspiration Amidst AI Convenience: It is well known that a significant part of the value distinction between humans and robots lies in human inspiration, which is difficult for AI to mimic. However, human laziness is also a driver of technological progress. Due to the immense increase in convenience, reliance on AI may make future inspiration an absolute "luxury." Meanwhile, the intellectual property of these inspired creators is being ruthlessly plundered and diluted by the extreme speed of AIGC (much of current secondary creation involves unauthorized "content spinning"). Without technical means of protection, the motivation for original human creation will dry up.
In this context, the primary systemic risk facing digital society is not the awakening or rebellion of AI, but the complete collapse of the bedrock of social trust. Building a verification mechanism that can effectively distinguish truth from falsehood, establish information sources, and remain tamper-proof has become a necessary condition for maintaining a healthy digital ecosystem—and this is precisely where blockchain technology finds its purpose.
2. Blockchain Ownership: Evolving from "Optional Component" to Digital Infrastructure
In the "infinite supply" model constructed by AI, scarcity will become the core anchor of digital asset value. Without scarcity constraints, the value of digital content will approach zero as supply increases infinitely, much like a flood of diamonds.💎 Blockchain technology, as a decentralized distributed ledger, functions essentially to establish digital scarcity and ownership attribution through cryptographic means, thereby re-imbuing digital assets with value.
Institutionalization of Data Provenance: As the barrier to content generation lowers, distinguishing between "human creation" and "AI generation" becomes crucial. In 2022, a custom hand-drawn cartoon could sell for hundreds of dollars💵💴(I bought it 🥹), whereas in 2025, similar non-high-precision custom content can be completed in seconds. The on-chain storage of high-value data (such as news reports, artistic creations, legal contracts, academic papers, and identity information) will become an industry standard. Every digital file will need to carry an unforgeable "birth certificate" and "chain of custody." Digital content lacking a Cryptographic Signature and on-chain timestamp will face a severe "trust discount." The combination of C2PA (Coalition for Content Provenance and Authenticity) standards and blockchain technology will build a trusted verification layer for digital content, making the source and modification history of content transparent to all.
Proof of Personhood and Anti-Sybil Attacks: In an era where automated bots can pass the Turing Test and flood the network, the economic and social value of verifying a user's "human identity" is increasingly prominent. Traditional CAPTCHAs are gradually failing and cannot stop advanced AI Agents. Identity verification systems combining biometrics and Zero-Knowledge Proofs (ZKP) will become key infrastructure for distinguishing human users from AI agents. This is not only to prevent airdrop farming but also to prevent online voting and public opinion manipulation by zombie botnets.
In summary, AI creates an infinite supply of productivity, while blockchain provides trusted scarcity constraints and identity anchors. Logically, the two constitute indispensable complementary gears in the digital economy loop: AI makes the world "faster," and Blockchain makes the world "truer."🚀
3. Reconstruction of the Commercial Paradigm: Autonomous Agent Economics
The combination of AI and blockchain heralds a brand-new mode of economic interaction—the rise of the Machine-to-Machine (M2M) economy. This is not just a change in payment methods, but a fundamental transformation in the nature of economic entities.
Future internet interaction subjects will no longer be limited to humans; billions of Autonomous AI Agents will become natives of cyberspace. Traditional financial infrastructure (such as bank accounts, KYC processes, credit card payment networks) is designed for humans; it does not possess the capability to serve non-human subjects, nor can it meet the demands of high-frequency, micro-amount, 24/7 machine transactions.
Machine-Native Currency Systems: Cryptocurrency is a medium of value exchange naturally adapted to machine logic. AI agents cannot walk into a bank branch to open an account, but they can instantly generate wallet addresses via code and manage private keys. They can utilize stablecoins (like USDC) or specific utility tokens for data procurement, API calls, or computing power leasing. This payment method is not constrained by the intermediary barriers, business hours, or high cross-border fees of traditional finance.
Agent-to-Agent (A2A) Economic Networks: The future commercial landscape will evolve beyond B2B and B2C models toward an A2A (AI Agent-to-AI Agent) 🤖model. For example, an AI Agent responsible for itinerary planning may need to purchase real-time data from another Agent responsible for weather forecasting and pay a deposit to a third Agent responsible for ticket booking. These service exchanges involving micropayments and high-frequency transactions are only economically feasible when relying on high-performance, low-friction blockchain networks. Smart contracts will automatically execute these complex business logics without human intervention.
Synergy with Decentralized Physical Infrastructure Networks (DePIN): The operation of AI requires massive amounts of computing power (GPUs) and data. Through DePIN networks (such as io.net, Render, Gensyn), AI Agents can directly lease idle personal or corporate computing power globally and settle in real-time using Tokens. To a certain extent, this breaks the monopoly of centralized cloud service providers (AWS, Google Cloud), reducing the operational costs of AI. It also provides real utility scenarios for blockchain (although initially, the core source of computing power may still come from traditional giants, in the long run, this model will empower market autonomy and gradually dismantle absolute monopolies).
It is foreseeable that while human users conduct daily mobile payments, AI Agents will automatically complete massive value exchanges on backend blockchain networks, forming a colossal and efficient shadow economy.
4. Crypto: The Value Carrier and Symbiotic Engine of Ownership in the AI Era
Blockchain is not just a database; it is a value network. After clarifying the technical level of anti-counterfeiting/provenance (Section 2) and the commercial level of agent interaction (Section 3), we must delve into the core of assets and finance. Property Rights are the prerequisite for transaction and pricing. In the "infinite supply" model constructed by AI, relying solely on technical means for "anti-counterfeiting" is far from sufficient. We can use Crypto to truly Tokenize and Financialize these rights, giving rise to the RWA (Real World Asset) concept.
The Token, as the granular carrier of ownership and the lifeblood of equity circulation, constitutes the indispensable digital property rights cornerstone of the AI era. This upgrades AI and Crypto from a simple "tool stacking" to a deep "symbiotic evolution."
Tokenization🪙: Transforming abstract rights into programmable digital assets. Crypto uses NFT (Non-Fungible Token) and SFT (Semi-Fungible Token) technologies to transform abstract intellectual property (IP), ownership, copyright📜, unique datasets, fine-tuned model parameters, or even the ownership of an AI Agent itself into unique, immutable on-chain assets.
IP-NFTs as Value Anchors: Every unique style or original work of a human creator can be minted as an NFT. When AI needs to access these works for training or style transfer, it is no longer a traceless plunder but must obtain NFT authorization through on-chain protocols. Here, the Token is not only a copyright certificate but also proof of the right to earnings. For example, RWA music projects like Opulous and Audius tokenize artists' album rights to share revenue with fans in advance.
Data Assetization (Data Tokens): High-quality data from individuals or companies is no longer a static file but an asset that can be encapsulated into Tokens for trading. Every time an AI model calls upon data, it essentially consumes the rights represented by that Token, thereby generating refined revenue and rights protection.
Crypto: Realizing Immediate Settlement and Circulation of Ownership Value Ownership is meaningless if it is not linked to value distribution. Digital currency provides the only execution layer for equity ownership in the AI era.
Micropayments and Streaming Payments: In the high-speed operation of AI, ownership verification often occurs at the millisecond level (e.g., AI quoting a sentence or generating an image). Traditional fiat currency systems cannot handle such extremely small amounts ($0.0001) and high-frequency copyright revenue sharing. Digital currency (Crypto) enables smart contracts to automatically "stream" revenue to Token holders the instant ownership is verified, realizing a closed loop of "use equals ownership verification, ownership verification equals settlement."
Construction of the Incentive Layer: Why would humans spend energy verifying the authenticity of AI content? Why would nodes contribute computing power to maintain network consensus? Because there is Crypto as an incentive. Tokenomics rewards participants who maintain the ownership system through digital currency, thereby building a self-running trust network resistant to AI attacks. This is also the core value of public chain systems and corresponding projects; the internal circulation or local circulation models of consortium chains and private chains are difficult to generalize to a larger scale.
The Co-Evolution of AI and Crypto: A Double Helix Ascent
AI Needs Blockchain/Crypto: Without the ownership and payment facilities provided by blockchain systems, AI creators and users will easily fall into a dead end of rampant piracy, data exhaustion, and inability to monetize. The smarter the AI, the more it needs clear property boundaries to avoid disputes. The current freshness of AI creation exists because of the accumulation of data and creative sharing over the past decades; when these accumulations are exhausted, whether new creativity can fill the gap depends heavily on the meticulous protection of rights.
Crypto Needs AI: AI creates massive amounts of digital assets and high-frequency trading scenarios, providing unprecedented Utility and liquidity for Crypto.
This symbiotic relationship indicates that Crypto is the "Physics" and "Economic System" of the AI era. The combination of the two will reconstruct the production relations of the digital world, allowing the productivity dividends of AI to be fairly returned to every participant through ownership mechanisms.
5. Risk Governance: The Paradigm Shift from "Moral Self-Discipline" to "Technical Constraint"
Current AI development is highly concentrated in a few tech giants (like OpenAI, Google, Meta), continuing the centralized black-box logic of the Web 2.0 era. In this model, the public can only hope that companies maintain a moral self-discipline of "Don't be evil." However, historical experience shows that centralized power is often accompanied by risks of monopoly, data abuse, and algorithmic bias.
Blockchain technology introduces a governance logic of "Can't be evil," strictly constraining system behavior through open-source code, cryptographic proofs, and mathematical contracts:
Zero-Knowledge Machine Learning (ZKML): As an important branch of privacy computing, ZKML allows verifying through mathematical proofs that the inference process of an AI model was executed according to a set algorithm and has not been tampered with, without revealing underlying sensitive data (such as medical records, financial transactions) or core model parameters. This ensures the transparency and auditability of algorithmic decisions, which is crucial for AI applications in high-risk fields like medical diagnosis and credit assessment, solving the "black box trust" problem.
Moreover, public chains that have experienced multiple bull and bear cycles offer a degree of reputational assurance. #NEAR has fully pivoted to AI as the first AI public chain, while projects like Render have transformed from game rendering to AI computing power. BINANCE:ETHUSD ETH, BINANCE:BNBUSDT BSC, #Solana, Cardano, BINANCE:AVAXUSDT #Avalanche, Algorand, Hbar, BINANCE:CFXUSD #Conflux, and others all have their own unique domain advantages, technical characteristics, and deficiencies. Emerging public chains like #Monad BYBIT:MONUSDT are also facing a new round of tokenomics examinations. Addressing the "VC long-cliff" unlock model that has plagued the primary market in the past two years—where institutional chips are locked, but project ecosystem incentives and airdrops circulate early, leading to heavy selling pressure—the market still needs 1-2 years to verify the balance between their token release curves and ecosystem value capture.
Data Sovereignty and Value Distribution: Addressing the widespread issues of data infringement and "data harvesting" in large model training, blockchain projects can return data ownership to users, allowing them to selectively authorize data for training and receive earnings. This reconstructs production relations, enabling data contributors to receive reasonable value returns through Token economic models, thereby incentivizing a higher quality data supply and avoiding the "tragedy of the commons" regarding data exhaustion.
6. Conclusion: Digital Civilization's Dialectic—Reshaping the Future in Chaos and Order
The essence of Artificial Intelligence tends toward entropy increase—it brings about an explosive generation of information, rapid expansion of boundaries, and future uncertainty. The essence of Blockchain, however, tends toward entropy reduction—it strives to establish immutable contracts, anchor unique factual truths, and solidify execution rules.
A robust digital world cannot be composed solely of vibrant "chaos" or absolutely stable "order." The deep integration of AI and Blockchain is not a simple technological stacking, but the inevitable result of the digital ecosystem seeking dynamic equilibrium. If AI is the nuclear power engine driving digital civilization forward, then Blockchain is the navigation system and safety foundation ensuring it does not derail.
For investors and industry practitioners, understanding this "Double Helix" evolutionary trend means grasping the underlying code of digital economic development for the next five to ten years. Our gaze should not be limited to the AI computing power race but should also extend to the Web3 infrastructure layers that provide payment settlement, property definition, and value circulation for silicon-based life.
The future has arrived. This great convergence, beginning with technology and ending with institutions, is on the eve of explosion.
Disclaimer: This article is for educational purposes only. Projects mentioned are for relatively objective description and do not constitute investment advice. Please perform your own research (DYOR).

ETH/USDT 1DAY CHART ANALYSIS !!ETH/USDT on the 1D chart is in a corrective downtrend but currently bouncing toward a major resistance supply zone around 3,500–3,700 USDT.
Price broke below the rising trendline and retested lower, confirming a shift from a strong uptrend to a corrective phase; the main support below is the 2,400–2,550 demand area where the last major rally started.
Above, the grey 3,500–3,700 band is a strong supply/resistance zone formed by prior consolidation and distribution before the last drop, while the top range resistance sits near 4,800.
Bull case: If bulls can push price into the grey zone and break/close decisively above it, structure improves, and ETH can target the upper range toward 4,400–4,800 again.
Bear case: Rejection from the grey zone would likely send ETH back down toward the yellow 2,400–2,550 support, and losing that opens room for a deeper slide toward the 1,400 and 1,000 higher‑timeframe supports marked below.
DYOR | NFA

the rise of eth.good eve'
i bring you this really clean chart today.
ethereum divided by bitcoin.
historically, after bitcoins run, money begins to rotate into ethereum, and then into alt coins.
i believe we are at the edge of what could be a pretty solid run in the ethereum ecosystem,
especially since the fusaka upgrade is now live.
scaling eth has never been easier, nor faster, and we believe the speeds are only going to improve as the devs create more breakthroughs in their research.
---
eth/btc came down in a clean 3 wavy move from the recent highs in august.
i choose to label it as a triple zig-zag, the same way i choose to label both eth + btc's waves during the same timeframe.
3-3-3, hypothetically completing at the recent low.
if my postulation is correct, ethereum should return to its all time highs. if it does, and there's enough momentum, we could enter into a price exploration.
not sharing any real targets beyond the ath.
---
eth/btc 🎯 = 0.04327

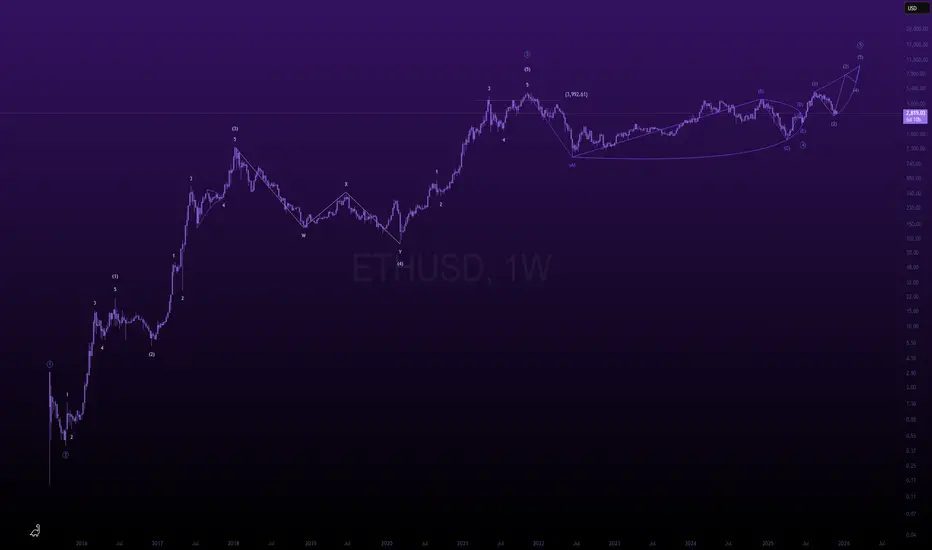
here's how ethereum reaches 10k in 2026.gm,
as promised in yesterdays post, i'd share my macro ethereum case if my post got 5 likes.
---
lets start with the basics,
going back to 2015, ethereum came up in a 1-2 1-2
ever since those times, the impulse has been unraveling very nicely.
i postulate that the 2021 peak was the wave (3) high,
and ever since then, ethereum has been consolidating in a wave (4) - contracting triangle.
some might call it a re-accumulation, but i personally view it as a distribution.
old hands, distributing to new hands,
new hands end up holding price up,
and even create another leg up, but it gets faded.
in wyckoff distribution terms, this final leg up is referred to as "utad test".
in elliott wave theory terms, the final fifth wave out of a triangle is a "thrust".
both are, by design, quick and usually artificially created to create a final exit liquidity event.
---
it's tough to say how high we will go,
but based on our research, generally speaking -
if w3 sees an extension, w5 usually sees a truncation (slightly higher high, or even a double top).
based on this information, i level with you and say, ethereum finishes its macro bull count through an ending diagonal, around 10k. this allows momentum to taper off, and distribution phase to complete with a proper up-thrust-after-distribution.
---
🎯 = 10-12k