the real question is what happens to $ETH at ATH?eth is currently holding above the quarter channel with resistance above between 3500-ATH
there is a potential moonshot to 7k and beyond (13k?), if the markets are indeed in the infant stage of a bull run.
for now eth is heading towards the golden pocket of the move down with support from ath avwap
as htf bullish market structure never broke this could mean that the highs are ran, rsi has bounced the mid point and could be cruising towards the cook zone again, its here i will watch to see a divergence form when the 3M OB and yearly level is approached.
upside 3500, 4500/ATH, 7000, 130000
downside 1900, 1200, 800
its quite possible that we put in a long term range drifting between 5k and 1k before we see expansion upwards
nfa, just food for thought on the htf but most of the volume is supporting price.
ETH

ETHUSDT.P - November 1, 2025ETHUSDT.P is forming a corrective pullback within an intraday bullish structure, maintaining higher lows from the recent swing base. A buy limit order is positioned near $3,850, anticipating continuation toward the $3,891 resistance target. The stop-loss is set around $3,828 to manage downside risk. A rebound from the order zone would confirm bullish momentum resumption, while sustained price action below $3,828 would invalidate the setup.

Will Ethereum’s tight range lead to a breakout? | Day 34☃️ Welcome to the cryptos winter , I hope you’ve started your day well.
⏰ We’re analyzing BTC on the 1-Day timeframe .
👀 Ethereum on the daily timeframe. Ethereum is currently inside a box-like structure in a trading range format. The top of this trading range is in the $4,161 area, and the bottom of this trading range is in the $3,801 price area, where by breaking these zones, Ethereum can start a stronger and more impulsive leg of movement.
🧮RSI oscillator, which has now formed two important oscillation zones for us — one around 54, which overlaps with our long trigger, and the other around 40, which overlaps with our short trigger. The fluctuation limit crossing these zones can give more momentum to Ethereum’s next move on the daily timeframe.
🕯 Ethereum’s volume, after the flash crash the market experienced, has increased sharply, but the tendency has been pushed toward selling pressure, which has caused Ethereum’s corrections to always come with selling pressure.
📈 For Ethereum positioning, the specified zones have high price action validity, where you can set alerts so that if the price reaches these zones, you can open a position. Or, in the multi-timeframe, you can find the identified support and resistance zones and open positions with lower risk around these areas, moving toward anticipating higher or lower levels, so that in each level, you can add some risk to your position.
❤️ Disclaimer : This analysis is purely based on my personal opinion and I only trade if the stated triggers are activated .

Ethereum Analysis (2H)In the lower timeframes, after the major dump forming wave A, it seems that wave B has developed as a diametric pattern, with one remaining leg wave g. Wave g is bullish and could target the levels marked on the chart:
targets : 3920$ - 4038$ _ 4142$
The green zone represents the entry area, which is likely to be retested.
For risk management, please don't forget stop loss and capital management
When we reach the first target, save some profit and then change the stop to entry
Comment if you have any questions
Thank You

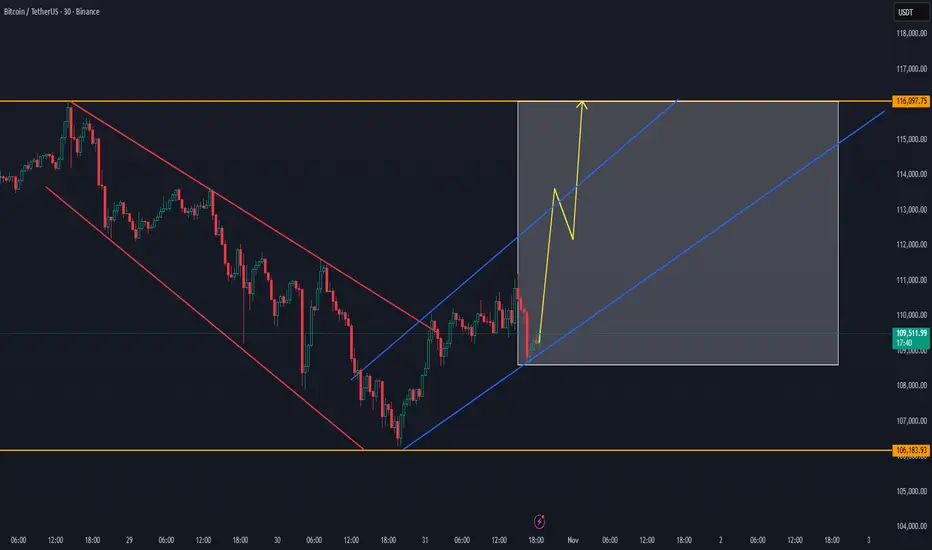
BTC Weekend Setup — Possible Volume Push Toward 116KBTC Weekend Setup — Possible Volume Push Toward 116K 🔥
Coinbase effect + China can play an important role for the breakout of 116K+
Bitcoin has broken out of its descending channel, reclaiming structure and showing early signs of strength.
Momentum is gradually building within the new ascending trend, suggesting that the weekend could bring a volume expansion targeting the 116K zone.
📈 Technical Outlook:
BTC successfully flipped the 106K–108K area into support.
The new uptrend channel is forming higher lows and showing a steady recovery pace.
Volume remains low but is expected to increase into the weekend, often a period of volatility and directional moves.
🎯 Targets:
First resistance: $112K–$113K
Main target zone: $115K–$116K
If volume confirms, a push to 116K could complete this short-term recovery cycle.
⚠️ Risk note:
Failure to hold above $108.5K could slow momentum, bringing price back to retest lower trendline support.
💬 Summary:
BTC is positioned for a potential weekend volume push, with a clear channel structure guiding price toward the 116K resistance zone. Momentum is cautiously bullish — watching for confirmation through weekend trading activity.
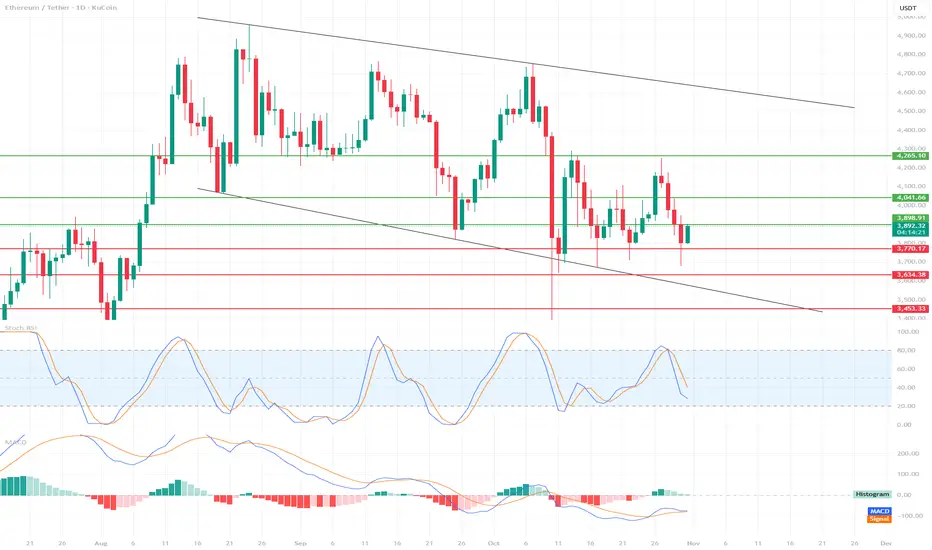
ETH Tests Support – Is This the Beginning of a Rebound?📉 Market Structure
We see a descending channel, bounded by two black trend lines.
Upper Boundary: ~$4,700
Lower Boundary: currently around $3,700, representing strong dynamic support.
The price is currently hovering slightly above the lower edge of the channel, suggesting a possible rebound, but the market remains in a medium-term downtrend.
🔍 Support and Resistance Levels
Support:
$3,770 → currently being tested, crucial in the short term.
$3,643 → next strong support from previous lows.
$3,453 → last line of defense against a steeper decline.
Resistance:
$3,889 → closest resistance, current local ceiling.
$4,041 → strong resistance resulting from prior consolidation.
USD 4.265 → a line that, if broken, could signal a change in the medium-term trend.
📊 Technical Indicators
Stochastic RSI
Located near the oversold zone (below 20), with a slight upward curve.
🔹 Signal: Potential upside move (bounce) in the short term if the %K and %D lines cross upward.
MACD
The MACD line is slightly below zero, but is starting to curve upward and may soon cross the signal line.
🔹 The histogram is starting to decline on the negative side – this is often an early bullish signal (possible change in momentum).
⚖️ Scenarios
🔹 Bullish
If ETH holds above USD 3,770 and the Stoch RSI confirms the rebound, a possible move towards:
3,889 → USD 4,041 → USD 4,265.
A break above USD 4,265 could open the way to USD 4,500+ (upper band of the channel).
🔻 Bearish
Loss of support at USD 3,770 → a signal of weakness.
Then the next downside targets:
USD 3,643, then USD 3,453.
If USD 3,453 breaks, possible tests of the lower band of the channel – even around USD 3,300.
🧭 Summary
Main trend: downward (descending channel).
Short-term bias: neutral-bullish (potential for a rebound from support).
Key level to watch: USD 3,770 – maintaining this level could trigger a rebound, loss = risk of a steeper decline.
Bitcoin Weekend Volume Could Exceed 116K as Smart Money Accumula📊 Market Update
Bitcoin has been building strength since the 106K–107K level, showing signs of a new uptrend. Both the lower time frames and the main trend are currently positive. There’s a strong possibility that BTC will target 112K as the first level, with 116K+ also possible depending on the weekend trading volume.
🔹 Market Structure
The market structure is gradually building, suggesting smart money inflows into BTC over the last 10 hours. We’ll continue tracking this development closely further

ETH >>>>>>> ShortIn the 12-month cyclical pattern of Ethereum, I foresee a downward trend developing during 2026 and 2027.
Based on the recurring structure of Ethereum’s price movements and its historical cycle behavior, I’ve identified three potential levels (or “steps”) of decline that could act as key support zones during this corrective phase.
These three steps represent possible stages where:
The first pullback may begin .. a short-term correction or initial cooldown.
The second step could serve as a consolidation or mid-cycle stabilization area.
The third step may form the major cycle bottom, where market accumulation begins and prepares for the next upward phase.
Overall, this outlook is derived from Ethereum’s repeating annual patterns, historical cycle analysis, and its correlation with broader crypto-market dynamics.
Therefore, I expect a corrective and accumulation phase throughout 2026–2027, potentially setting the stage for Ethereum’s next major rally once the cycle resets.

ETH Outlook after the Dip. What to expect NOW?Finally, the price broke the wedge, and the price experienced a significant drop. I think now is the time for ETH to rise again to 1900 . STRONG SUPPORT 1400 .
Give me some energy !!
✨We spend hours finding potential opportunities and writing useful ideas, we would be happy if you support us.
Best regards CobraVanguard.💚
_ _ _ _ __ _ _ _ _ _ _ _ _ _ _ _ _ _ _ _ _ _ _ _ _ _ _ _ _ _ _ _
✅Thank you, and for more ideas, hit ❤️Like❤️ and 🌟Follow🌟!
⚠️Things can change...
The markets are always changing and even with all these signals, the market changes tend to be strong and fast!!

"ETH - Time to buy again!" (Update)The ETH will increase $2K and reach to the top of the wedge in the coming weeks .
Best regards CobraVanguard.💚

ETH - Ping-Pong Between The Rails!📦Ethereum keeps respecting a neat descending channel on 4H📦: repeated rejections from the upper rail (red arrows) and clean bounces from the lower rail (blue arrows). After the latest tap of the lower boundary, ETH is attempting a rebound within the range.
🏹 As long as the lower rail holds, I’ll look for continuation toward the mid-channel first, then the upper boundary. If momentum accelerates, the structure high near 4,265 becomes the key level to reclaim for a larger push.
⚔️A 4H close back below 3,642 would weaken the setup and open the door for a deeper retest toward 3,300, where the broader defense sits.
In short: trend-following longs from the lower rail, manage partials into the mid-range, and keep eyes on the upper rail for the next decision point.
⚠️ Disclaimer: This is not financial advice. Always do your own research and manage risk properly.
📚All Strategies Are Good; If Managed Properly!
~Richard Nasr

Ethereum 3rd Cycle Inevitable ⚡️
Same structure.
Same rhythm.
Different cycles
Same silence before the storm.
Every CRYPTOCAP:ETH cycle begins the same way, accumulation, disbelief, and then an unstoppable breakout.
The 3rd cycle isn’t a question of if, it’s a matter of when.

BTC Building Momentum — 112K+ Zone ON WAY.Bitcoin has held strong within the recent volume area, showing solid support and renewed buying pressure.
After rebounding from the lower levels near $106K–$108K, BTC is now pushing upward and appears on track toward the first target zone around $112K–$114K.
📈 Market Outlook:
Strong recovery from the volume area confirms short-term buyer control.
Resistance lies between $111.6K and $113.3K, marking the first target zone for this upward move.
Sustained momentum above $109.8K could trigger acceleration toward $114K+ in the next sessions.
📊 Observation:
Volume has started to align with bullish movement — if this continues, BTC could retest upper resistance and possibly extend toward $116K.
However, a pullback below $108.6K would suggest consolidation before another attempt higher.
💬 Summary:
BTC is on its way toward the first target zone above $112K, showing growing strength after reclaiming key volume support. Momentum remains positive as long as price holds above the mid-range.

BTC GOLDEN CYCLE CAN START ANY MOMENT WITH BREAKOUT 112K AFTER..BTC Breakdown Completed — Potential Rebound Toward $112K 🔁
Bitcoin has successfully tested the 106K zone, completing the expected breakdown move.
Price action now shows early signs of stabilization, suggesting that a recovery toward $112K–$113K could follow in the short term.
📊 Market Outlook:
Support was confirmed near $106K, halting further downside pressure.
Short-term resistance sits around $111.6K–$113.5K, the next likely retracement target.
Momentum remains weak but improving — volume shows early buyer re-entry.
📈 Scenario:
If BTC maintains support above $107K, a technical bounce toward the mid-range near $112K becomes likely before facing renewed resistance.
However, failure to sustain current levels could risk a retest of $106K.
💬 Summary:
BTC completed its breakdown to the 106K area and is now forming a possible relief rebound setup targeting $112K–$113K range.
With the same data, we did expect before the breakdown from 115K to 106K zone

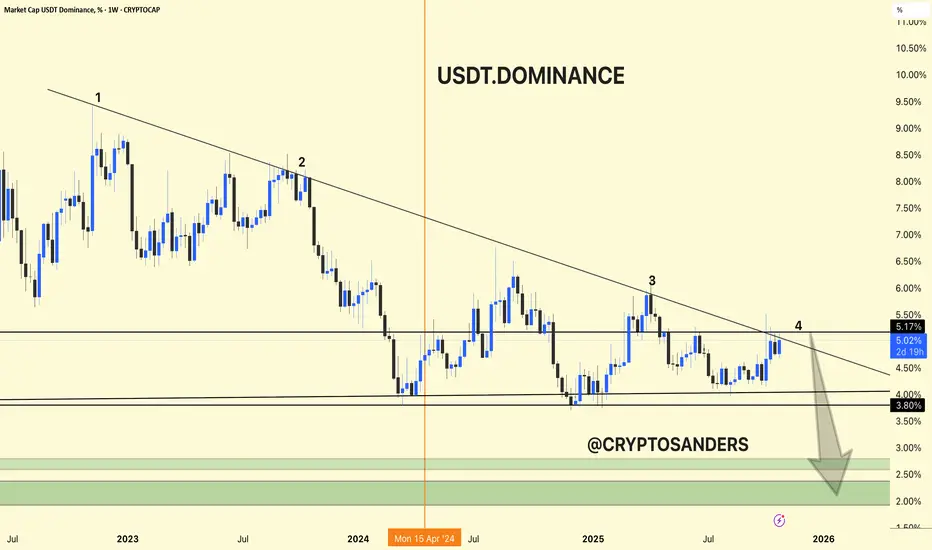
USDT.DOMINANCE CHART ANALIYSIS !!USDT Dominance Chart Update.
USDT dominance is again rejecting at the long-term trendline resistance (point 4), currently around 5.17%.
Structure suggests another potential move lower, with possible targets in the green zone (2.0%–3.0%) if the downtrend continues.
This scenario typically favors fresh capital rotation into Bitcoin and altcoins as traders de-risk from stablecoins.
Summary:
USDT dominance remains weak below the trendline. A sustained drop could spark further altcoin momentum and a broader crypto rally.
Bullish reversal off major support?The Ethereum (ETH/USD) is reacting off the pivot and could bounce to the 1st resistance.
Pivot: 3,710/52
1st Support: 3,395.28
1st Resistance: 4,063.46
Disclaimer:
The above opinions given constitute general market commentary, and do not constitute the opinion or advice of IC Markets or any form of personal or investment advice.
Any opinions, news, research, analyses, prices, other information, or links to third-party sites contained on this website are provided on an "as-is" basis, are intended only to be informative, is not an advice nor a recommendation, nor research, or a record of our trading prices, or an offer of, or solicitation for a transaction in any financial instrument and thus should not be treated as such. The information provided does not involve any specific investment objectives, financial situation and needs of any specific person who may receive it. Please be aware, that past performance is not a reliable indicator of future performance and/or results. Past Performance or Forward-looking scenarios based upon the reasonable beliefs of the third-party provider are not a guarantee of future performance. Actual results may differ materially from those anticipated in forward-looking or past performance statements. IC Markets makes no representation or warranty and assumes no liability as to the accuracy or completeness of the information provided, nor any loss arising from any investment based on a recommendation, forecast or any information supplied by any third-party.

BTC Showing Early Signs of a Possible New UptrendBTC Showing Early Signs of a Possible New Uptrend 🚀
The key is to follow the trend. BTC can return from this point back up 109K
Bitcoin has bounced from the lower range near $107K, holding support after several strong rejections to the downside.
The current structure suggests that momentum could be shifting upward, as the market forms a potential new base for recovery.
There is a good chance that the secure whale trend could use 107K as support for entering on a later time frame to a new cycle
📈 Current outlook:
Support has been confirmed around $107K–$108K, where buyers stepped in with volume.
Short-term resistance remains at $111.6K–$113.3K — a breakout above could confirm a trend reversal.
The price is now trading in the mid-range, building strength for a possible push higher.
📊 Observation:
If BTC manages to reclaim and hold above $113K, the next leg up toward $116K could begin, signaling the start of a new uptrend cycle.
Failure to hold this recovery base would risk another test of the $107K zone.
💬 Summary:
BTC has shown strong recovery signs after defending support — momentum now points toward a possible new uptrend if it sustains above key resistance levels.

Ethereum Game Plan - TDLRKZ MODELEthereum Game Plan - TDLRKZ MODEL
📊 Market Sentiment
On 29/10, the FED lowered rates by 25BPS, as expected. However, Powell’s comments introduced uncertainty regarding another cut in December, stating that further policy moves depend on incoming data.
Interestingly, one FED member dissented, preferring no cut this cycle — a shift from September when all members supported easing.
Following the statement, rate-cut expectations dropped from 95% to 68%, prompting traders to take profits and hedge, creating a short-term bearish sentiment across markets.
Despite this, the mid-to-long term outlook remains bullish, given the broader liquidity cycle and easing policy bias.
📈 Technical Analysis
Ethereum is currently accumulating inside a well-defined range.
Price failed to sustain above the $4950 range high and has started retracing toward the HTF bullish trendline, a potential reaction zone aligning with prior liquidity pools and confluences.
If price holds around this zone, ETH could seek the range high again once momentum returns.
📘 Model in Use – Trendline Deviation with HTF LR into Key Zone (TDLRKZ Model)
This model identifies setups where price deviates from HTF trendlines while interacting with liquidity zones and key structural levels.
The goal is to align HTF context with LTF confirmation for high-probability trend continuation setups.
Model Steps:
1️⃣ Identify the HTF trend direction and only trade in that direction.
2️⃣ Mark the HTF bullish trendline supporting price.
3️⃣ Spot HTF Key Zones likely to act as reaction areas.
4️⃣ Locate nearby liquidity pools or order concentrations.
5️⃣ Wait for confluence: when all align, confirm with a 4H market structure break for entry.
📌 Game Plan
Looking for ETH to retrace into $3350 and reject from that level.
If a 4H break of structure occurs and daily candle closes above $3350, this will trigger a long-biased setup.
🎯 Setup Trigger
→ 4H structure break after tagging $3350
→ Daily close above $3350
📋 Trade Management
→ Entry: After confirmation above $3350
→ Stop Loss: Below swing low that caused 4H break of structure
→ Targets:
TP1: $4150 (EQ)
TP2: $4550
TP3: $4950 (Range high)
→ Move SL to breakeven after TP1 is reached.
💬 Check my Substack for deeper macro and sentimental breakdowns — free subscriptions are open.
⚠️ Disclaimer: This content is for educational purposes only and does not constitute financial advice. Always DYOR before trading.

ETH/USD – Bulls Ready for the Next Leg Up?Ethereum is showing a clean retrace into the rising trendline and POC/ VWAP zone — classic setup for a continuation move.
As long as price holds above $3,950, bulls remain in control with targets at $4,733 and beyond.
Momentum is cooling but structure stays bullish. Is this just the calm before the next breakout? 👀
💬 What’s your plan here — riding the trend or waiting for confirmation?

BTC Loses Structure — Risk of Falling Below $106KBitcoin has officially lost the low-time-frame structure, confirming the end of the previous uptrend zone.
Momentum has shifted to the downside, with sellers gaining control and price now approaching a critical breakdown level.
📉 Current outlook:
BTC remains under $112K, signaling continuation of short-term weakness.
The end uptrend zone around $109K failed to hold support.
Market structure shows potential continuation below $106K if no reversal occurs soon.
📊 Observation:
Buyers have not defended the local range, and repeated rejections near $116K confirm exhaustion of bullish strength.
The next liquidity pool sits below $106K, which could act as the next target zone in this downtrend sequence.
💬 Summary:
BTC has broken its short-term structure — the chart shows clear downside risk with potential move below $106K if pressure continues.

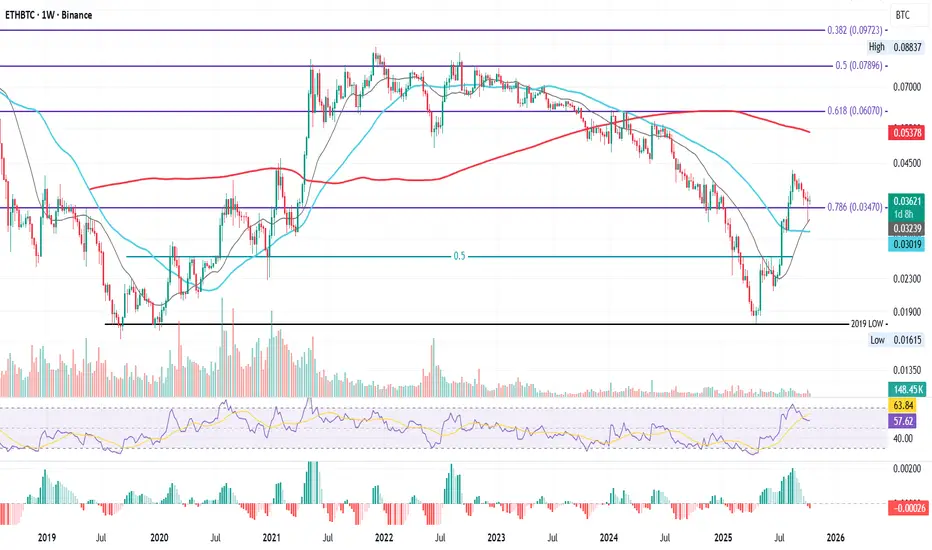
ETHBTC Weekly Series – Tracking the Shift, Week by WeekETHBTC Weekly – Confluence at the 0.786 Fib
This is ETHBTC on the weekly, now retesting one of the most important Fibonacci levels on the chart: the 0.786 Fib at 0.03470.
This time, price isn’t testing it alone. Just below, we have the 21-week MA and 50-week MA, both providing strong confluence. Last week’s flash crash on October 10th already tagged the 21-week MA, showing how reactive this area is for buyers.
This zone could serve as a structural base for a potential bounce toward higher resistance: such as the 200-week MA, or Fibonacci levels around 0.06–0.07. But for any of that to happen, price must hold here first.
That’s why, starting this week, I’ll be tracking this pair closely and updating this idea regularly, to better understand whether ETH can regain strength against BTC, and what that means for the altcoin market as a whole.
Because as history has shown:
when ETHBTC climbs, altcoins breathe again.
Right now, most alts look bruised after the flash crash, but some, especially those with real-world use cases, still hold long-term promise.
The key is timing.
And timing starts with ETHBTC holding this level.
Bias:
Neutral–bullish, strong confluence support, but confirmation needed through weekly close above 0.0347.
Always take profits and manage risk.
Interaction is welcome.
ETHUSDT 4-Hour Chart Analysis !!ETHUSDT 4-Hour Chart Analysis
Trend: ETH has found support at the intersection of a long-term downtrend line and a horizontal demand zone ($3,850–$3,900 area). This area has held steady several times and is acting as a base for the price.
Structure: The price has recently pulled back after rallying to $4,220, but continues to make higher lows on this timeframe, indicating that the bullish structure remains intact as long as $3,900 remains stable.
Key Levels:
Support: $3,850–$3,900 (trend line and horizontal zone)
Resistance: $4,220 (recent swing high), $4,830 (key target—see green arrow projection)
Perspective: If ETH remains stable above $3,900 and bounces back from this support, the next targets will be $4,220 and then $4,830. A breakdown below $3,850 would weaken this bullish outlook.
ETH remains bullish above support, and an upward move towards $3,900 is highly likely. Watch for a break above and sustain above the $4,220 level for further momentum.
DYOR | NFA

ETHUSD H1 | Bearish Momentum Building UpBased on the H1 chart analysis, we can see that the price has rejected off the sell entry at 3,987.68, which is a pullback resistance that aligns with the 38,2% Fibonacci retracement and could drop from this levle to the downside.
Stop loss is at 4,144.26, whichis a pullback resistance that is slightly below the 78.6% Fibonacci retracement.
Take profit is at 3,744.29, whichis a swing low support.
Stratos Markets Limited (tradu.com ):
CFDs are complex instruments and come with a high risk of losing money rapidly due to leverage. 68% of retail investor accounts lose money when trading CFDs with this provider. You should consider whether you understand how CFDs work and whether you can afford to take the high risk of losing your money.
Stratos Europe Ltd (tradu.com ):
CFDs are complex instruments and come with a high risk of losing money rapidly due to leverage. 70% of retail investor accounts lose money when trading CFDs with this provider. You should consider whether you understand how CFDs work and whether you can afford to take the high risk of losing your money.
