BTC Still in Breakdown ZoneBTC Still in Breakdown Zone ⚠️
Bitcoin remains inside the breakdown structure, consolidating under pressure after failing to reclaim the upper range near $116K.
The current setup continues to show bearish volume behavior, suggesting that the market is still in a controlled downtrend phase.
📉 Current outlook:
Breakdown zone spans $116K – $110K.
Price continues to trade mid-range around $113K, with limited bullish momentum.
The breakdown volume indicates ongoing distribution — sellers remain active.
📊 Observation:
BTC is holding slightly above $112.5K, but without strong buying confirmation.
If this consolidation breaks lower, the next liquidity target sits around $110K, marking the bottom of the breakdown zone.
💬 Summary:
BTC is still in the breakdown phase, with selling pressure dominating short-term structure.
Until price reclaims $116K with volume, risk remains tilted toward the $110K region.
ETH

ETH Short Setup🚨 ETH Short Setup
Ethereum just confirmed a Break of Structure (BOS) after failing to hold above both EMAs. This rejection — together with a liquidity sweep near 4230 — signals potential continuation to the downside.
🎯 Trade Plan Overview:
Entry: 4020–4050
Stop: 4100–4120
Targets: 3960 → 3840
Risk/Reward: 1:3
📊 Key zones:
EMA short attention zone ✅
Support: 3920–3960 equilibrium
Watch for bullish divergence before reversal
🔔 Subscribe for daily ETH and BTC market updates, crypto trading strategies, and AI-powered technical analysis!

We will witness a powerful bullish rally !!After breaking out of the bullish wedge, the price has entered a phase of accumulation. This is a very strong signal on the weekly timeframe and could quickly lead to a price surge. I believe that after Christmas, we will witness a powerful bullish rally.

Bearish drop off?The Ethereum (ETH/USD) has rejected off the pivot whic has been identified as an overlap resistance and could drop to the 1st support.
Pivot: 4,262.14
1st support: 3,693.05
1st Resistance: 4,440.49
Disclaimer:
The above opinions given constitute general market commentary, and do not constitute the opinion or advice of IC Markets or any form of personal or investment advice.
Any opinions, news, research, analyses, prices, other information, or links to third-party sites contained on this website are provided on an "as-is" basis, are intended only to be informative, is not an advice nor a recommendation, nor research, or a record of our trading prices, or an offer of, or solicitation for a transaction in any financial instrument and thus should not be treated as such. The information provided does not involve any specific investment objectives, financial situation and needs of any specific person who may receive it. Please be aware, that past performance is not a reliable indicator of future performance and/or results. Past Performance or Forward-looking scenarios based upon the reasonable beliefs of the third-party provider are not a guarantee of future performance. Actual results may differ materially from those anticipated in forward-looking or past performance statements. IC Markets makes no representation or warranty and assumes no liability as to the accuracy or completeness of the information provided, nor any loss arising from any investment based on a recommendation, forecast or any information supplied by any third-party.

BTC Enters Breakdown Area — Volume Could Push Back Below $110KBTC Enters Breakdown Area — Volume Could Push Back Below $110K ⚠️
The previous volume that took BTC before 101K has some trends of this volume, which has a manipulation views, the volume before that did took BTC below 101K ended with a fakeout.
Bitcoin has entered the breakdown area, showing early weakness as price struggles to hold momentum near $115K.
The recent volume spike looks more like distribution pressure than accumulation, signaling that a correction phase could be forming.
📉 Current outlook:
Breakdown zone between $116.3K – $109.7K is active.
Volume is rising, but without strong upward continuation — a sign of selling absorption.
If this pattern holds, BTC could retest the $110K zone or drop slightly below in the next move.
📊 Observation:
The market is testing the upper side of the breakdown range but lacks follow-through.
A close back under $114K would confirm weakness and invite further downside momentum.
💬 Summary:
BTC is inside its breakdown area, and current volume suggests pressure may build to drive price back below $110K if buyers fail to reclaim control soon.

Bitcoin lost its low time frame — red day pressure aheadBitcoin has lost the low time frame structure around the $114.6K – $114.8K zone, signaling a possible shift in short-term momentum.
The break below this area indicates weakness, and BTC is now testing the mid-range levels while showing signs of slowing volume.
📉 Short-term view:
Momentum has turned bearish after rejection from $115.8K.
Next support zone sits around $108K – $109K, where buyers may try to step in.
If this level fails to hold, BTC could revisit $103K support — the key demand area from the previous range.
📊 Technical observation:
BTC’s structure shows a completed short-term top followed by a lower high formation.
This setup often confirms a local downtrend and can lead to several red candles before a new base forms.
💬 Summary:
Bitcoin lost its low time frame momentum, and we could be entering a red session.
We’ll monitor how price reacts near the $108K support zone to evaluate if buyers can regain control or if a deeper correction begins.
We follow the data, at this moment the marketview seems to be red, we will follow if this continues in the coming hours.

DIA enters breakdown trendDIA has officially entered a breakdown phase after losing its key short-term structure and falling back into the breakdown volume zone.
The sharp rejection from the $0.86 level triggered heavy selling pressure, confirming a shift in short-term trend momentum.
📉 Current outlook:
Price is now consolidating between $0.60 – $0.38 within the breakdown range.
Volume is elevated, suggesting distribution rather than accumulation.
Unless DIA reclaims $0.65+, the trend remains bearish.
📊 Observation:
This move resembles a post-hype correction where early buyers exit and liquidity thins out.
The next key level to monitor for reaction sits near $0.38 support — a potential short-term base if selling slows down.
💬 Summary:
DIA is currently trading in a breakdown trend, with risk leaning to the downside until structure rebuilds above $0.65.

ETH Daily Technical Overview — Cycle & Box AnalysisCycle Structure:
HWC (Higher Wave Cycle – Long-Term): Bullish 🔼
MWC (Middle Wave Cycle – Mid-Term): Range 🔁
LWC (Lower Wave Cycle – Short-Term): Bearish 🔽
Market Context:
The first step is to assess the market from a cycle and wave perspective 🧐. Recent sharp down moves are ignored as they are emotional reactions.
The current support is a box 📦 that has been tested for around 35 days with four significant touches. My bias is long here 🚀.
Long Setup:
Weakness in the short-term MWC 🔁 could trigger a bullish move if 4232 resistance is broken and confirmed ✅.
The next resistance at 4757 🚧 could turn all cycles bullish 🔼🔼🔼 if broken, offering strong upside potential 📈.
Short Consideration:
The market is unpredictable ⚠️, so short scenarios should be considered too.
Until price reaches 3708 ⬇️, I won’t consider shorts ❌.
Shorts require more structure and confirmation.
Remember, downside moves are still possible ⚡, so risk management is key 🛡️.
📌 Signature:
If you want a specific coin analyzed, drop a comment 💬👇 and I’ll cover it.
⚠️ Without proper risk management, you're just a ticking time bomb 💣

Ethereum (ETH/USDT): Possible Short OpportunityHi guys!
ETH is currently testing the ascending trendline support after forming a potential lower high near the $4,165 zone. The structure shows early signs of weakness as buyers failed to maintain momentum above the last swing top.
A clean break below the trendline could confirm a short-term bearish shift, targeting the $4,030–$4,000 support zone, which aligns with the previous breakout level. The invalidation of this setup would occur if the price breaks and holds above $4,165, signaling renewed bullish momentum.
important levels:
Resistance: $4,165
Support: $4,030 – $4,000
Bias: Bearish below $4,165

ETH Analysis (4H)After the heavy dump on altcoins, the market is still quite volatile. However, after several days and weeks of ranging, it’s gradually returning to normal and becoming more predictable for analysis.
Ethereum has formed a reversal pattern at the bottom and has made three higher lows. It’s expected to move toward the red zone while holding the green area, and then get rejected toward lower levels.
The best area for a long buy is the green box, and the best area for a short sell is the red box.
Let’s wait and see what happens next.
For risk management, please don't forget stop loss and capital management
When we reach the first target, save some profit and then change the stop to entry
Comment if you have any questions
Thank You

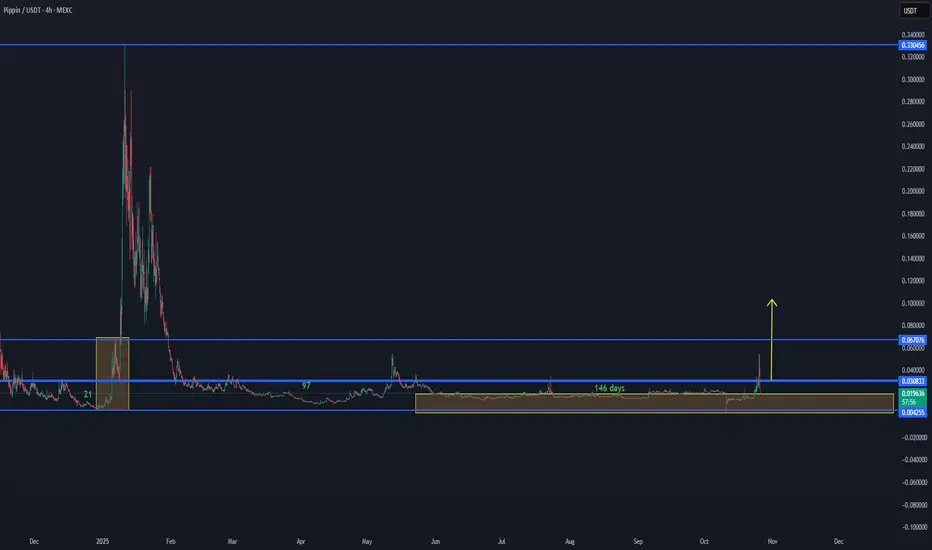
PIPPIN:USDT Market Outlook – Volume Range Formation💠 PIPPIN:USDT Market Outlook – Volume Range Formation
PIPPIN:USDT is showing early signs of new volume activation after an extended 146-day accumulation period within the lower range between 0.0042 – 0.0308 USDT.
This current setup indicates a potential volume range development, similar to the previous expansion phase observed earlier in the chart.
If momentum continues to build and volume sustains, the next major resistance zone sits around 0.067 USDT, followed by a broader target area toward 0.33 USDT on higher timeframes.
At this stage, stability above 0.018–0.020 USDT would confirm the base structure and strengthen the bullish outlook.
📊 Summary:
Range support: 0.0042 – 0.018 USDT
Key activation zone: 0.018–0.030 USDT
Target zones: 0.067 → 0.33 USDT
Structure: Accumulation → Early volume build-up
🔎 Focus: Watching for continuation of volume inflow and break above 0.0308 USDT to confirm next phase expansion.
ETHEREUM BULL-RUNI believe Ethereum is doing what bitcoin did in 2020-21 and 300% rise to about 14k in 2 months is pretty normal in cryptos

Potential bearish drop off?Ethereum (ETH/USD) has rejected off the pivot, which is an overlap resistance and could drop to the 1st support.
Pivot: 4,263.96
1st Support: 3,938.73
1st Resistance: 4,455.38
Disclaimer:
The above opinions given constitute general market commentary, and do not constitute the opinion or advice of IC Markets or any form of personal or investment advice.
Any opinions, news, research, analyses, prices, other information, or links to third-party sites contained on this website are provided on an "as-is" basis, are intended only to be informative, is not an advice nor a recommendation, nor research, or a record of our trading prices, or an offer of, or solicitation for a transaction in any financial instrument and thus should not be treated as such. The information provided does not involve any specific investment objectives, financial situation and needs of any specific person who may receive it. Please be aware, that past performance is not a reliable indicator of future performance and/or results. Past Performance or Forward-looking scenarios based upon the reasonable beliefs of the third-party provider are not a guarantee of future performance. Actual results may differ materially from those anticipated in forward-looking or past performance statements. IC Markets makes no representation or warranty and assumes no liability as to the accuracy or completeness of the information provided, nor any loss arising from any investment based on a recommendation, forecast or any information supplied by any third-party.

Red Alert !... ETH got rejected at the topHi guys,
If you zoom out of ETH you'll notice that its moving sideways on the Weekly/Monthly chart
Which can be bullish or bearish at the same time BUT recently we've seen the price gets rejected at the top of the sideways channel on three different monthly candles which is a red alert in my book.
Now I'm not saying that its going down a 100% but not breaking out of the channel is a very bad sign and could mean the signal for a major drop to the lows of the channel.
Not to mention the 4 years cycle of bitcoin is due and all realistic traders are expecting Bitcoin to drop to the previous all time high at 69000$ and if that happens all alt coins will go down too.
Crypto twitter is insanely bullish (very bad sign) and almost all big markets including US stock market and Gold are at all time high and extreamly over valued so don't listen to the greedy social media or the news and listen to reason and common sense here.
Risk management is advised so stay safe out there and let me know what do you guys think my this.

Examples of Chart Interpretation Methods
Hello, fellow traders!
Follow us to get the latest information quickly.
Have a great day!
-------------------------------------
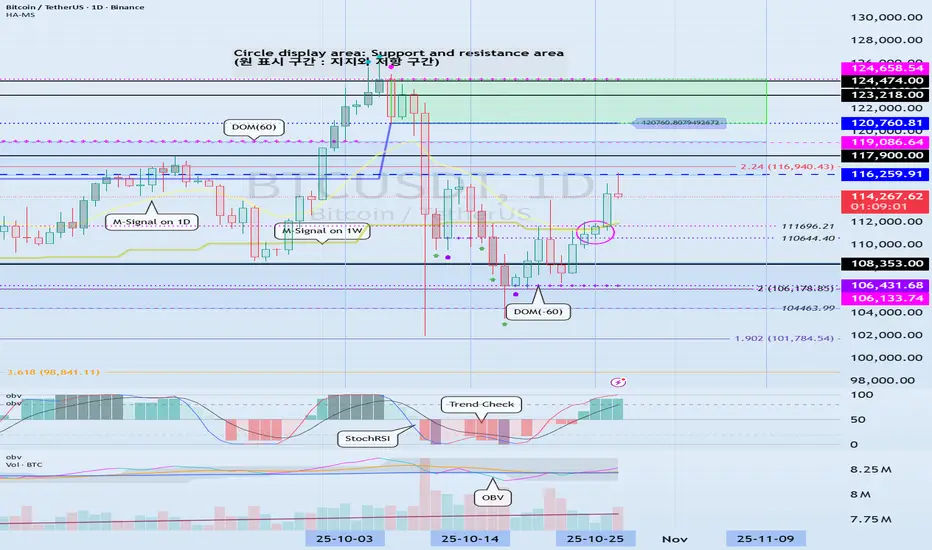
#BTCUSDT
To break above a key point or range and continue the uptrend,
1. The StochRSI indicator must be trending upward. Ideally, it should not enter the overbought zone. 2. The On-By-Signal (OBV) indicator must show an upward trend. If possible, it should remain above the High Line.
3. The TC (Trend Check) indicator must show an upward trend. If possible, it should remain above the 0 level.
Currently, only the TC indicator satisfies the above conditions.
Therefore, if the price remains above the 110644.40-111696.21 range and the above conditions are met, we should see if the price rises above 116259.91 and remains there.
If the On-By-Signal (OBV) indicator remains above EMA 1 and EMA 2 and rises above the High Line, further upside is likely.
However, if the K indicator of the StochRSI indicator enters the overbought zone and the slope changes, the upside may be limited.
When the TC (Trend Check) indicator touches its highest point, there's a high probability of forming a new high, so you should consider a response plan.
Summary of the above:
Support Zone: 110644.40-111696.21
Resistance Zone: 116259.91-119086.64 (up to 124658.54)
------------------------------------
#ETHUSDT
As mentioned in the BTC chart description, ETH is also showing similar movements.
However, the OBV indicator is just about to break above EMA 1 and EMA 2, so if it finds support near 4109.80, there's a possibility of further upside.
-------------------------------------
#ZECUSDT
Based on the BTC chart description, ZEC is likely to continue its upward trend.
The chart is broken due to the sudden surge, making it difficult to determine the duration of volatility.
--------------------------------------------
#XRPUSDT
The key is whether the price can find support at key support and resistance levels and rise above 2.9092.
------------------------------------------
Ultimately, trading will be based on the support and resistance levels drawn on the 1M, 1W, and 1D charts.
However, it is recommended to use auxiliary indicators to confirm whether to initiate a trade.
The basic trading strategy is to buy in the DOM(-60) ~ HA-Low range and sell in the HA-High ~ DOM(60) range.
However, if the price rises in the HA-High ~ DOM(60) range, a step-up trend is likely, while if the price falls in the DOM(-60) ~ HA-Low range, a step-down trend is likely.
Therefore, a fractional trading strategy is recommended.
In this context, the coin (token) currently closest to buying is XRP.
-
Thank you for reading to the end.
I wish you successful trading.
--------------------------------------------------
ETHEREUM climbing up slow and steadyETH is slowly breaking above resistance levels. However, the hard work is not over. As ETH tries to reclaim its range, it's important that the bull maintain momentum. Volume is a factor in with current price action. Without volume back PA, it will be difficult to sustain the bullish move.

Second Leg Incoming? Ethereum Needs Volume.👋🏻 Hey everyone! Hope you’re doing great! Welcome to SatoshiFrame channel.
✨ Today we’re diving into the 4-Hour Ethereum analysis. Stay tuned and follow along.
👀 Looking at Ethereum on the 4-hour timeframe, we can see that just like Bitcoin, Ethereum began a strong bullish leg yesterday, breaking several of its multi-timeframe resistances. With this price jump, it has now reached its resistance area at $4,252. Keep in mind that the market may take a short rest at this level, and price may experience a brief pullback to the downside.
🧮 The RSI oscillator is currently exiting the OverBuy zone, which is a sign that a multi-timeframe correction may begin for Ethereum.
🕯 During this bullish leg, Ethereum’s volume has increased slightly. However, since sell orders have been lower than before, this volume increase does not appear very strong on the 4-hour chart. Therefore, if Ethereum intends to form its second bullish leg upward, we will likely need to see a more noticeable increase in buying volume.
✍️ The scenario ahead for Ethereum, like Bitcoin, is independent of any trade or position, and it simply helps us better understand Ethereum’s corrective price behavior.
🛡 Ethereum, similar to Bitcoin, is entering a price resting phase. This rest can extend down toward support levels, and if a stronger bullish continuation wants to form, we may see a reversal reaction near these zones. If such a move occurs, the analysis and scenarios will be updated for you.
❤️ Disclaimer : This analysis is purely based on my personal opinion and I only trade if the stated triggers are activated .

BITCOIN – THE LAST DANCE AT THE BORDER OF DEATHTraders,
I believe Bitcoin is potentially setting up for a swing fail pattern around 117.500.
A swing fail pattern, very simply, is when price runs the previous high, takes out the liquidity sitting above it, and then fails to hold above that level. In other words, it clears the stops, shows strength for a moment, and then turns. It is the market taking a breath before it bites.
Here is how I see it and why I am positioned for shorts, not longs.
1. Structure into 117.500
The zone around 117.000 to 117.500 is, for me, the kill zone.
Why?
There is a clean previous high that has not been taken yet
There is visible imbalance from the last fast drop sitting in that band
We have London morning wick liquidity above us that I believe price still wants to clean
The math and harmonics I am running line up in the same area
When I say the math lines up I am talking about measured extensions and harmonics off the leg that started around 103k to 104k and impulsed higher. My 1.618 extension clusters around 116.7 to 117.5. The 1.272 and 1.414 levels already got respected on the way up. This last one is usually where you get the overextension and the last grab. On top of this, the 1.618 extension confluences with the HTF Golden Pocket.
We also sit right on top of what I call the border of death. Above 117.500 I do not want to see Bitcoin hold. If it does hold and build acceptance up there then this entire idea is invalidated and I will adapt. I am not married to bias. I am married to data.
2. Order flow and participation
Let us talk about what is behind this move, not just what it looks like.
Spot CVD is still depressed compared to the beginning of the run. That means real buyers paying cash are not the ones driving price higher. This is not a classic spot accumulation bid. This is not strong hands owning the level.
Stablecoin margined CVD and coin margined CVD both curled up into the most recent leg. So who is lifting price It is perps. Not investors, not patient buyers, just leverage.
Open Interest is also telling us a story.
Stablecoin margined OI is grinding back up into the highs.
Coin margined OI is starting to climb again.
That means people are adding new exposure on the way up. They are not just covering shorts anymore, they are now chasing longs into the high. This is where positioning gets fragile. The crowd thinks we are going to keep going. I start thinking about harvesting that belief.
The floor under us is not built by conviction. It is built by leverage.
We have seen this before. The desert looks quiet before the sandstorm picks up.
3. What I am expecting
I am expecting a sweep of the high into roughly 117.500.
Clean the liquidity. Fill the imbalance. Tap the last little pocket of inefficiency that is still sitting there. Show strength on the surface.
Then reject.
That rejection is the tell for me. If we push above the high and then snap back below it on force, that confirms the swing fail for me.
From there I am looking for rotation much lower.
4. The target zone if this plays out
If this plays out the way I think it can, I am looking toward 98k.
This is not a random number. That is basically the next meaningful pocket of imbalance below. That is the next unfair area that never got re tested. Price likes to rebalance. The market eventually revisits the places it skipped when it was moving too fast. We call it inefficiency but it is really just unfinished business.
Will it instantly teleport there No. This is a path idea, not a straight line prediction. But 98k is where I think equilibrium lives if this whole run unwinds.
5. Risk management and positioning
Because of this view I have adjusted.
My earlier thesis from October 16 is, in my eyes, no longer valid in its original form. Never say never, but I am not trading that idea anymore.
I have closed all long positions. I am no longer here to squeeze the upside. I am here to stalk shorts.
Does that mean I am instantly full size short here No.
I am not interested in guessing tops. I am interested in letting the market reach for the level I want, and only then taking the trade with data behind it.
If Bitcoin breaks through 117.500 and starts holding acceptance above that level, I will back off this idea. No ego. No stubbornness. I am here to survive. Survival is the only way you ever get to mastery.
6. Summary
I believe Bitcoin is setting up for a classic swing fail pattern at around 117.500. I think price will hunt that liquidity, stop out shorts, convince late longs they are right, and then turn. I think the next meaningful re balance sits much lower, around 98k.
This is not guaranteed. Nothing in trading is guaranteed. Trading is probability, not fantasy.
But right now the flow, the harmonics, the imbalance, the extensions, and the psychology of the crowd all rhyme in the same place.
And when the market whispers in the same tone across different tools, I listen. I am ThetaNomad.

ETH/USDTETH is currently trading within a consolidation range.
The direction of the next move — and the formation of a potential trading strategy — will depend on which side of the range gets taken out first and how the breakout occurs.

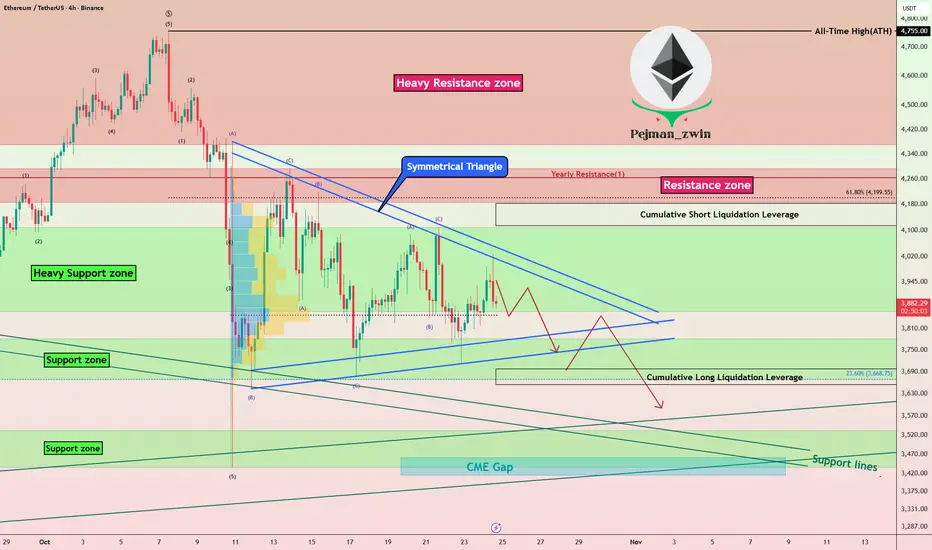
Ethereum in Symmetrical Triangle – Next Big Move Coming?Let’s take a look at Ethereum ( BINANCE:ETHUSDT ) on the 4-hour timeframe . Recently, Ethereum dropped by over -20% during the latest crypto market sell-off but has since started to recover. Right now, it appears to be in a corrective pattern, moving inside a Symmetrical Triangle Pattern .
Currently, Ethereum is testing a Heavy Support zone($4,107-$3,860) , and a break below that zone, confirmed by breaking the lower lines of the symmetrical triangle , could signal further downside.
Note: In general, a Symmetrical Triangle is a continuation pattern, and since the prior trend was downward, we might expect more downside if the broader crypto market continues to decline.
Before concluding, let’s also glance at the ETHBTC ( BINANCE:ETHBTC ) pair on the daily timeframe . It looks like ETHBTC has been in a downtrend and might revisit its support zone once more. That suggests if Bitcoin declines, Ethereum could see even more pressure .
In conclusion, I expect Ethereum to drop at least to its Support lines and Support zone($3,532-$3,436) after breaking the lower lines of the symmetrical triangle. There's also a CME Gap($3,461-$3,417) that might get filled.
Note: Keep in mind that weekend trading volumes are often lower, so the breakdown might not happen immediately. However, if tensions between the US and Venezuela escalate, we could see a sharper reaction even over the weekend.
First Target: $3,764
Second Target: $3,597
Stop Loss(SL): $4,044
Cumulative Short Liquidation Leverage: $4,182-$4,114
Cumulative Long Liquidation Leverage: $3,697-$3,3654
Please respect each other's ideas and express them politely if you agree or disagree.
Ethereum Analyze (ETHUSDT), 4-hour time frame.
Be sure to follow the updated ideas.
Do not forget to put a Stop loss for your positions (For every position you want to open).
Please follow your strategy and updates; this is just my Idea, and I will gladly see your ideas in this post.
Please do not forget the ✅' like '✅ button 🙏😊 & Share it with your friends; thanks, and Trade safe.
JELLY/USDT — Building Momentum Inside Volume BoxJELLY is stabilizing within the $0.075 – $0.12 volume box, signaling a potential accumulation zone before expansion.
A clean breakout and hold above $0.12 could confirm strength and open targets toward $0.16+ in the short term.
📊 Volume Zone: $0.075 – $0.12
📈 Breakout Target: $0.16

ETH back above resistanceCRYPTOCAP:ETH megaphone channel is being respected as we approach the upper boundary after overcoming resistance High Volume Node now support.
The daily pivot will also proof tough to overcome and there should be no clean breakout to all time high as we climb the wall of worry from all of the cycle top nonsense... FEAR
Price tested the daily 200EMA as support, normal behaviour and printed bullish divergence from oversold W to Y.
Safe trading

ETH Sell/Short Setup (4H)After a strong bearish move, the price has made a solid recovery and is approaching a good supply zone.
At this level, it’s better to look for sell/short positions, as there are strong order blocks in this area that could push the price downward.
We’ve considered a 1:2 risk-to-reward ratio, and you can see the targets and stop-loss levels on the chart.
For risk management, please don't forget stop loss and capital management
When we reach the first target, save some profit and then change the stop to entry
Comment if you have any questions
Thank You
