BTC/USDT — Pre-Cycle Range Breakout📊 Market Update
Bitcoin entering up on the low time frame with strong volume — we are now in an area where BTC is building a new uptrend cycle with the last trend view.
Remember, BTC can always change trend unexpected, and when that data comes, we will share it fast. For now BTC still holding positive around the support at 108K.
🔹 Market Structure
Last 4 days+ BTC been building uptrend, and as long this stays consistent we can speak about positive trend.
Important zone is 117K, we will see if BTC can reach there soon.
We continue daily updates as always — everything is possible in the market.
ETH

ETH Buy/Long Setup (1H)Considering the ranging movement and lower time frame confirmations, it seems that with the specified stop, Ethereum can yield profit based on the given setup.
The entry zone, targets, and stop are marked on the chart.
For risk management, please don't forget stop loss and capital management
When we reach the first target, save some profit and then change the stop to entry
Comment if you have any questions
Thank You

The key is whether it can rise above 4403.87
Hello, traders.
Follow us to get the latest information quickly.
Have a great day.
-------------------------------------
(ETHUSDT 1W chart)
The formation of an upward trend line (A) created an upward channel from (A) to (B).
Therefore, the key is whether it can continue to rise along this upward trend line.
If the upward movement fails, we need to check whether the price rises along the rising trend lines (1) and (2).
Therefore, the 3900.73-4107.80 range is a crucial area for sustaining the upward trend.
In this context, we expect a significant period of volatility to begin around the week of November 24th.
This period of volatility could continue until around the week of January 12th, 2026.
-
(1M Chart)
If this month closes with a bearish candle, forming an upward trend line (a), the key question is whether the price can rise along trend line (a).
If not, there's a possibility of touching the upward trend line (2), so we need to consider a response plan.
-
(1D Chart)
The key is whether the price can sustain above the uptrend line (1) and rise above 4403.87.
To do this, we need to see if it can break above the downward channel created on the 1D chart.
Therefore, we need to observe how the price moves after the volatility period around November 5th.
The HA-High ~ DOM(60) section (4393.04-4780.15) on the 1W chart overlaps with the HA-High ~ DOM(60) section (4403.87-4749.30) on the 1D chart, so it's likely to act as resistance.
------------------------------------
The basic trading strategy is to buy in the DOM(-60) ~ HA-Low section and sell in the HA-High ~ DOM(60) section.
However, if the price rises from the HA-High to DOM(60) range, a step-like uptrend is likely, while if it falls from the DOM(-60) to HA-Low range, a step-like downtrend is likely.
Therefore, a split trading strategy is recommended.
To maintain a step-like uptrend in the DOM(-60) to HA-Low range,
1. The StochRSI indicator must be rising. If possible, it should not enter the overbought zone.
2. The On-By-Value (OBV) indicator must be rising. If possible, it should remain above the High Line.
3. The TC (Trend Check) indicator must be rising. If possible, it should remain above the 0 level.
If the above conditions are met, the uptrend is likely to continue.
If not, a high point is likely to form, so you should consider a countermeasure.
-
Thank you for reading to the end.
I wish you successful trading.
--------------------------------------------------

BTC Market Update – New Volume Activation - $114K📈 BTC Market Update – New Volume Activation
BTC continues to show strong momentum within the current structure.
Price action remains bullish, with no clear signs of breakdown at this stage.
From the current zone (~111.4K–111.7K), there’s visible new volume activation, suggesting renewed interest and potential continuation toward the $114K target zone.
As long as BTC holds above the support range, the main trend remains intact.
If a structural change occurs, it will be highlighted in the next update.
Focus: Continuation toward $114K while maintaining volume support.

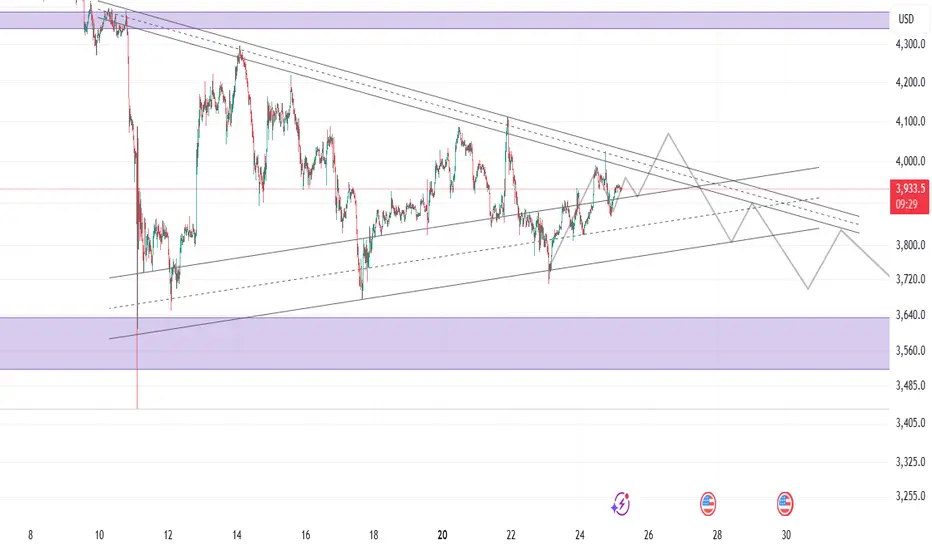
Ethereum's decision timeMy stance of course is I am embarrassed, but we have two scenarios here to play out in my opinion and it's quite clear what I have drawn here. I believe lower this week but only time will tell

ETHUSD - Bullish Curve UpFollowing the trend line in green, should breakout and touch the white dotted line again
Very bullish on Ethereum right now and altcoins in general
Daily chart

PIPPIN/USDT — Dip Buying Zone Formed After BreakdownPIPPIN/USDT — Dip Buying Zone Formed After Breakdown 💎
After the recent breakdown, PIPPIN has entered its volume zone, which often acts as a re-accumulation area before a potential rebound.
If the price can stabilize and build strength here, this level could represent a dip-buying opportunity with the possibility of a return toward previous highs.
📊 Key Range: $0.015 – $0.024
💡 Focus: Watching for a volume confirmation or strong reversal candle to signal a bounce

ETHUSDETH is forming a bullish flag pattern on top of a resistance level. We still have everything in place for a big upward movement. November tends to be a period of accumulation, leading to an upward movement in December. In other words, BTC tends to rise. BTC is currently accumulating in the range of 106,500k to 122,500k.

Ethereum VS. Russell 2000 Russell 2000 index and Ethereum charts follow a strikingly similar pattern.
Both assets peaked in November 2021 and then entered a prolonged correction. Interestingly, both formed major lows around April 2025.
The Russell 2000, just before breaking through the 2021 ATH resistance area, retested the demand zone, just as CRYPTOCAP:ETH is currently doing.
This similarity suggests that Ethereum could be poised for a strong breakout, following in the footsteps of the Russell 2000.
History is sometimes more than just a coincidence…

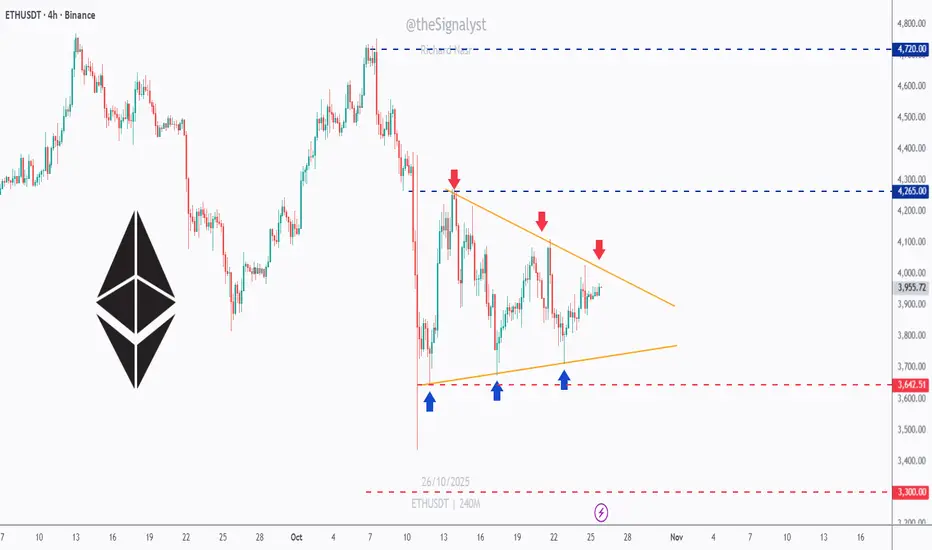
ETH - The Symmetrical Triangle of the Month!Ethereum has spent most of October coiling inside what can only be called the symmetrical triangle of the month => a textbook compression of volatility where both bulls and bears are building pressure for the next decisive move.
📦Price is trapped between the $4,265 resistance and $3,640 support, with multiple clear reactions from both boundaries. Each time ETH bounces off the lower orange trendline, buyers step in aggressively… but every push higher has been capped by lower highs, a perfect battle of strength versus patience.
The breakout from this formation will likely dictate ETH’s next major swing.
- A break above $4,265 could ignite a rally toward $4,720 and beyond.
- A break below $3,640, however, would expose $3,300, a strong historical demand zone.
⚔️ Until one side wins , it’s all about staying patient, waiting for confirmation, and letting the structure do the talking. The tighter this triangle gets — the bigger the breakout tends to be.
⚠️ Disclaimer: This is not financial advice. Always do your own research and manage risk properly.
📚All Strategies Are Good; If Managed Properly!
~Richard Nasr
BRIEFING Week #43 : The Value Trade
Here's your weekly update ! Brought to you each weekend with years of track-record history..
Don't forget to hit the like/follow button if you feel like this post deserves it ;)
That's the best way to support me and help pushing this content to other users.
Kindly,
Phil

Etherium to 7500Right now BINANCE:ETHUSDT is just barely holding above 3500 area which is a good sign and showing it's potential to break ATH. But remember 3500 is not that major support, so it may break this support area and look for major support zone which is around 2100-2600 area. That would be a perfect opportunity enter long position on BINANCE:ETHUSDT , or maybe buy on spot. It can also fakeout 3500 area and go up. And also there is a obvious triangle pattern appeared in 1W timeframe which is a very good sign to go up in my opinion. Our first target will be 7500 and then 10k, 12k, 15k. So time will tell.

$ETH in the calm before the storm.In the HTF view, Ethereum maintained its structural strength with rising lows, broke the major supply zone and is currently progressing in the retest process.
It is quietly accumulating strength and preparing for a new move between the 2021 ATH resistance and the area that used to be the supply zone and now serves as support as the demand zone.
Bear market rhetoric may be prevalent, but structural data suggests Ethereum is preparing for a major rally.

BTC/USDT — Holding Strength Above Low Time Frame, Eyeing 114K BTC/USDT — Holding Strength Above Low Time Frame, Eyeing 114K Zone 🚀
Bitcoin continues to show positive structure, trading above the low time frame support and aligning with the broader uptrend momentum.
The recent stabilization and gradual rise in volume indicate that buyers are maintaining control, keeping BTC in a constructive phase toward the $114,000 target zone.
As long as Bitcoin sustains above $109,700–$110,000, the trend remains bullish, with higher-timeframe confirmation aligning in favor of continuation.
📊 Technical Overview:
Support Zone: $109,700 – $110,000
Resistance Target: $114,000
Trend: Positive continuation above low TF
Bias: Bullish
Momentum and volume remain healthy — suggesting BTC could attempt another push into the 114K region if current structure holds.
📈 Outlook: Uptrend continuation
🎯 Target: $114,000+

PIPPIN/USDT — Early Signs of a New Hype Cycle?Looking at the data and historical structure, PIPPIN is showing similar early movement patterns that preceded its last explosive rally.
The current trend shows renewed volume inflow, a base breakout, and a potential start of a new accumulation-to-expansion phase.
If this pattern continues, the structure suggests that a new hype wave could be forming — just like the previous major move that sent it skyrocketing.
📊 Key Observations:
Historical accumulation followed by vertical expansion
Volume returning at local bottom
Early breakout momentum forming
Could this be the start of another hype run?
What do you think — is PIPPIN entering its next cycle? 🔥

Ethereum weakened or holding structure? | ETH 1H Analysis👋🏻 Hey everyone! Hope you’re doing great! Welcome to SatoshiFrame channel.
✨ Today we’re diving into the 1-Hour Ethereum analysis. Stay tuned and follow along.
👀 We observe Ethereum on the 1-hour timeframe. After breaking and stabilizing at the $3,889 zone, Ethereum formed a higher low on this area and is now moving along a trendline (dynamic support), with an important static resistance at $3,982.50. Price has reacted to this level once but has not succeeded in breaking it!!!
🧮 Using the RSI oscillator is a reasonable approach in this situation. Since Ethereum is currently in a box/trading range, a breakout requires entering overbuy territory and surpassing the 70 level. Note that there is a significant oscillation support below the average, at the 44.5 zone, which holds strong validity and represents our swing low.
🐷 Pay attention to Ethereum’s volume. To break the specified zone, Ethereum needs to show a strong reaction, fill sell orders, and liquidate futures contracts. Therefore, we need buyer market makers to support the breakout, causing volume to increase through a price jump.
✍️ The scenario forming for Ethereum may require some patience and could play out differently, because we are now facing the second touch of this level, so the win rate of this scenario may be slightly lower.
🟢 Long Position Scenario
Breaking Ethereum’s resistance at $3,982.50 along with surpassing the 70 RSI level and seeing a significant increase in buying volume and price squeeze can form a good long position scenario on Ethereum.
❤️ Disclaimer : This analysis is purely based on my personal opinion and I only trade if the stated triggers are activated .

Ethereum Short-Term Breakdown Imminent | ETHUSD Short Setup🚨 Ethereum (ETHUSD) Market Update – Short-Term Setup 🚨
Ethereum is displaying clear weakness on higher levels, as the recent bounce appears to be a relief move rather than a full trend reversal. The resistance zone between $4074 – $4175 remains crucial — price rejection from this area can offer a high-probability short opportunity.
We’re currently holding short positions from $3930, and if ETH extends upward, DCA shorts will activate near $4175 for a better average entry.
📉 Downside targets to watch:
🎯 $3750
🎯 $3636
🎯 $3540
🎯 $3480
Until a confirmed correction forms, avoid aggressive long setups. Market sentiment remains fragile, and bulls may face strong resistance around the upper range.
⚠️ Timeframe: 15-Minute (Scalp / Short-Term Setup)
💡 Tip: Manage risk carefully and trail stops as price moves in your favor.
📊 Follow me on TradingView for more real-time ETH and BTC updates, short-term scalps, and market breakdowns. Your feedback and comments are always welcome!
ETHUSDTBINANCE:ETHUSDT have a amazing trend because this is second the best crypto an head of all project so is in watchlist of best traders.
Support for buy: 3750$
Resistance for targets: 4045 - 4200 - 4435 - 4755
Please your risk management.

CLANKER/USDT — Volume Zone Reclaim Could Ignite Major Reversal CLANKER/USDT — Volume Zone Reclaim Could Ignite Major Reversal Momentum 🔥
CLANKER has successfully rebounded from the $33.9 support zone, entering the key volume zone between $34–$70, which has historically acted as a strong liquidity region. The recent +59% move in volume indicates renewed market interest and early signs of accumulation.
If price continues to hold within this volume zone and confirms a breakout above $40, it could signal the start of a mid-term reversal, with potential upside targets toward $69.8.
📊 Technical Overview:
Support: $33.9
Volume Zone: $34 – $69.8
Breakout Confirmation: Above $40
Bias: Accumulation → Bullish once $40+ holds
The strong recovery candle shows buyers returning aggressively, suggesting that CLANKER could be gearing for a trend shift if momentum sustains above the zone midpoint.
📈 Outlook: Volume-driven reversal zone
🎯 Targets: $40 → $69.8

Don't sleep on Ethereum!Ethereum is following the pattern seen before the 2021 bull run of Bitcoin, and we are now in the final stages before the parabolic run for Ethereum.
CRYPTOCAP:BTC 2017\2021 vs. CRYPTOCAP:ETH 2021\2025

AIA/USDT — Volume Box Reaccumulation Could Lead to New 2025 ATHAIA/USDT — Volume Box Reaccumulation Could Lead to New 2025 ATH 🚀
DeAgentAI (AIA) is developing a solid volume reaccumulation zone between $1.40–$2.15, showing early structural strength after a prolonged consolidation phase.
The pattern suggests that AIA is preparing for a major expansion cycle, with the next key breakout area sitting around $3.65, followed by a potential move toward the $5.00 region — its previous all-time high.
As AI-focused narratives regain strength heading into 2025, AIA could become one of the top performers if this volume box breakout confirms with sustained momentum.
📊 Technical Overview:
Support (Volume Box): $1.40 – $2.15
First Target Zone: $3.65
Major Target / ATH Zone: $5.00+
Bias: Accumulation → Expansion
With strong fundamentals and renewed volume build-up, the structure points to a potential 2025 new ATH scenario, once the $2.15–$3.65 range is reclaimed with volume.
📈 Outlook: Bullish mid-term setup
🎯 Targets: $3.65 → $5.00+

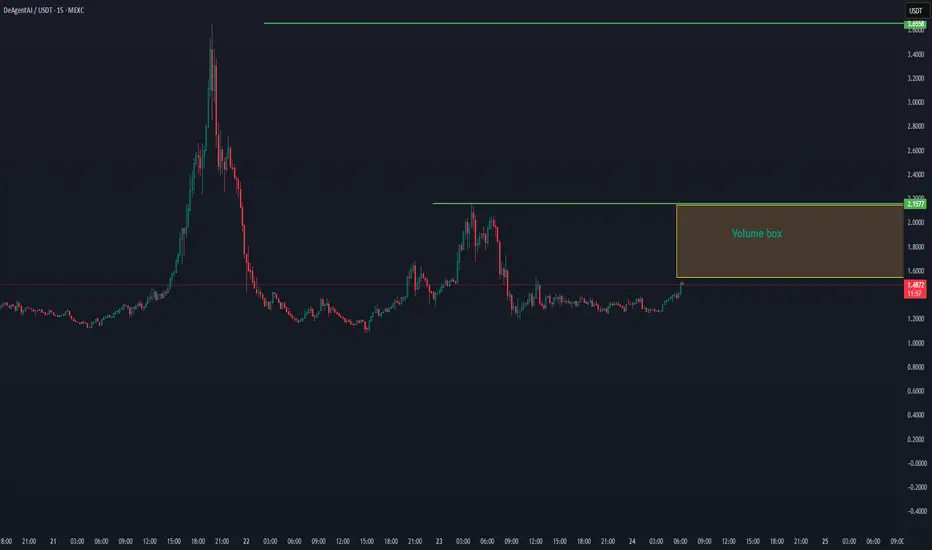
AIA/USDT — Volume Box Forming, Potential Expansion TowardAIA/USDT — Volume Box Forming, Potential Expansion Toward $2.15 🚀
DeAgentAI (AIA) is showing renewed strength after a long consolidation phase, with price now building momentum toward the $1.50–$1.60 zone. The chart highlights a volume box area between $1.50–$2.15, which often acts as a liquidity build-up zone before a strong breakout move.
If AIA confirms continuation inside this range and breaks above $2.15, it could trigger a high-volume expansion, potentially opening a path toward higher time-frame targets.
📊 Technical Overview:
Support Zone: $1.40 – $1.50
Volume Box Range: $1.50 – $2.15
Breakout Level: $2.15
Bias: Accumulation → Bullish
AIA’s structure remains constructive as long as it maintains above the lower range. Watch for volume confirmation near $2.00+ for signs of strong trend continuation.
📈 Outlook: Range buildup with breakout potential
🎯 Targets: $2.15 → $2.80
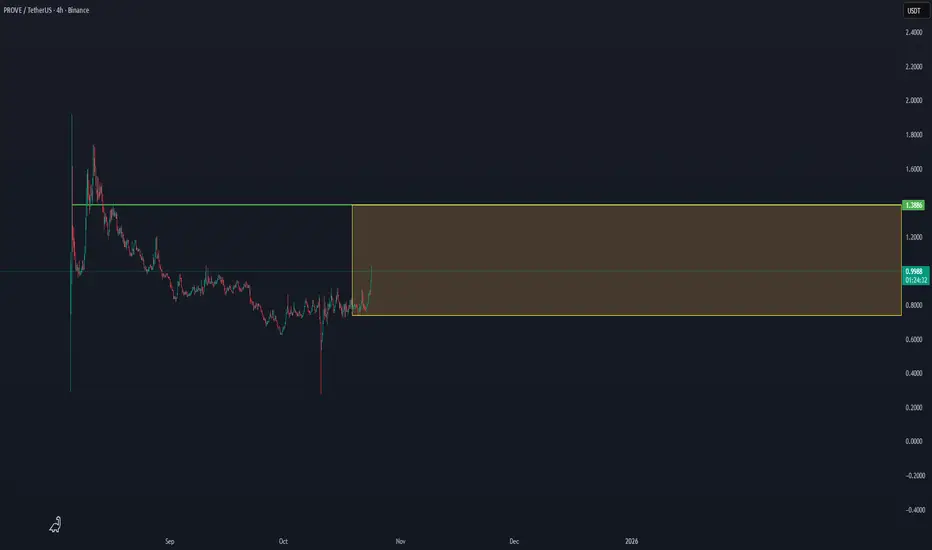
PROVE/USDT — Volume Range Expansion Forming, Eyeing $1.38 PROVE/USDT — Volume Range Expansion Forming, Eyeing $1.38 Breakout 🚀
Prove Network (PROVE) is gaining momentum after a long accumulation phase, now trading near the mid-point of its volume box between $0.74 – $1.38.
This structure indicates a potential accumulation-to-expansion pattern, where sustained buying pressure could push the price toward the upper boundary of the range.
If PROVE confirms a close above $1.38, it would likely initiate a strong breakout continuation, supported by previous high-volume reactions around that zone.
📊 Technical Overview:
Support Zone: $0.74
Range Mid-Level: $0.99
Breakout Level: $1.38
Bias: Accumulation → Bullish continuation
Volume is gradually building, suggesting that buyers are re-entering the market, and the breakout confirmation at $1.38 could trigger a rapid move toward the next major resistance area.
📈 Outlook: Range expansion setup
🎯 Targets: $1.38 → $1.80